

The After-Effects of Theta Burst Stimulation Over the Cortex of the Suprahyoid Muscle on Regional Homogeneity in Healthy Subjects
- PMID: 30881294
- PMCID: PMC6405436
- DOI: 10.3389/fnbeh.2019.00035
The After-Effects of Theta Burst Stimulation Over the Cortex of the Suprahyoid Muscle on Regional Homogeneity in Healthy Subjects
Abstract
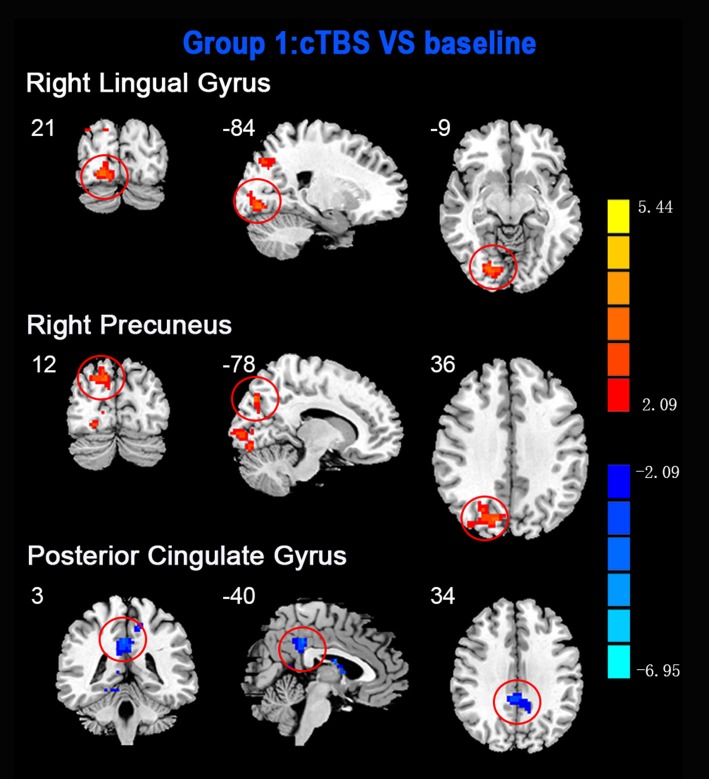
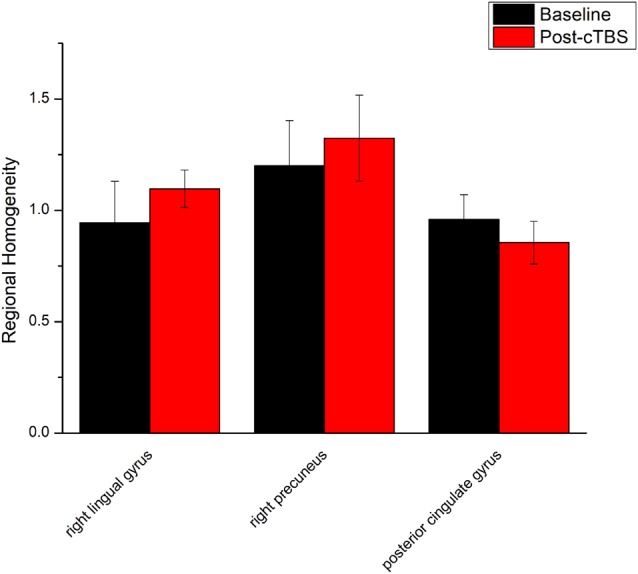
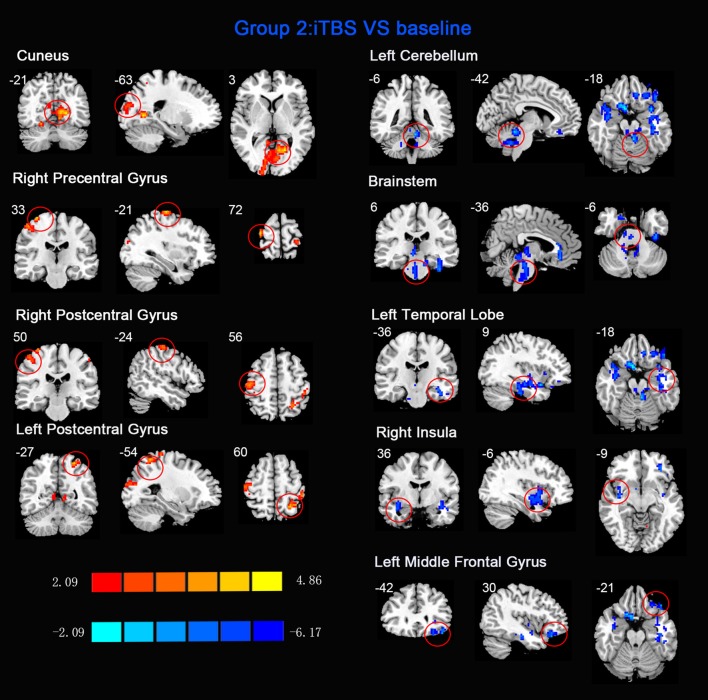
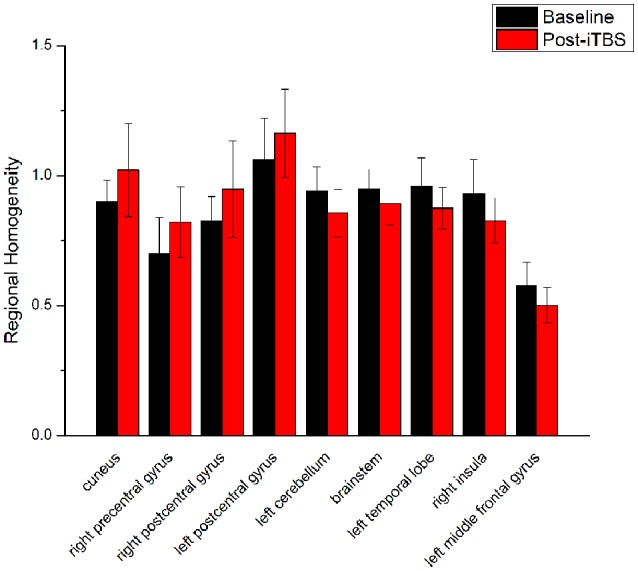
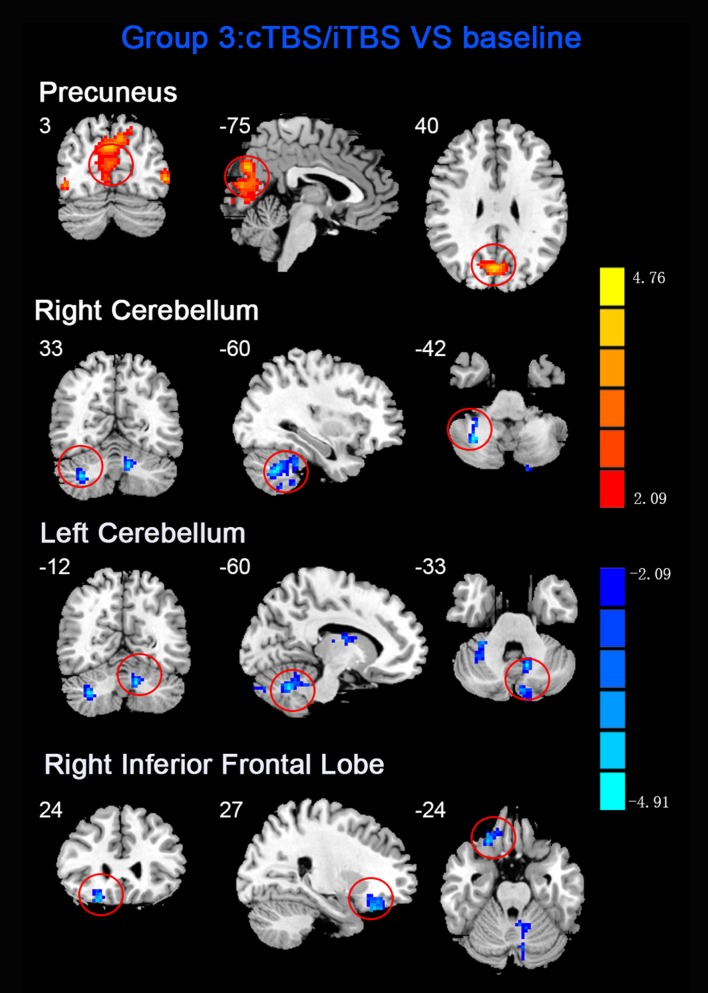
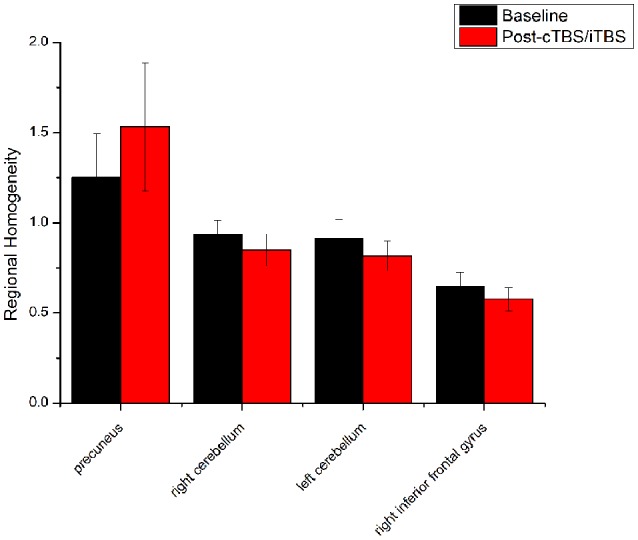
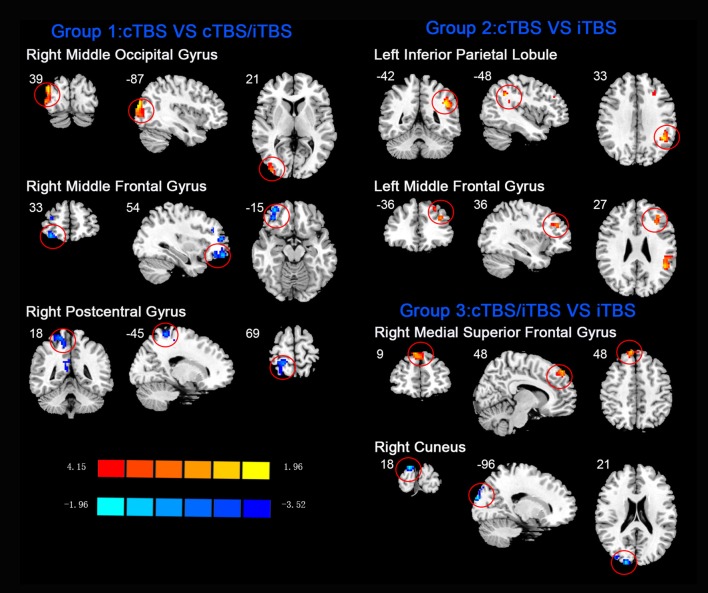
Theta burst stimulation (TBS) is a powerful variant of repetitive transcranial magnetic stimulation (rTMS), making it potentially useful for the treatment of swallowing disorders. However, how dose TBS modulate human swallowing cortical excitability remains unclear. Here, we aim to measure the after-effects of spontaneous brain activity at resting-state using the regional homogeneity (ReHo) approach in healthy subjects who underwent different TBS protocols over the suprahyoid muscle cortex. Sixty healthy subjects (23.45 ± 2.73 years, 30 males) were randomized into three groups which completed different TBS protocols. The TMS coil was applied over the cortex of the suprahyoid muscles. Data of resting-state functional MRI (Rs-fMRI) of the subjects were acquired before and after TBS. The ReHo was compared across sessions [continuous TBS (cTBS), intermittent TBS (iTBS) and cTBS/iTBS] and runs (pre/post TBS). In the comparison between pre- and post-TBS, increased ReHo was observed in the right lingual gyrus and right precuneus and decreased ReHo in the left cingulate gyrus in the cTBS group. In the iTBS group, increased ReHo values were seen in the pre-/postcentral gyrus and cuneus, and decreased ReHo was observed in the left cerebellum, brainstem, bilateral temporal gyrus, insula and left inferior frontal gyrus. In the cTBS/iTBS group, increased ReHo was found in the precuneus and decreased ReHo in the right cerebellum posterior lobe, left anterior cerebellum lobe, and right inferior frontal gyrus. In the post-TBS inter-groups comparison, increased ReHo was seen in right middle occipital gyrus and decreased ReHo in right middle frontal gyrus and right postcentral gyrus (cTBS vs. cTBS/iTBS). Increased ReHo was shown in left inferior parietal lobule and left middle frontal gyrus (cTBS vs. iTBS). Increased ReHo was shown in right medial superior frontal gyrus and decreased ReHo in right cuneus (cTBS/iTBS vs. iTBS). Our findings indicate cTBS had no significant influence on ReHo in the primary sensorimotor cortex, iTBS facilitates an increased ReHo in the bilateral sensorimotor cortex and a decreased ReHo in multiple subcortical areas, and no reverse effect exhibits when iTBS followed the contralateral cTBS over the suprahyoid motor cortex. The results provide a novel insight into the neural mechanisms of TBS on swallowing cortex.
Keywords: functional magnetic resonance; regional homogeneity; resting state; swallowing; theta burst stimulation.
Figures
Similar articles
-
Alterations of the amplitude of low-frequency fluctuation in healthy subjects with theta-burst stimulation of the cortex of the suprahyoid muscles.Neuroscience. 2017 Dec 4;365:48-56. doi: 10.1016/j.neuroscience.2017.09.027. Epub 2017 Sep 23. Neuroscience. 2017. PMID: 28947393
-
Intermittent Theta-Burst Stimulation Reverses the After-Effects of Contralateral Virtual Lesion on the Suprahyoid Muscle Cortex: Evidence From Dynamic Functional Connectivity Analysis.Front Neurosci. 2019 Apr 24;13:309. doi: 10.3389/fnins.2019.00309. eCollection 2019. Front Neurosci. 2019. PMID: 31105511 Free PMC article.
-
Intermittent Theta-Burst Stimulation Over the Suprahyoid Muscles Motor Cortex Facilitates Increased Degree Centrality in Healthy Subjects.Front Hum Neurosci. 2020 Jun 16;14:200. doi: 10.3389/fnhum.2020.00200. eCollection 2020. Front Hum Neurosci. 2020. PMID: 32612517 Free PMC article.
-
The effects of theta burst stimulation (TBS) targeting the prefrontal cortex on executive functioning: A systematic review and meta-analysis.Neuropsychologia. 2018 Mar;111:344-359. doi: 10.1016/j.neuropsychologia.2018.02.004. Epub 2018 Feb 10. Neuropsychologia. 2018. PMID: 29438672
-
Effect of Theta Burst Stimulation-Patterned rTMS on Motor and Nonmotor Dysfunction of Parkinson's Disease: A Systematic Review and Metaanalysis.Front Neurol. 2022 Jan 12;12:762100. doi: 10.3389/fneur.2021.762100. eCollection 2021. Front Neurol. 2022. PMID: 35095722 Free PMC article.
Cited by
-
A systematic review of the neurobiological effects of theta-burst stimulation (TBS) as measured using functional magnetic resonance imaging (fMRI).Brain Struct Funct. 2023 May;228(3-4):717-749. doi: 10.1007/s00429-023-02634-x. Epub 2023 Apr 19. Brain Struct Funct. 2023. PMID: 37072625 Free PMC article.
-
Resting-State fMRI Functional Connectivity Strength Predicts Local Activity Change in the Dorsal Cingulate Cortex: A Multi-Target Focused rTMS Study.Cereb Cortex. 2022 Jun 16;32(13):2773-2784. doi: 10.1093/cercor/bhab380. Cereb Cortex. 2022. PMID: 34689201 Free PMC article.
-
The Effect of Swallowing Action Observation Therapy on Resting fMRI in Stroke Patients with Dysphagia.Neural Plast. 2023 Apr 21;2023:2382980. doi: 10.1155/2023/2382980. eCollection 2023. Neural Plast. 2023. PMID: 37124873 Free PMC article.
-
Theta-Burst Stimulation Combined With Virtual-Reality Reconsolidation Intervention for Methamphetamine Use Disorder: Study Protocol for a Randomized-Controlled Trial.Front Psychiatry. 2022 Jul 5;13:903242. doi: 10.3389/fpsyt.2022.903242. eCollection 2022. Front Psychiatry. 2022. PMID: 35865301 Free PMC article.
References
LinkOut - more resources
Full Text Sources
Miscellaneous