. 2019 Feb 7:2019:7493286.
doi: 10.1155/2019/7493286. eCollection 2019.

Spinal Cord Glycine Transporter 2 Mediates Bilateral ST35 Acupoints Sensitization in Rats with Knee Osteoarthritis

Affiliations

Spinal Cord Glycine Transporter 2 Mediates Bilateral ST35 Acupoints Sensitization in Rats with Knee Osteoarthritis

Fuhai Bai et al. Evid Based Complement Alternat Med. .

Abstract

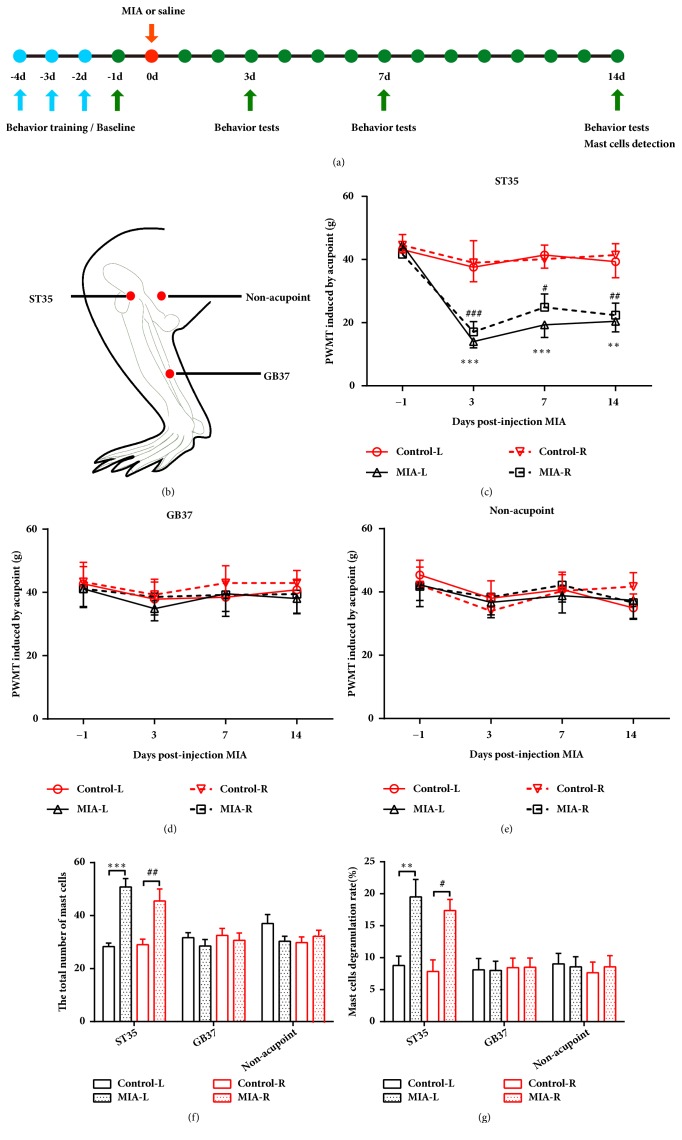
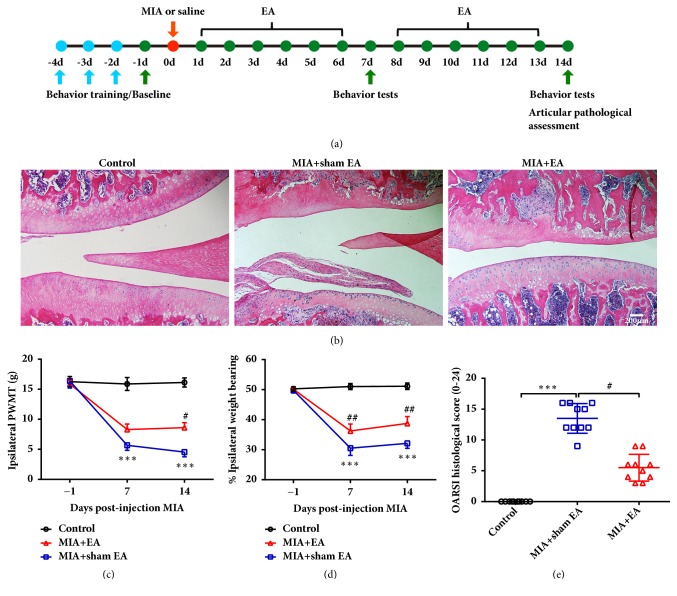
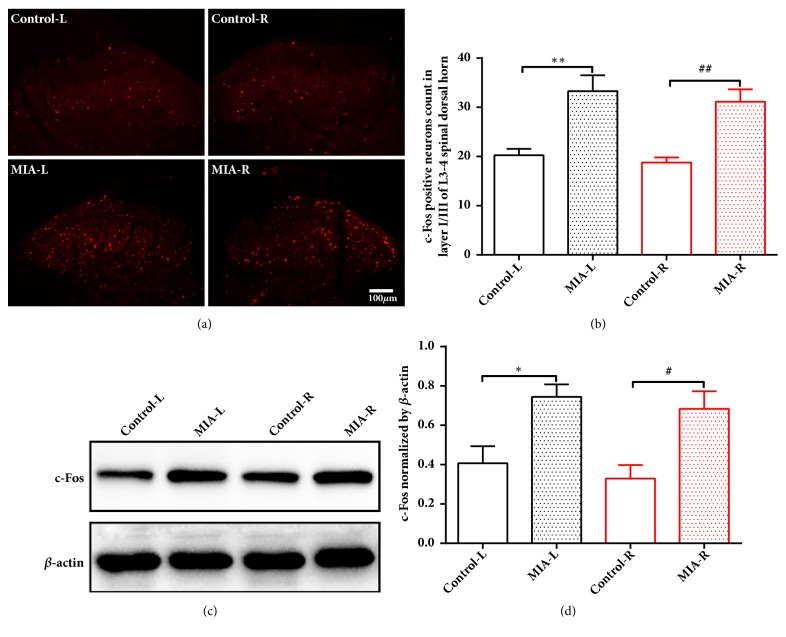
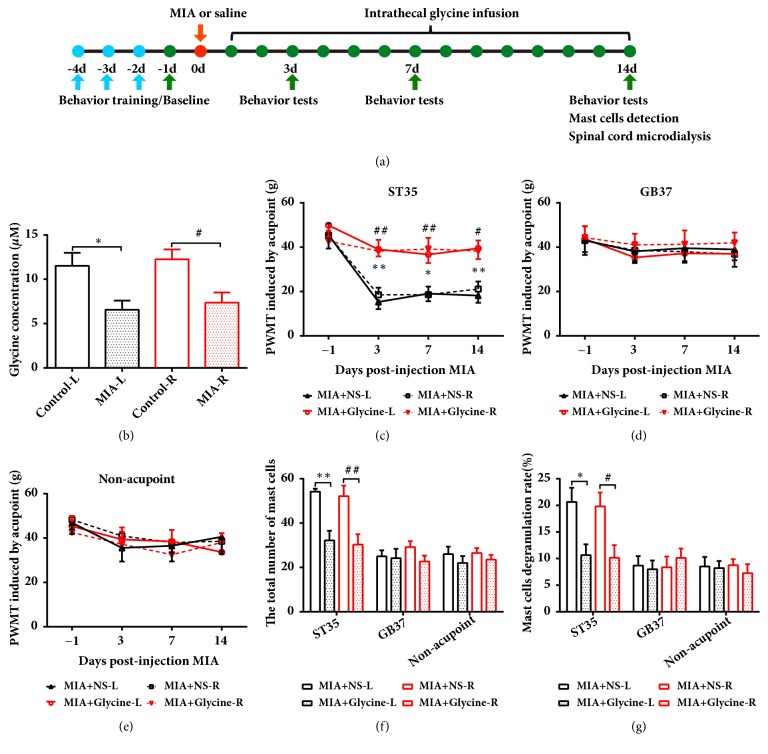
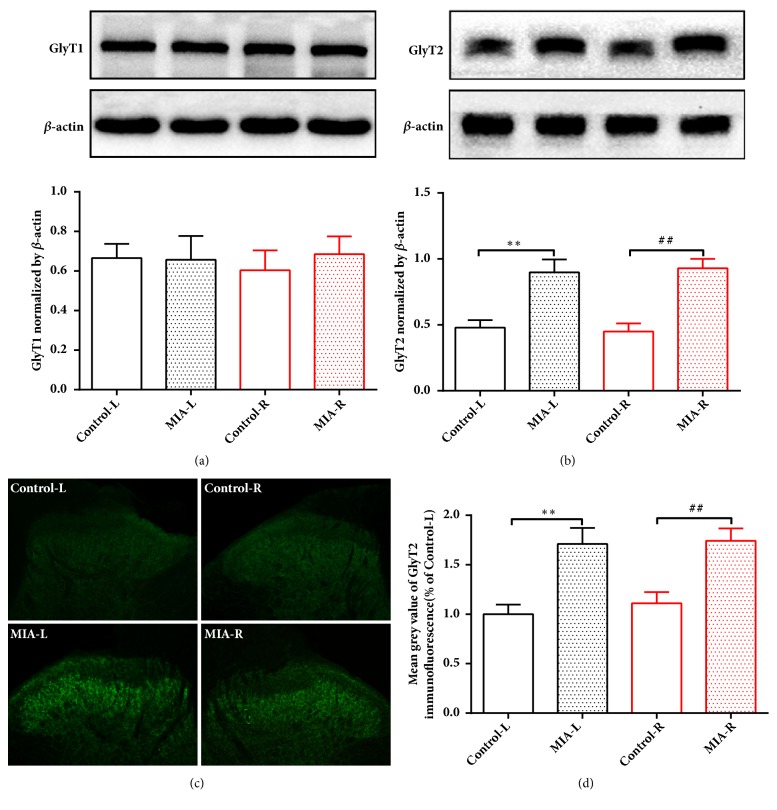
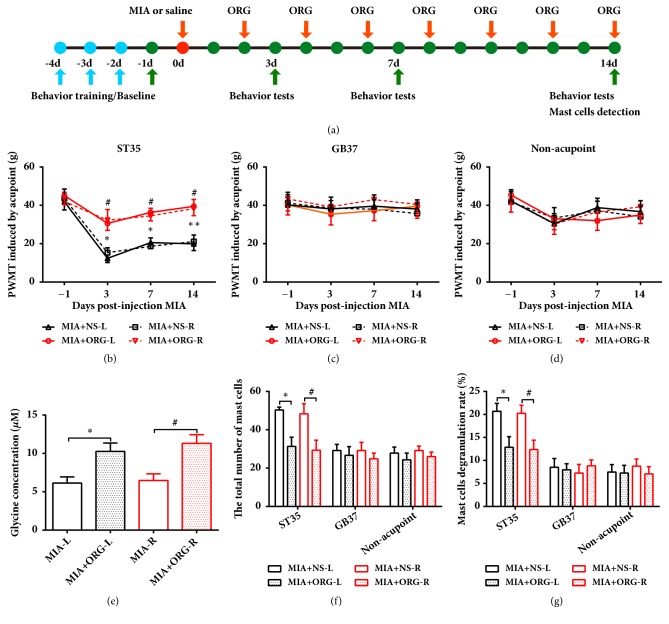
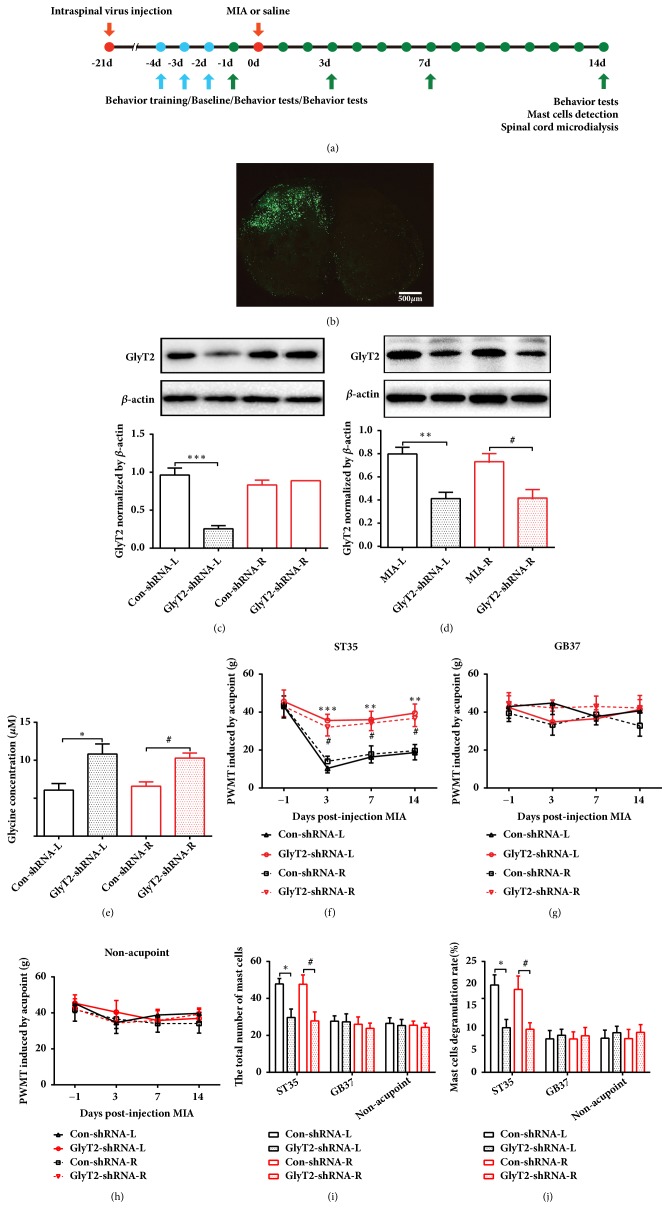
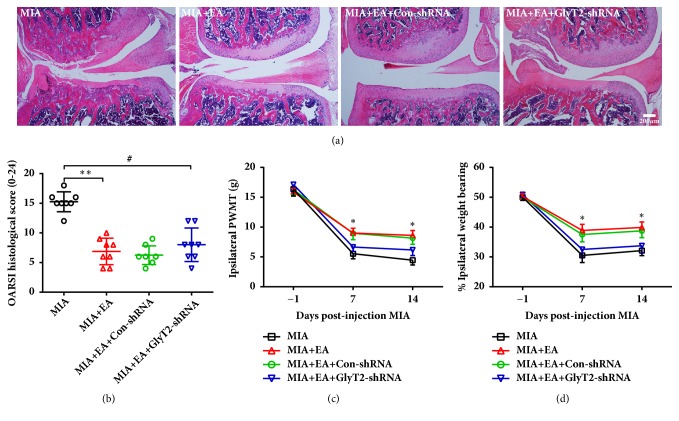
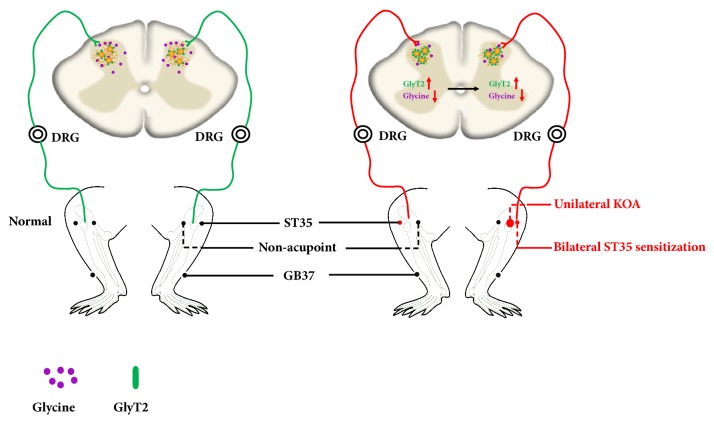
The concept of "acupoint sensitization" refers to the functional status of acupoint switches from silent to active under pathological conditions. In clinic, acupoint sensitization provides important guidance for acupoints selection in different diseases. However, the mechanism behind this phenomenon remains unclear. We generated a model of knee osteoarthritis (KOA) by intra-articular injection of monosodium iodoacetate (MIA) into the left knee of rats. The paw withdrawal mechanical threshold (PWMT) and the total number of mast cells as well as mast cell degranulation rate (MCDR) of acupoint tissue were used to test whether the acupoints were sensitized. The results showed that KOA resulted in a reduced mechanical threshold and elevated total number of mast cell as well as mast cell degranulation rate at bilateral ST35 (Dubi) but not GB37 (Guangming) or nonacupoint area. The acupoint sensitization was accompanied by upregulation of glycine transporter 2 (GlyT2) and reduction of extracellular glycine levels in the bilateral dorsal horns of the spinal cord at L3-5. Selective inhibition of GlyT2 or intrathecal administration of glycine attenuated ST35 acupoint sensitization. The sensitization of bilateral ST35 was blocked after intraspinal GlyT2 short hairpin (sh) RNA (GlyT2-shRNA) microinjection to specifically downregulate GlyT2 expression in the left side (ipsilateral) L3-5 spinal cord dorsal horn before MIA injection. Moreover, electroacupuncture (EA) stimulation at ST35 ameliorated articular pathological lesions and improved KOA-related pain behaviors. GlyT2-shRNA injection reversed EA-induced pain relief but not EA-induced reduction of joint lesions. Overall, this study demonstrated that spinal GlyT2, especially elevated GlyT2 expression in the ipsilateral dorsal horn of the spinal cord, is a crucial mediator of ST35 acupoint sensitization in KOA rats.


Figures

Figure 1
Figure 1
Left KOA induces bilateral ST35, but not GB37 or nonacupoint control area sensitization. (a) Schematic diagram for the time frame of the experiment. (b) The locations of ST35, GB37, and the nonacupoint area. (c-e) Paw withdrawal mechanical threshold at ST35, GB37, and the nonacupoint area. Two-way repeated measures ANOVA followed by Bonferroni's post hoc test was used, ∗∗P < 0.01, and ∗∗∗P < 0.001 versus Control-L group; #P < 0.05, ##P < 0.01, and ###P < 0.001 versus Control-R group; n = 8 per group. ((f) and (g)) The total number of mast cells and the percentages of degranulated mast cells in all groups. One-way ANOVA test followed by Tukey's post hoc test was used, ∗∗P < 0.01, and ∗∗∗P < 0.001 versus Control-L group; #P < 0.05, ##P < 0.01 versus Control-R group; n = 6 per group. All data are shown as the mean ± SEM.
Figure 2
Figure 2
Acupuncture at bilateral ST35 acupoints improved KOA relative behaviors and articular pathology score. (a) Schematic diagram for the time frame of the experiment. (b) Representative H&E staining images for articular pathology assessment in the MIA- and EA-treated groups. The scale bar is 200 μm. (e) OARSI scores are presented as the mean ± SD; Kruskal-Wallis test was used and ∗∗∗P < 0.001 versus Control group; #P < 0.05 versus MIA+sham EA group; n = 10 per group. ((c) and (d)) Paw withdrawal thresholds of the ipsilateral hind paws and weight-bearing deficits were assessed in MIA- and EA-treated rats. Two-way repeated measures ANOVA followed by Bonferroni's post hoc test was used, ∗∗∗P < 0.001 versus Control group; #P < 0.05 and ##P < 0.01 versus MIA+sham EA group; n = 8 per group. Data are presented as the mean ± SEM.
Figure 3
Figure 3
Left KOA induces c-Fos upregulation in bilateral dorsal horns of spianal cord. (a) Representative fluorescent staining image of c-Fos expression at L3-5 dorsal horn (red fluorescence) in control or MIA rats at 14 days after saline or MIA injection. (b) c-Fos-positive cell counts in L3-5, laminae I-III. Scale bar is 100 μm; ∗∗P < 0.01 versus Control-L group; ##P < 0.01 versus Control-R group; n = 8 per group. ((c) and (d)) Western blot analysis for the expression of c-Fos in bilateral L3-L5 spinal cord dorsal horn at 14 days after MIA or saline injection. ∗P < 0.05 versus Control-L group; #P < 0.05 versus Control-R group; n = 6 per group. One-way ANOVA followed by Tukey's post hoc test was used. All data are presented as the mean ± SEM.
Figure 4
Figure 4
Intrathecal glycine administration attenuated acupoint sensitization in KOA rats. (a) Schematic diagram for the time frame of the experiment. (b) The concentration of glycine in bilateral spinal dorsal horn detected by microdialysis in KOA or control rats. One-way ANOVA followed by Tukey's post hoc test was used. ∗P < 0.05 versus Control-L group; #P < 0.05 versus Control-R group; n = 6 per group. (c-e) Paw withdrawal mechanical threshold in bilateral acupoints or nonacupoint areas of KOA and control rats. Two-way repeated-measures ANOVA followed by Bonferroni's post hoc test was used. ∗P < 0.05 and ∗∗P < 0.01 versus MIA+NS-L group; #P < 0.05 and ##P < 0.01 versus MIA+NS-R group; n = 8 per group. ((f) and (g)) The total number of mast cells and the percentages of degranulated mast cells in all groups; n = 6 per group. One-way ANOVA followed by Tukey's post hoc test was used. ∗P < 0.05 and ∗∗P < 0.01 versus MIA+NS-L group; #P < 0.05 and ##P < 0.01 versus MIA+NS-R group; n = 6 per group. All data are presented as the mean ± SEM.
Figure 5
Figure 5
GlyT2 but not GlyT1 was increased in the left KOA rats. ((a) and (b)) Expression of GlyT1 and GlyT2 in bilateral L3-L5 spinal cord dorsal horn at 14 days after MIA or saline injection. ∗∗P < 0.01 versus Control-L group; ##P < 0.01 versus Control-R group; n = 6 per group. (c) Representative fluorescent staining images (green fluorescence) of GlyT2 expression in the spinal cord dorsal horn at L3-5 in control and MIA rats. (d) Mean gray value of GlyT2 expression in L3-L5, laminae I-III. Scale bar is 100 μm; ∗∗P < 0.01 versus Control-L group; ##P < 0.01 versus Control-R group; n = 8 per group. All data are presented as the mean ± SEM; one-way ANOVA followed by Tukey's post hoc test was used.
Figure 6
Figure 6
Selective inhibition of GlyT2 attenuated ST35 acupoint sensitization in KOA rats. (a) Schematic diagram for the time frame of the experiment. (b-d) Paw withdrawal mechanical threshold was assessed by stimulating at bilateral ST35, GB37, or nonacupoint. ∗P < 0.05 and ∗∗P < 0.01 versus MIA+NS-L group; #P < 0.05 versus MIA+NS-R group; n = 8 per group. Two-way repeated-measures ANOVA followed by Bonferroni's post hoc test was used. (e) The concentration of glycine in bilateral spinal dorsal horn detected by microdialysis in unilateral KOA or ORG injected rats. One-way ANOVA followed by Tukey's post hoc test was used. ∗P < 0.05 versus MIA+ORG-L group; #P < 0.05 versus MIA+ORG-R group; n = 6 per group. ((f) and (g)) The total number of mast cells and the percentages of degranulated mast cells in all groups; One-way ANOVA followed by Tukey's post hoc test was used. ∗P < 0.05 versus MIA+NS-L group; #P < 0.05 versus MIA+NS-R group; n = 6 per group. All data are presented as the mean ± SEM. ORG: ORG25543.
Figure 7
Figure 7
Ipsilateral downregulation of GlyT2 by GlyT2-shRNA attenuated ST35 acupoint sensitization in KOA rats. (a) Schematic diagram for the time frame of the experiment. (b) Representative image of GlyT2-shRNA expression in the L3-L5 ipsilateral spinal cord dorsal horn. The scale bar is 500 μm. ((c) and (d)) Western blot analysis for the expression of GlyT2 at 21 days after GlyT2-shRNA injection in wild-type rats and unilateral KOA rats, respectively. One-way ANOVA followed by Tukey's post hoc test was used. ∗∗∗P < 0.001 versus Control-shRNA-L group; n = 4 per group. (d) Western blot analysis for the expression of GlyT2 at 21 days after GlyT2-shRNA injection in unilateral KOA rats. One-way ANOVA followed by Tukey's post hoc test was used. ∗∗∗P < 0.001 versus Control-shRNA-L group; n = 4 per group. (e) The concentration of glycine in the spinal dorsal horn detected by microdialysis after GlyT2-shRNA injection. One-way ANOVA followed by Tukey's post hoc test was used. ∗P < 0.05 versus Control-shRNA-L group; #P < 0.05 versus Control-shRNA-R group; n = 6 per group. (f-h) Paw withdrawal mechanical threshold at bilateral ST35, GB37 and nonacupoint area, respectively. Two-way repeated-measures ANOVA followed by Bonferroni's post hoc test was used. ∗∗P < 0.01, ∗∗∗P < 0.001 versus Control-shRNA -L group; #P < 0.05 versus Control-shRNA-R group; n = 8 per group. ((i) and (j)) The total number of mast cells and the percentages of degranulated mast cells in all groups. One-way ANOVA followed by Tukey's post hoc test was used. ∗P < 0.05 versus MIA+NS-L group; #P < 0.05 versus MIA+NS-R group; n = 6 per group. All data are presented as the mean ± SEM.
Figure 8
Figure 8
Downregulation of GlyT2 by GlyT2-shRNA partially reversed EA-induced analgesia in KOA rats. (a) Representative H&E staining for articular pathology in each group. The scale bar is 200 μm. (b) OARSI scores are presented as the mean ± SD; Kruskal-Wallis test was used, ∗∗P < 0.01 versus MIA group; #P < 0.05 versus MIA group; n = 8 per group. ((c) and (d)) Paw withdrawal mechanical thresholds of the ipsilateral hind paw and weight-bearing deficits were assessed. Data are presented as the mean ± SEM; two-way repeated measures ANOVA followed by Bonferroni's post hoc test was used.
Figure 9
Figure 9
Illustration of mechanism underlying ipsilateral GlyT2 reduction-mediated bilateral ST35 sensitization in KOA rats. (a) Under physiological conditions, peripheral sensory input arises from the knee via the dorsal root ganglion and spinal cord dorsal horn up to the cerebral. Acupoints (ST35 and GB37) and nonacupoint area sensory input pathways are intact and exhibit normal reception of peripheral stimuli. (b) Under pathological conditions such as KOA, noxious stimuli induce firstly ipsilateral then contralateral GlyT2 expression elevation and reduced extracellular glycine concentration in both sides. These molecular alterations in the lumber spinal cord dorsal horn induce specific bilateral ST35, but not GB37 or nonacupoint area sensitization.

Similar articles

Cited by

References

    1. Rong P. J., Li S., Ben H., et al. Peripheral and spinal mechanisms of acupoint sensitization phenomenon. Evidence-Based Complementary and Alternative Medicine. 2013;2013:6. doi: 10.1155/2013/742195.742195 - DOI - PMC - PubMed
    1. Rong P.-J., Zhang J.-L., Zhang H.-Q. Interactions between tactile and noxious visceral inputs in rat nucleus gracilus. Neuroscience Letters. 2004;362(2):162–165. doi: 10.1016/j.neulet.2004.03.022. - DOI - PubMed
    1. Rong P. J., Zhao J. J., Yu L. L., et al. Function of nucleus ventralis posterior lateralis thalami in acupoint sensitization phenomena. Evidence-Based Complementary and Alternative Medicine. 2015;2015:6. doi: 10.1155/2015/516851.516851 - DOI - PMC - PubMed
    1. Sivilotti L., Woolf C. J. The contribution of GABA(A) and glycine receptors to central sensitization: disinhibition and touch-evoked allodynia in the spinal cord. Journal of Neurophysiology. 1994;72(1):169–179. doi: 10.1152/jn.1994.72.1.169. - DOI - PubMed
    1. Hermanns H., Muth-Selbach U., Williams R., et al. Differential effects of spinally applied glycine transporter inhibitors on nociception in a rat model of neuropathic pain. Neuroscience Letters. 2008;445(3):214–219. doi: 10.1016/j.neulet.2008.09.012. - DOI - PubMed

LinkOut - more resources