

Pushing the limits of concertedness. A waltz of wandering carbocations
- PMID: 30881640
- PMCID: PMC6385557
- DOI: 10.1039/c8sc03567a
Pushing the limits of concertedness. A waltz of wandering carbocations
Abstract
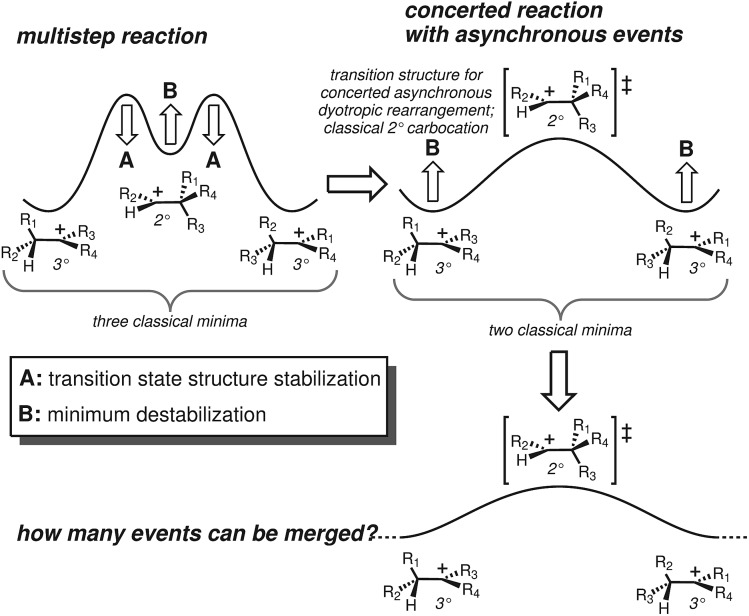
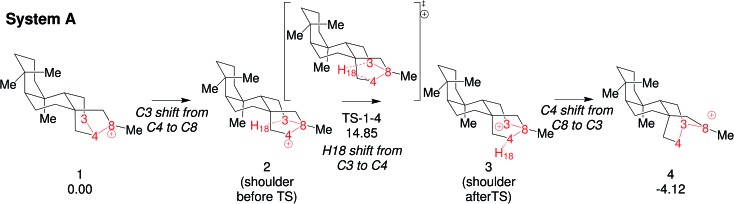
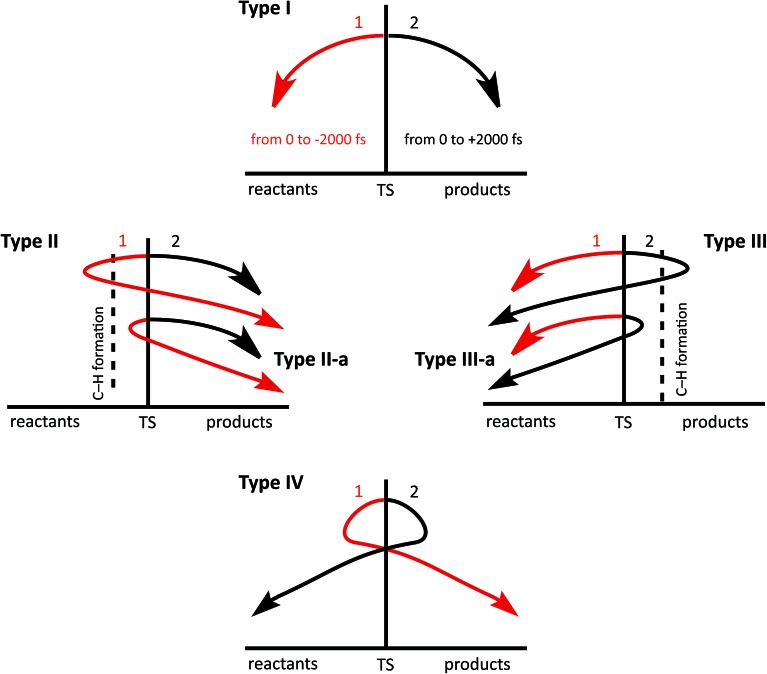
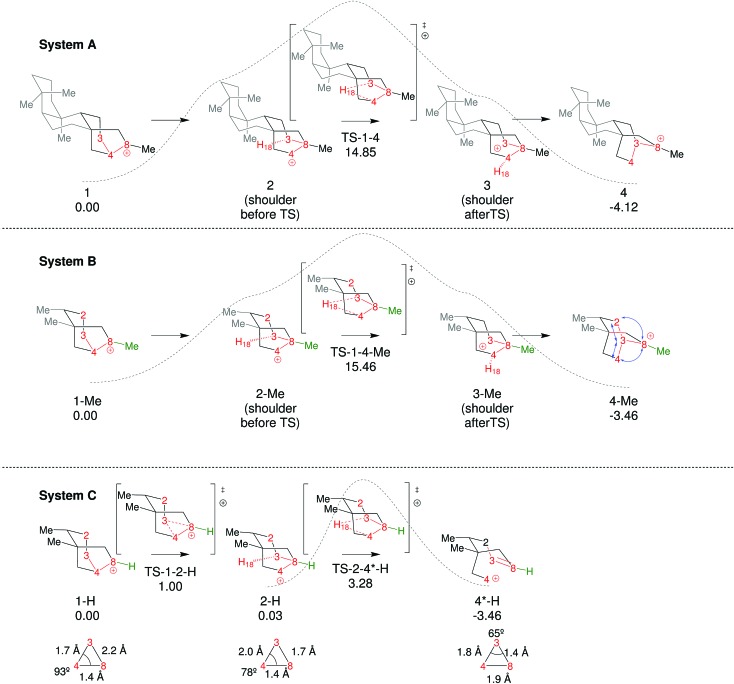
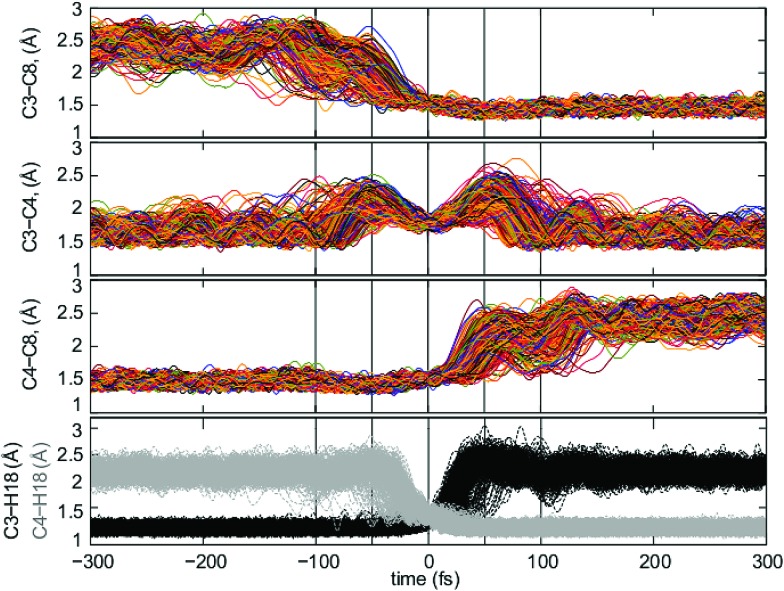
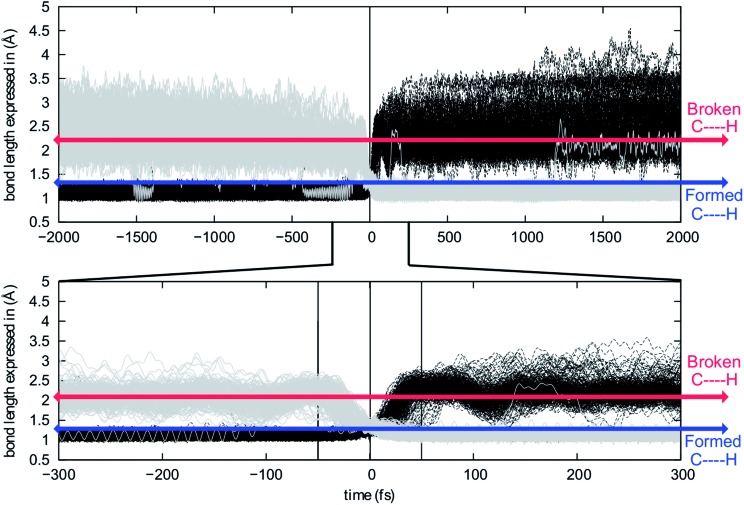
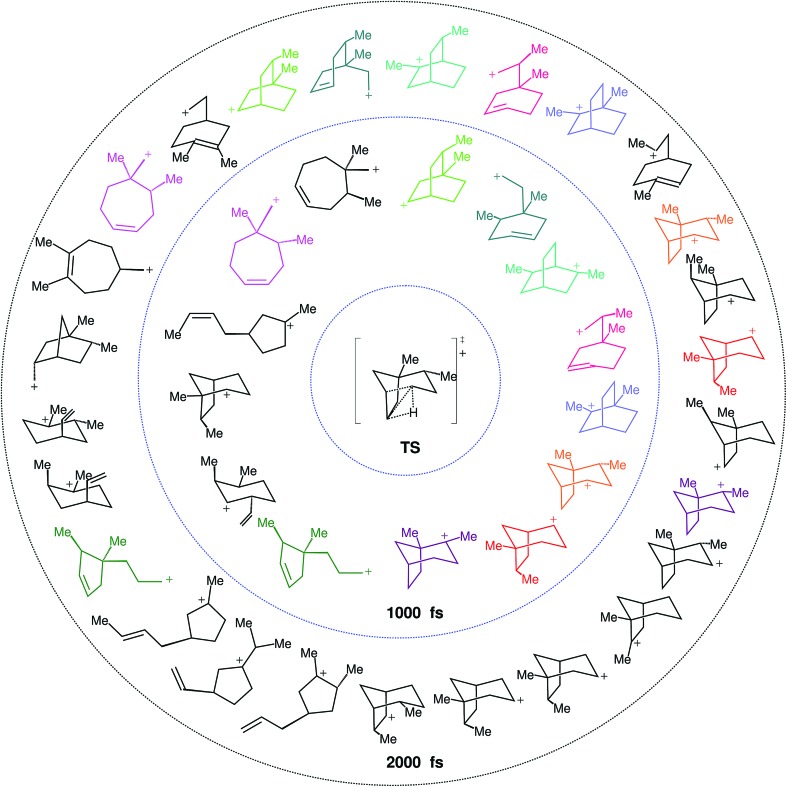
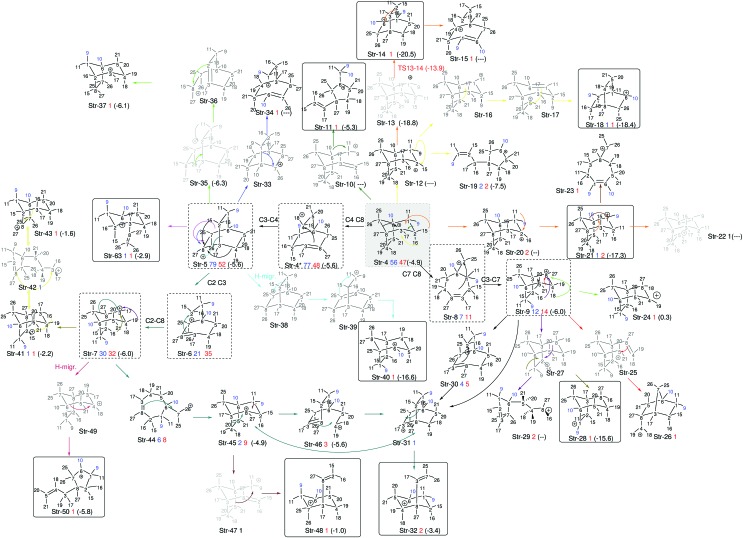
Among the array of complex terpene-forming carbocation cyclization/rearrangement reactions, the so-called "triple shift" reactions are among the most unexpected. Such reactions involve the asynchronous combination of three 1,n-shifts into a concerted process, e.g., a 1,2-alkyl shift followed by a 1,3-hydride shift followed by a second 1,2-alkyl shift. This type of reaction so far has been proposed to occur during the biosynthesis of diterpenes and the sidechains of sterols. Here we describe efforts to push the limits of concertedness in this type of carbocation reaction by designing, and characterizing with quantum chemical computations, systems that could couple additional 1,n-shift events to a triple shift leading, in principle to quadruple, pentuple, etc. shifts. While our designs did not lead to clear-cut examples of quadruple, etc. shifts, they did lead to reactions with surprisingly flat energy surfaces where more than five chemical events connect reactants and plausible products. Ab initio molecular dynamics simulations demonstrate that the formal minima on these surfaces interchange on short timescales, both with each other and with additional unexpected structures, allowing us a glimpse into a very complex manifold that allows ready access to great structural diversity.
Figures
Similar articles
-
Quantum Chemical Interrogation of Reactions Promoted by Dirhodium Tetracarboxylate Catalysts─Mechanism, Selectivity, and Nonstatistical Dynamic Effects.Acc Chem Res. 2024 Jul 16;57(14):1931-1940. doi: 10.1021/acs.accounts.4c00214. Epub 2024 Jun 26. Acc Chem Res. 2024. PMID: 38920276
-
Quantum chemical study of solvent and substituent effects on the 1,5-hydride shift in 2,6-dimethyl-2-heptyl cations.J Phys Chem A. 2006 Feb 9;110(5):1868-74. doi: 10.1021/jp0554994. J Phys Chem A. 2006. PMID: 16451019
-
Formation of beyerene, kaurene, trachylobane, and atiserene diterpenes by rearrangements that avoid secondary carbocations.J Am Chem Soc. 2010 Apr 21;132(15):5375-86. doi: 10.1021/ja9084786. J Am Chem Soc. 2010. PMID: 20353180
-
The carbocation continuum in terpene biosynthesis--where are the secondary cations?Chem Soc Rev. 2010 Aug;39(8):2847-54. doi: 10.1039/b917107j. Epub 2010 May 4. Chem Soc Rev. 2010. PMID: 20442917 Review.
-
Assembly-Line Catalysis in Bifunctional Terpene Synthases.Acc Chem Res. 2021 Oct 19;54(20):3780-3791. doi: 10.1021/acs.accounts.1c00296. Epub 2021 Jul 13. Acc Chem Res. 2021. PMID: 34254507 Free PMC article. Review.
Cited by
-
Bouncing off walls - widths of exit channels from shallow minima can dominate selectivity control.Chem Sci. 2020 Aug 31;11(36):9937-9944. doi: 10.1039/d0sc04036c. Chem Sci. 2020. PMID: 34094255 Free PMC article.
-
Dual-Hydrogen-Bond Donor and Brønsted Acid Cocatalysis Enables Highly Enantioselective Protio-Semipinacol Rearrangement Reactions.J Am Chem Soc. 2023 Jul 19;145(28):15036-15042. doi: 10.1021/jacs.3c02960. Epub 2023 Jul 10. J Am Chem Soc. 2023. PMID: 37428959 Free PMC article.
-
Revisiting a classic carbocation - DFT, coupled-cluster, and ab initio molecular dynamics computations on barbaralyl cation formation and rearrangements.Chem Sci. 2024 Aug 27;15(38):15577-87. doi: 10.1039/d4sc04829f. Online ahead of print. Chem Sci. 2024. PMID: 39268206 Free PMC article.
-
Biomimetic Cationic Cyclopropanation Enables an Efficient Chemoenzymatic Synthesis of 6,8-Cycloeudesmanes.J Am Chem Soc. 2023 Mar 15;145(10):5855-5863. doi: 10.1021/jacs.2c13116. Epub 2023 Feb 28. J Am Chem Soc. 2023. PMID: 36854118 Free PMC article.
-
Tipping the balance: theoretical interrogation of divergent extended heterolytic fragmentations.Chem Sci. 2020 Jan 9;11(8):2231-2242. doi: 10.1039/c9sc05161a. eCollection 2020 Feb 28. Chem Sci. 2020. PMID: 32190279 Free PMC article.