

Brain Function in Gulf War Illness (GWI) and Associated Mental Health Comorbidities
- PMID: 30882065
- PMCID: PMC6417922
Brain Function in Gulf War Illness (GWI) and Associated Mental Health Comorbidities
Abstract
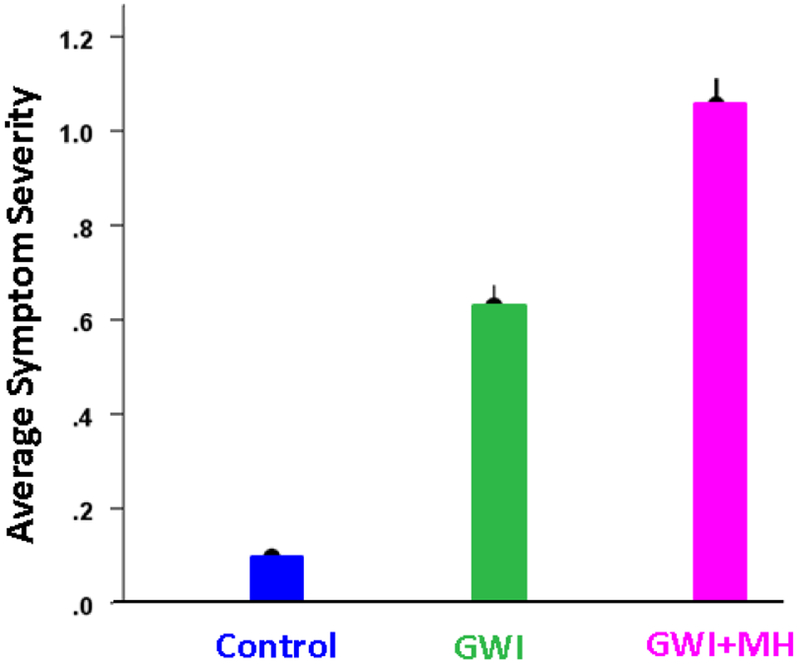
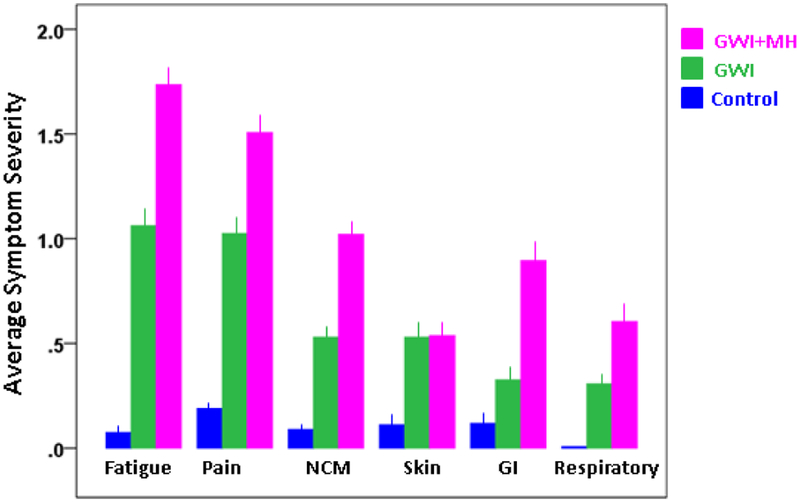
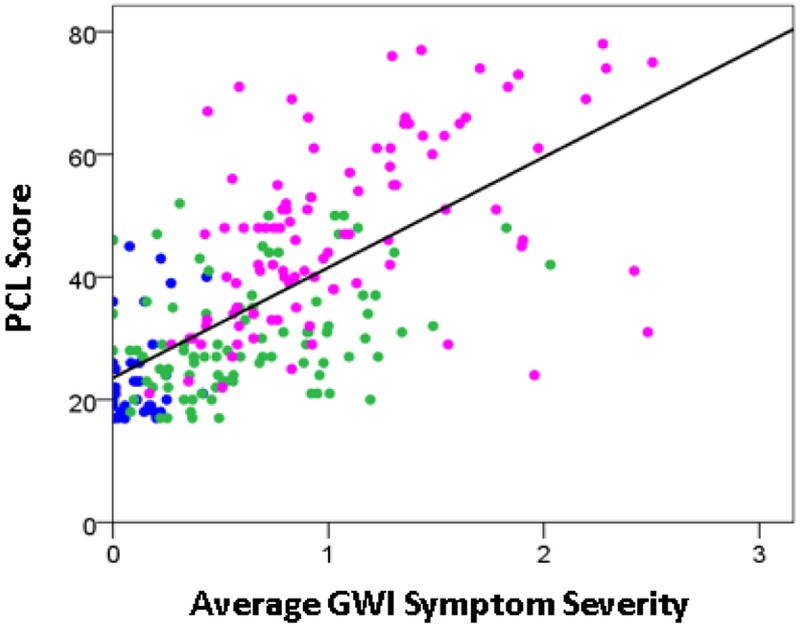
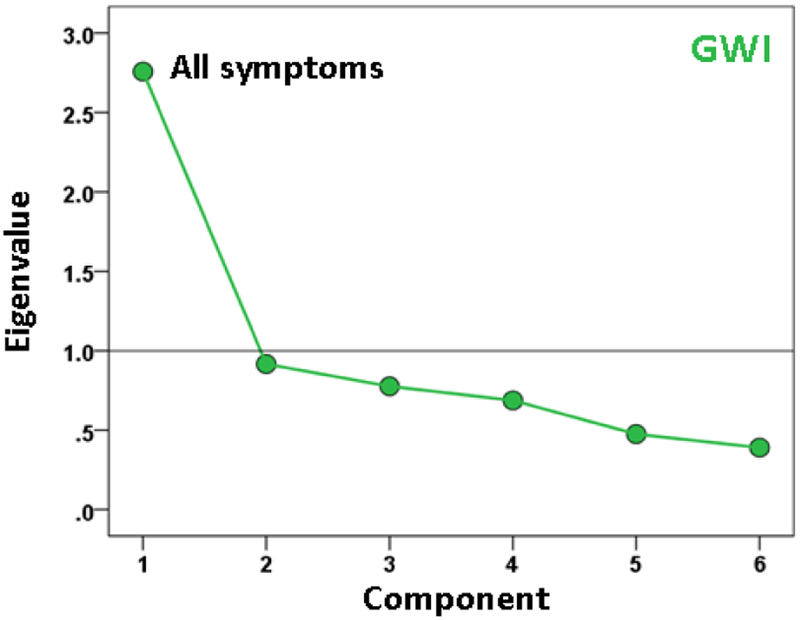
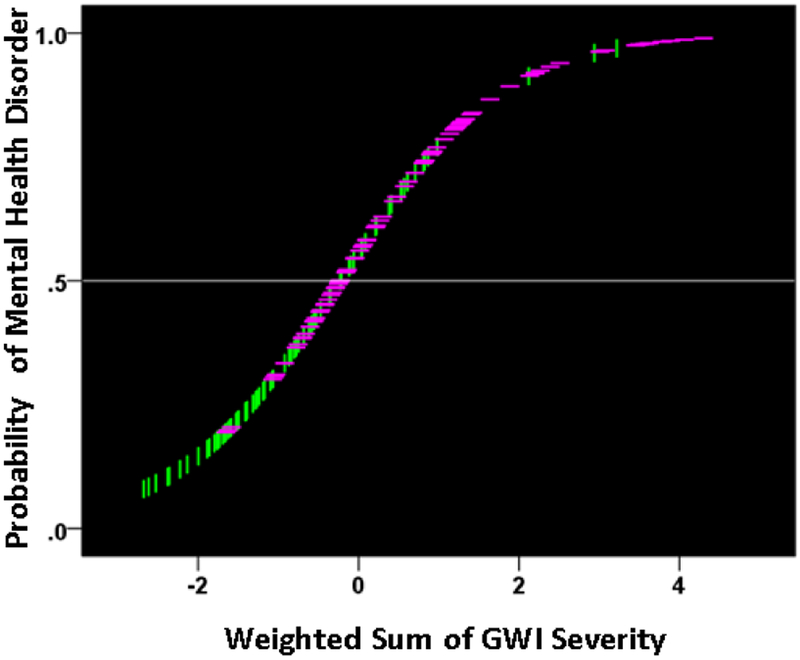
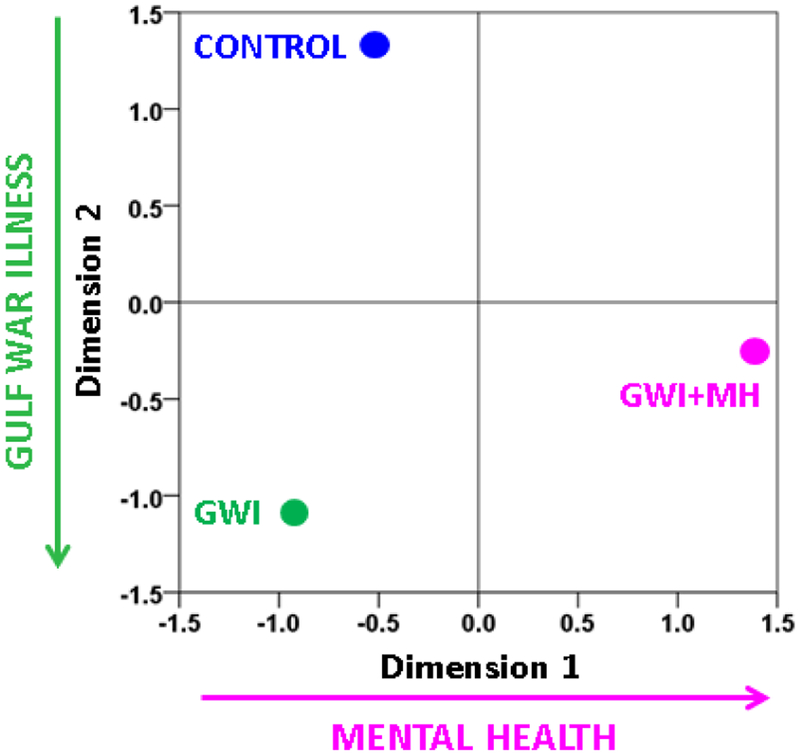
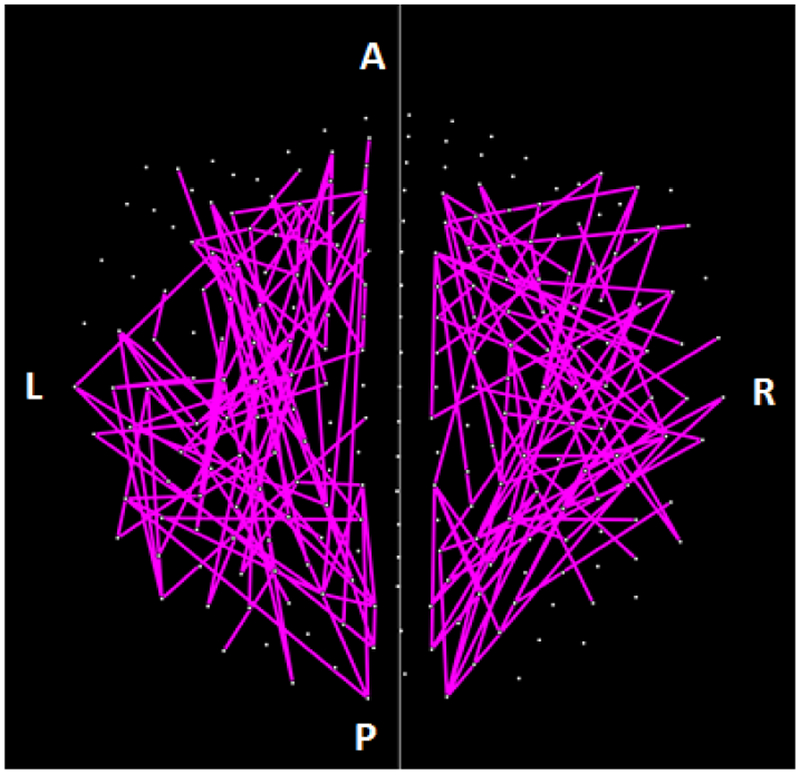
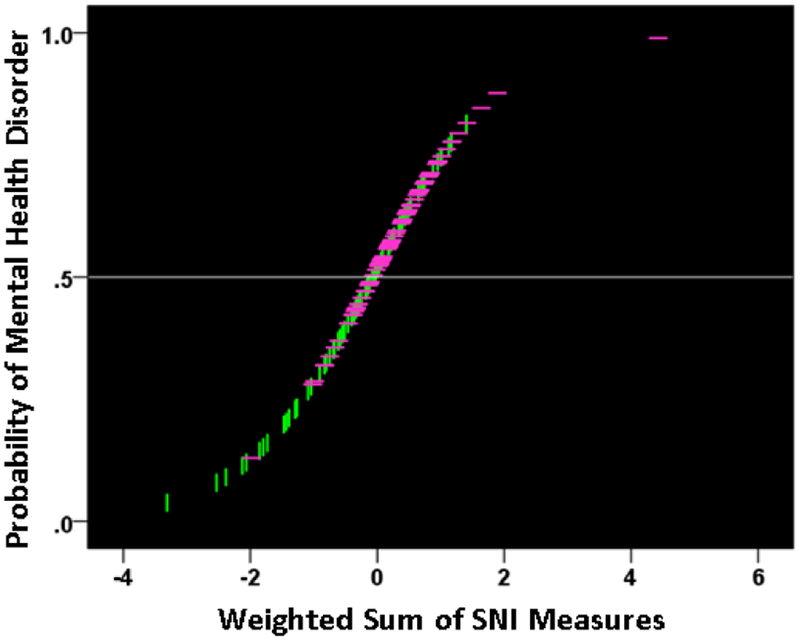
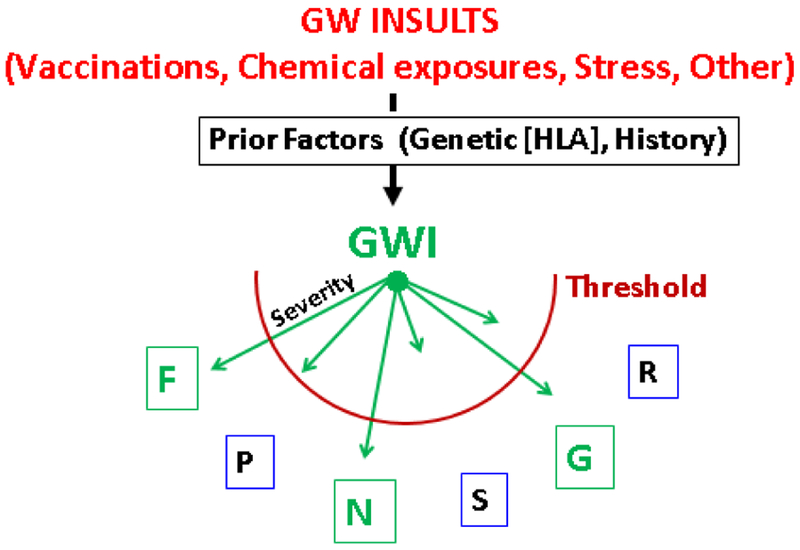
GWI has affected a substantial number of Gulf War (GW) veterans. The disease involves several organ systems among which the brain is most prominent. Neurological, cognitive and mood-related (NCM) symptoms frequently dominate and are at the root of chronic ill-health and disability in veterans suffering from GWI. In addition, such symptoms frequently co-occur with diagnosable mental health disorders, predominantly posttraumatic stress disorder (PTSD). Here we investigated the possibility that increased GWI severity leads, above a threshold, to a diagnosable mental health disorder (excluding psychosis). For this purpose, we used, in separate analyses, symptom severity scores and resting-state brain functional connectivity patterns, as determined by magnetoencephalography (MEG). Two-hundred-thirty GW-era veterans participated in this study. They completed diagnostic interviews to establish the presence of GWI and assess mental health status. This distinguished 3 groups: healthy controls (N = 41), veterans with GWI and no mental illness (GWI group, N = 91), and veterans with both GWI and mental health disorder (GWI+MH, N = 98). For each veteran, symptom severity scores in the 6 GWI domains (fatigue, pain, NCM, skin, gastrointestinal, respiratory) were available as well as 9 summary measures of the distribution of Synchronous Neural Interactions (SNI) derived from the MEG recordings. We tested the hypothesis that, in the presence of GWI, the appearance of a diagnosable mental health disorder may depend on GWI symptom severity. For that purpose, we performed a logistic regression on the GWI population, where the presence (or absence) of the MH disorder was the dependent variable and the age- and gender-adjusted GWI severity in the 6-symptom domains were the predictors. The outcome was the probability that a participant will have MH disorder or not. Similarly, we tested the hypothesis that the presence of the MH disorder can be predicted by the SNI distribution patterns by performing a second logistic regression as above but with the 9 SNI measures as predictors. We found GWI symptom severity differed significantly across groups (GWI+MH > GWI > Control). SNI distributions of the GWI group also differed significantly from the other groups in a systematic hemispheric pattern, such that the presence of GWI involved predominantly the left hemisphere, and presence of mental health disorders involved, in addition, the right hemisphere. Both logistic regressions yielded highly significant outcomes, demonstrating that both GWI symptom severity and SNI distribution measures can predict the presence of MH disorder in GWI. Remarkably, the prediction probabilities for MH presence derived from the symptom-based and SNI-based logistic regressions were positively and highly statistically significantly correlated. Taken together, both objective (neural) and subjective (symptoms) indices suggest that GWI is distinct from healthy controls and varies in severity in a continuum that leads, at the higher end, to a diagnosable MH disorder. The positive correlation between the GWI symptom-based and brain-based predicted classifications provides a key link between GWI symptom severity and synchronous neural interactions in the context of mental illness.
Keywords: Gulf War Illness (GWI); Magnetoencephalography; Posttraumatic Stress Disorder (PTSD); Veterans.
Figures


References
-
- Fukuda K, Nisenbaum R, Stewart G, et al. Chronic multisymptom illness affecting Air Force veterans of the Gulf War. JAMA. 1998; 280: 981–988. - PubMed
-
- Gray GC, Reed RJ, Kaiser KS, et al. Self-reported symptoms and medical conditions among 11,868 gulf war-era veterans: The Seabee health study. Am J Epidemiol. 2002; 155(11): 1033–1044. - PubMed
-
- Kang HK, Li B, Mahan CM, et al. Health of US veterans of 1991 Gulf War: a follow-up survey in 10 years. J Occup Environ Med. 2009; 51: 401–410. - PubMed
-
- Steele L Prevalence and patterns of Gulf War illness in Kansas veterans: association of symptoms with characteristics of person, place, and time of military service. Am J Epidemiol. 2000; 152: 992–1002. - PubMed
-
- Engel CC, Liu X, McCarthy BD, et al. Relationship of physical symptoms to posttraumatic stress disorder among veterans seeking care for Gulf War-related health concerns. Psychosom Med. 2000; 62: 739–745. - PubMed
Grants and funding
LinkOut - more resources
Full Text Sources