

Long-Term Consumption of Sugar-Sweetened and Artificially Sweetened Beverages and Risk of Mortality in US Adults
- PMID: 30882235
- PMCID: PMC6488380
- DOI: 10.1161/CIRCULATIONAHA.118.037401
Long-Term Consumption of Sugar-Sweetened and Artificially Sweetened Beverages and Risk of Mortality in US Adults
Abstract
Background: Whether consumption of sugar-sweetened beverages (SSBs) or artificially sweetened beverages (ASBs) is associated with risk of mortality is of public health interest.
Methods: We examined associations between consumption of SSBs and ASBs with risk of total and cause-specific mortality among 37 716 men from the Health Professional's Follow-up study (from 1986 to 2014) and 80 647 women from the Nurses' Health study (from 1980 to 2014) who were free from chronic diseases at baseline. Cox proportional hazards regression was used to estimate hazard ratios and 95% confidence intervals.
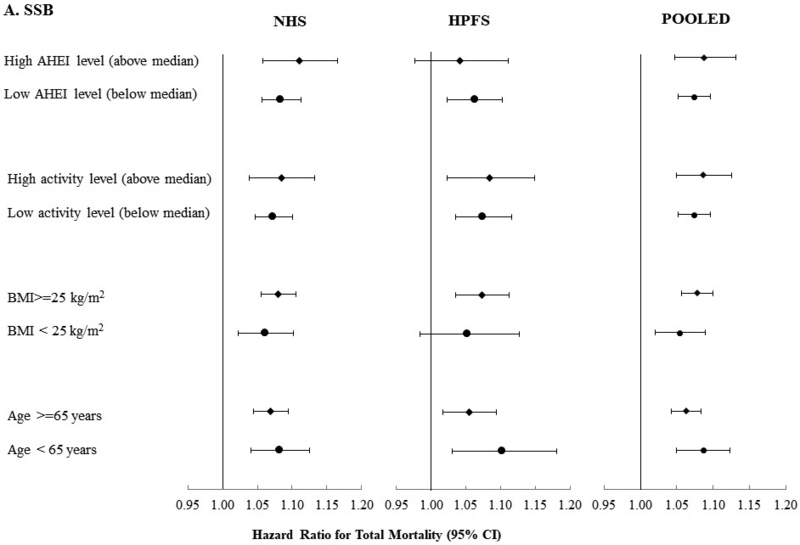
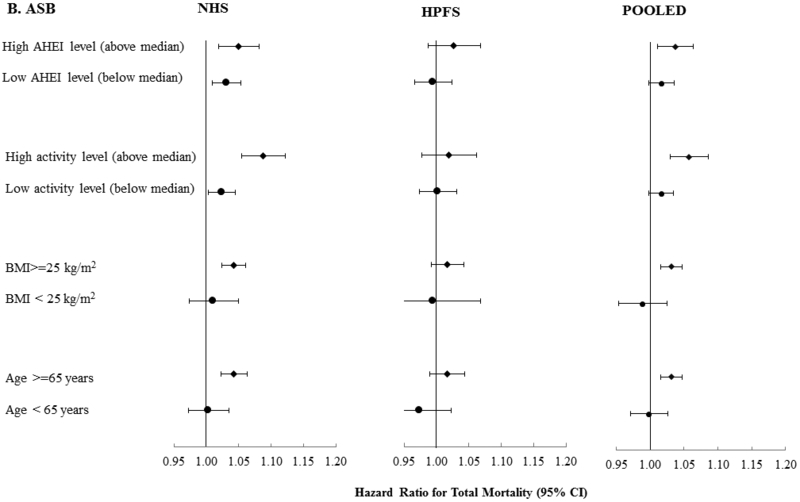
Results: We documented 36 436 deaths (7896 cardiovascular disease [CVD] and 12 380 cancer deaths) during 3 415 564 person-years of follow-up. After adjusting for major diet and lifestyle factors, consumption of SSBs was associated with a higher risk of total mortality; pooled hazard ratios (95% confidence intervals) across categories (<1/mo, 1-4/mo, 2-6/week, 1-<2/d, and ≥2/d) were 1.00 (reference), 1.01 (0.98, 1.04), 1.06 (1.03, 1.09), 1.14 (1.09, 1.19), and 1.21 (1.13, 1.28; P trend <0.0001). The association was observed for CVD mortality (hazard ratio comparing extreme categories was 1.31 [95% confidence interval, 1.15, 1.50], P trend <0.0001) and cancer mortality (1.16 [1.04, 1.29], P trend =0.0004). ASBs were associated with total and CVD mortality in the highest intake category only; pooled hazard ratios (95% confidence interval) across categories were 1.00 (reference), 0.96 (0.93, 0.99), 0.97 (0.95, 1.00), 0.98 (0.94, 1.03), and 1.04 (1.02, 1.12; P trend = 0.01) for total mortality and 1.00 (reference), 0.93 (0.87, 1.00), 0.95 (0.89, 1.00), 1.02 (0.94, 1.12), and 1.13 (1.02, 1.25; P trend = 0.02) for CVD mortality. In cohort-specific analysis, ASBs were associated with mortality in NHS (Nurses' Health Study) but not in HPFS (Health Professionals Follow-up Study) ( P interaction, 0.01). ASBs were not associated with cancer mortality in either cohort.
Conclusions: Consumption of SSBs was positively associated with mortality primarily through CVD mortality and showed a graded association with dose. The positive association between high intake levels of ASBs and total and CVD mortality observed among women requires further confirmation.
Keywords: all-cause death; artificially sweetened beverages; cardiovascular death; low calorie beverages; sugar-sweetened beverages.
Conflict of interest statement
Figures
Comment in
-
Last Nail in the Coffin for Sugar-Sweetened Beverages.Circulation. 2019 Apr 30;139(18):2126-2128. doi: 10.1161/CIRCULATIONAHA.119.040245. Circulation. 2019. PMID: 31034289 No abstract available.
-
Letter by Klevay Regarding Article, "Long-Term Consumption of Sugar-Sweetened and Artificially Sweetened Beverages and Risk of Mortality in US Adults".Circulation. 2019 Sep 17;140(12):e651. doi: 10.1161/CIRCULATIONAHA.119.041133. Epub 2019 Sep 16. Circulation. 2019. PMID: 31525099 No abstract available.
-
Eine Zuckersteuer wirkt — wollen wir sie?MMW Fortschr Med. 2019 Oct;161(18):36. doi: 10.1007/s15006-019-1002-x. MMW Fortschr Med. 2019. PMID: 31631307 German. No abstract available.
References
-
- NIH. National Cancer Institute: Division of Cancer control & Population Sceinces. Epidemiology and Genomics Research Program. Sources of Calories from Added Sugars among the US population, 2005–2006. Updated April 20, 2018. http://riskfactor.cancer.gov/diet/foodsources/added_sugars/. Accessed 10/02/13.
-
- Ogden CL, Kit BK, Carroll MD and Park S. Consumption of sugar drinks in the United States, 2005–2008. NCHS data brief. 2011:1–8. - PubMed
-
- Rosinger A, Herrick K, Gahche J and Park S. Sugar-sweetened Beverage Consumption Among U.S. Adults, 2011–2014. NCHS data brief. 2017:1–8. - PubMed
Publication types
MeSH terms
Substances
Grants and funding
LinkOut - more resources
Full Text Sources
