
Middle East Respiratory Syndrome Coronavirus Infection Dynamics and Antibody Responses among Clinically Diverse Patients, Saudi Arabia

Hail M Al-Abdely et al. Emerg Infect Dis. 2019 Apr.

Abstract

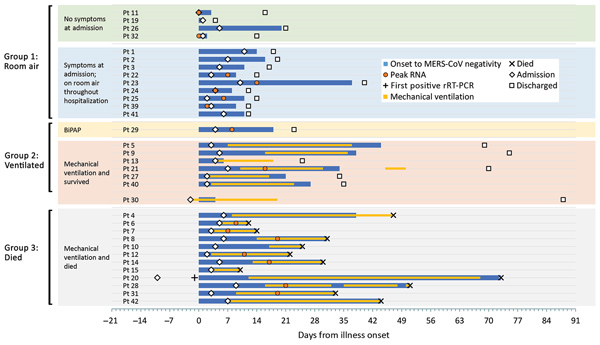
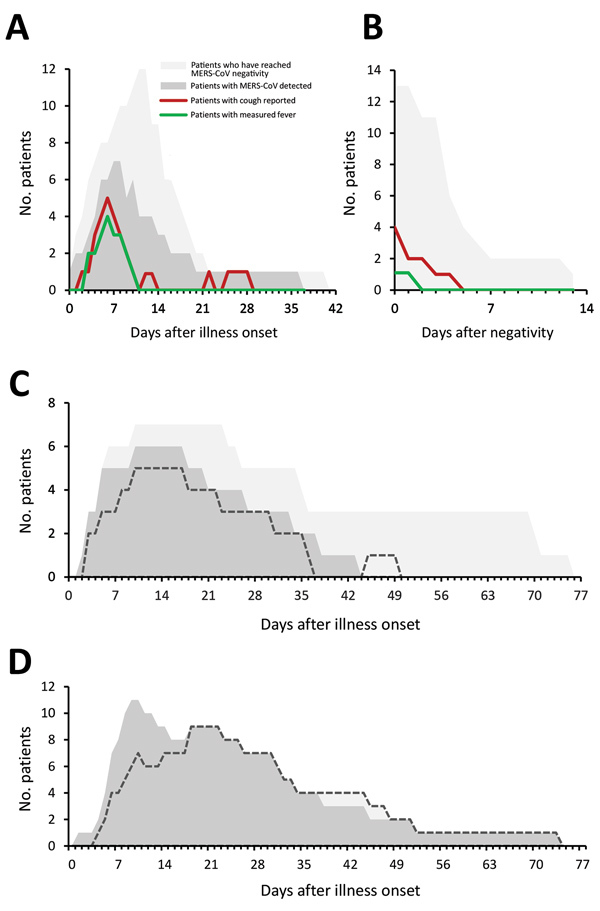
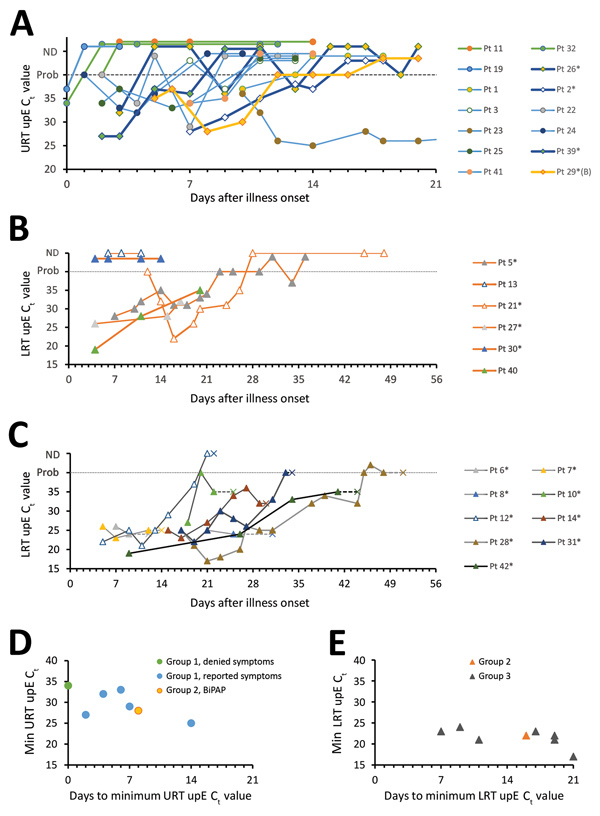
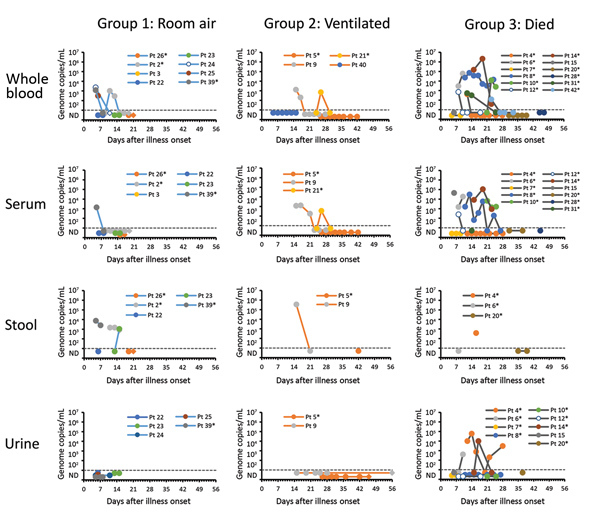
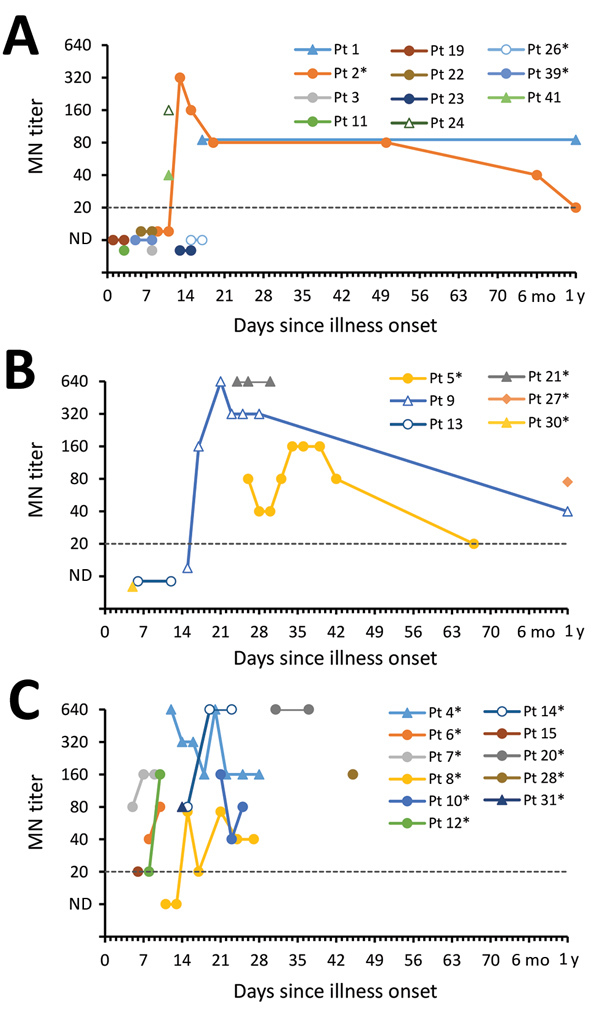
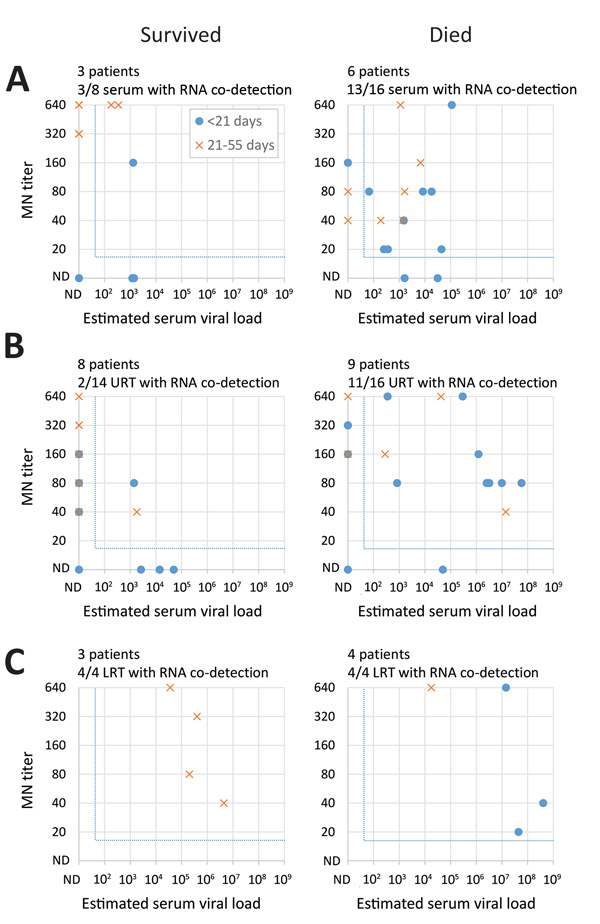
Middle East respiratory syndrome coronavirus (MERS-CoV) shedding and antibody responses are not fully understood, particularly in relation to underlying medical conditions, clinical manifestations, and mortality. We enrolled MERS-CoV-positive patients at a hospital in Saudi Arabia and periodically collected specimens from multiple sites for real-time reverse transcription PCR and serologic testing. We conducted interviews and chart abstractions to collect clinical, epidemiologic, and laboratory information. We found that diabetes mellitus among survivors was associated with prolonged MERS-CoV RNA detection in the respiratory tract. Among case-patients who died, development of robust neutralizing serum antibody responses during the second and third week of illness was not sufficient for patient recovery or virus clearance. Fever and cough among mildly ill patients typically aligned with RNA detection in the upper respiratory tract; RNA levels peaked during the first week of illness. These findings should be considered in the development of infection control policies, vaccines, and antibody therapeutics.

Keywords: MERS; MERS-CoV; Middle East respiratory syndrome; antibody response; asymptomatic infections; coronavirus infections; diabetes mellitus; kinetics; mortality; respiratory infections; viral load; viruses.


Figures

Figure 1
Figure 1
Timeline of clinical course and MERS-CoV detection, by patient, Saudi Arabia, August 1, 2015–August 31, 2016. Findings are presented by time since illness onset (day 0). Patients are grouped by illness severity and outcome. For each patient, day of admission, discharge or death, period of mechanical ventilation (if applicable), and MERS-CoV detection are depicted. For a subset of patients with sufficient data, the peak RNA level (or the minimum upstream of the envelope cycle threshold value) is depicted. Peak RNA was based on upper respiratory tract specimen results among group 1 patients and Pt 29, and lower respiratory tract specimen results in group 2 and group 3 patients. The date of death is shown for group 3 patients. Pt 11 and Pt 32 did not report any symptoms throughout their hospitalization. Pt 30 was hospitalized and mechanically ventilated before MERS onset because of a road traffic accident; this patient was excluded from severity and clinical course analyses. Pt 23 has been described previously (36). The first positive MERS-CoV rRT-PCR for Pt 20 was collected 1 day before symptom onset. BiPAP, bilevel positive airway pressure; CoV, coronavirus; MERS, Middle East respiratory syndrome; Pt, patient; rRT-PCR, real-time reverse transcription PCR.
Figure 2
Figure 2
Symptom progression and MERS-CoV detection during hospitalization at a MERS referral hospital, Saudi Arabia, August 1, 2015–August 31, 2016. Each panel depicts the number of patients hospitalized on a given day for each category shown; MERS-CoV detection is based on the clinical diagnostic reports in the upper or lower respiratory tract. A, B) Number of group 1 patients with fever (measured oral temperature >38.0°C or measured axillary temperature >37.5°C) and reported cough during (A) and after (B) the MERS-CoV detection period. C, D) Number of patients intubated (dashed lines) and the number of patients who were positive for MERS-CoV on a given day for group 2 (C) and group 3 (D). MERS, Middle East respiratory syndrome; MERS-CoV, Middle East respiratory syndrome coronavirus. Group 1, on room air; group 2, ventilated but survived; group 3, died.
Figure 3
Figure 3
MERS-CoV RNA detection in the respiratory tract, based on clinical diagnostic reports, among MERS-CoV patients, Saudi Arabia, August 1, 2015–August 31, 2016. A–C) UpE real-time reverse transcription PCR Ct values of group 1 (A), 2 (B), and 3 (C) patients, by days since illness onset (day 0). Panel A depicts URT specimens, and panels B and C depict LRT specimens collected during MV; Pt 29 (a G2 patient who received BiPAP ventilation) is depicted in panel A because only URT specimens were collected for this patient. The dashed line represents the limit of detection, above which specimens were considered MERS-CoV–negative or not detected. Probable results, meaning that only 1 of 2 real-time reverse transcription PCR assays were positive, are depicted on the dashed line for graphing purposes. Patients with limited Ct values or unknown specimen types are not depicted. Patients 11 and 32 did not report any symptoms throughout their illness. Pt 30 is depicted alongside G2 patients. Pt 23 reached negativity 37 days after illness onset, as described previously (36). *Indicates patients with a documented history of diabetes mellitus. D, E) Minimum Ct values reported, which was determined for a subset of patients with sufficient data. Panel D depicts URT specimen results among group 1 patients and Pt 29; panel E depicts LRT specimen results in group 2 and 3 patients, collected from the LRT during MV. Group 1, on room air; group 2, ventilated but survived; group 3, died. BiPAP, bilevel positive airway pressure; Ct, cycle threshold; CoV, coronavirus; LRT, lower respiratory tract; MERS, Middle East respiratory syndrome; min, minimum; MV, mechanical ventilation; Pt, patient; URT, upper respiratory tract; upE, upstream of the envelope.
Figure 4
Figure 4
Estimated viral loads in non–respiratory tract specimens collected from hospitalized MERS-CoV patients, Saudi Arabia, August 1, 2015–August 31, 2016, and submitted to the US Centers for Disease Control and Prevention. Specimen types are shown by severity group. Estimated viral loads are based on upstream of the envelope (upE) real-time reverse transcription PCR cycle threshold values, or N2 cycle threshold values if the upE real-time reverse transcription PCR was negative. The dashed line represents the limit of detection, below which specimens were considered MERS-CoV–negative or not detected. Round data points represent specimens collected during the MERS-CoV detection period (defined by clinical results from respiratory specimens). Diamond data points represent specimens collected after the MERS-CoV detection period (defined by clinical results from respiratory specimens); no specimens were positive for MERS-CoV after the detection period. *Patients with a documented history of diabetes mellitus. MERS-CoV, Middle East respiratory syndrome coronavirus; Pt, patient.
Figure 5
Figure 5
MN antibody titers of serum collected from MERS-CoV patients, by patient, severity group, and days since illness onset (day 0), Saudi Arabia, August 1, 2015–August 31, 2016. A) Group 1 patients; B) group 2 patients; C) group 3 patients. The dashed line represents the limit of detection, below which specimens were considered not to have detectable antibodies. Pt 11 did not report any symptoms throughout their illness. Pt 30 was hospitalized and mechanically ventilated before MERS onset because of a road traffic accident. *Patients with documented history of diabetes mellitus. MERS-CoV, Middle East respiratory syndrome coronavirus; MN, microneutralization assay; ND, antibodies not detected; Pt, patient.
Figure 6
Figure 6
Co-detection of neutralizing serum antibodies with RNA found in serum and the upper and lower respiratory tract among Middle East respiratory syndrome patients, by clinical outcome, Saudi Arabia, August 1, 2015–August 31, 2016. For each patient and specimen, MN titers of serum specimens were compared with estimated viral loads in the same serum specimen (A) or in URT (B) and LRT (C) specimens collected on the same day from the same patient. We defined RNA co-detection as the detection of both RNA and neutralizing antibodies (MN) in the same specimen or in respiratory specimens collected on the same day from a given patient. We only included specimens from patients who were known to develop neutralizing antibodies at any point during or after their illness. For the comparison in serum specimens, we only included specimens from patients who were known to have RNA detected in serum, at any point during their illness. For each panel, the number of patients included are indicated above the panel. The number of specimens with RNA co-detection (indicated by X) among those with detectable antibodies (indicated by Y) are also indicated by numbers (X/Y) above each panel. The blue dotted lines indicate the detection cut-offs for each assay. LRT, lower respiratory tract; ND, not detected; MN, microneutralization assay; URT, upper respiratory tract.

Similar articles

Cited by

References

    1. Assiri A, McGeer A, Perl TM, Price CS, Al Rabeeah AA, Cummings DA, et al.; KSA MERS-CoV Investigation Team. Hospital outbreak of Middle East respiratory syndrome coronavirus. N Engl J Med. 2013;369:407–16. 10.1056/NEJMoa1306742 - DOI - PMC - PubMed
    1. Oboho IK, Tomczyk SM, Al-Asmari AM, Banjar AA, Al-Mugti H, Aloraini MS, et al. 2014 MERS-CoV outbreak in Jeddah—a link to health care facilities. N Engl J Med. 2015;372:846–54. 10.1056/NEJMoa1408636 - DOI - PMC - PubMed
    1. Arabi YM, Al-Omari A, Mandourah Y, Al-Hameed F, Sindi AA, Alraddadi B, et al.; Saudi Critical Care Trial Group. Critically ill patients with the Middle East respiratory syndrome: a multicenter retrospective cohort study. Crit Care Med. 2017;45:1683–95. 10.1097/CCM.0000000000002621 - DOI - PubMed
    1. Arabi YM, Balkhy HH, Hayden FG, Bouchama A, Luke T, Baillie JK, et al. Middle East respiratory syndrome. N Engl J Med. 2017;376:584–94. 10.1056/NEJMsr1408795 - DOI - PMC - PubMed
    1. Ko JH, Park GE, Lee JY, Lee JY, Cho SY, Ha YE, et al. Predictive factors for pneumonia development and progression to respiratory failure in MERS-CoV infected patients. J Infect. 2016;73:468–75. 10.1016/j.jinf.2016.08.005 - DOI - PMC - PubMed

Publication types

MeSH terms

LinkOut - more resources