

Factors Affecting Bimodal Benefit in Pediatric Mandarin-Speaking Chinese Cochlear Implant Users
- PMID: 30882534
- PMCID: PMC6745007
- DOI: 10.1097/AUD.0000000000000712
Factors Affecting Bimodal Benefit in Pediatric Mandarin-Speaking Chinese Cochlear Implant Users
Abstract
Objectives: While fundamental frequency (F0) cues are important to both lexical tone perception and multitalker segregation, F0 cues are poorly perceived by cochlear implant (CI) users. Adding low-frequency acoustic hearing via a hearing aid in the contralateral ear may improve CI users' F0 perception. For English-speaking CI users, contralateral acoustic hearing has been shown to improve perception of target speech in noise and in competing talkers. For tonal languages such as Mandarin Chinese, F0 information is lexically meaningful. Given competing F0 information from multiple talkers and lexical tones, contralateral acoustic hearing may be especially beneficial for Mandarin-speaking CI users' perception of competing speech.
Design: Bimodal benefit (CI+hearing aid - CI-only) was evaluated in 11 pediatric Mandarin-speaking Chinese CI users. In experiment 1, speech recognition thresholds (SRTs) were adaptively measured using a modified coordinated response measure test; subjects were required to correctly identify 2 keywords from among 10 choices in each category. SRTs were measured with CI-only or bimodal listening in the presence of steady state noise (SSN) or competing speech with the same (M+M) or different voice gender (M+F). Unaided thresholds in the non-CI ear and demographic factors were compared with speech performance. In experiment 2, SRTs were adaptively measured in SSN for recognition of 5 keywords, a more difficult listening task than the 2-keyword recognition task in experiment 1.
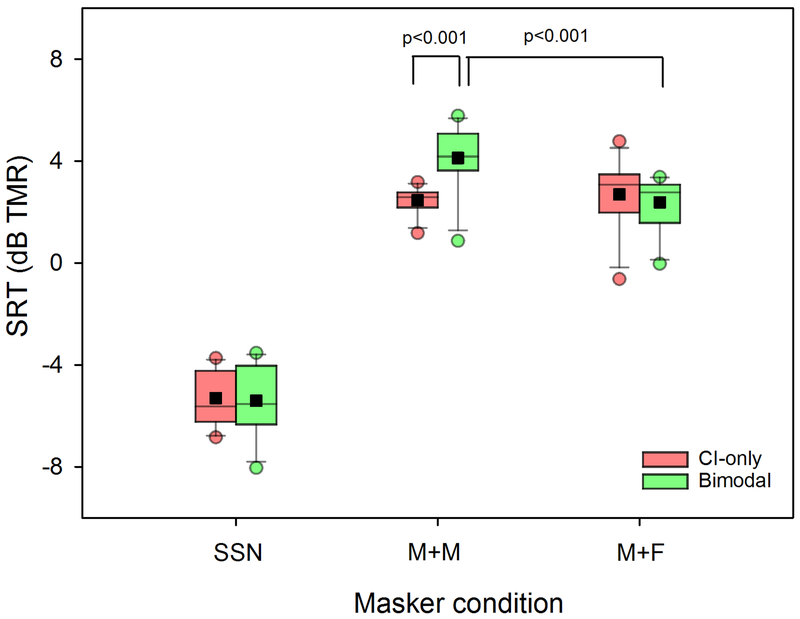
Results: In experiment 1, SRTs were significantly lower for SSN than for competing speech in both the CI-only and bimodal listening conditions. There was no significant difference between CI-only and bimodal listening for SSN and M+F (p > 0.05); SRTs were significantly lower for CI-only than for bimodal listening for M+M (p < 0.05), suggesting bimodal interference. Subjects were able to make use of voice gender differences for bimodal listening (p < 0.05) but not for CI-only listening (p > 0.05). Unaided thresholds in the non-CI ear were positively correlated with bimodal SRTs for M+M (p < 0.006) but not for SSN or M+F. No significant correlations were observed between any demographic variables and SRTs (p > 0.05 in all cases). In experiment 2, SRTs were significantly lower with two than with five keywords (p < 0.05). A significant bimodal benefit was observed only for the 5-keyword condition (p < 0.05).
Conclusions: With the CI alone, subjects experienced greater interference with competing speech than with SSN and were unable to use voice gender difference to segregate talkers. For the coordinated response measure task, subjects experienced no bimodal benefit and even bimodal interference when competing talkers were the same voice gender. A bimodal benefit in SSN was observed for the five-keyword condition but not for the two-keyword condition, suggesting that bimodal listening may be more beneficial as the difficulty of the listening task increased. The present data suggest that bimodal benefit may depend on the type of masker and/or the difficulty of the listening task.
Figures


Similar articles
-
Mandarin Tone and Vowel Recognition in Cochlear Implant Users: Effects of Talker Variability and Bimodal Hearing.Ear Hear. 2016 May-Jun;37(3):271-81. doi: 10.1097/AUD.0000000000000265. Ear Hear. 2016. PMID: 26752089 Free PMC article.
-
Comparison of bimodal and bilateral cochlear implant users on speech recognition with competing talker, music perception, affective prosody discrimination, and talker identification.Ear Hear. 2011 Feb;32(1):16-30. doi: 10.1097/AUD.0b013e3181edfbd2. Ear Hear. 2011. PMID: 21178567 Free PMC article.
-
Fundamental frequency information for speech recognition via bimodal stimulation: cochlear implant in one ear and hearing aid in the other.Ear Hear. 2014 Jan-Feb;35(1):97-109. doi: 10.1097/AUD.0b013e3182a2c814. Ear Hear. 2014. PMID: 24141594
-
Meta-analysis on lexical tone recognition in cochlear implant users.Int J Audiol. 2025 Jun;64(6):557-569. doi: 10.1080/14992027.2025.2456003. Epub 2025 Jan 31. Int J Audiol. 2025. PMID: 39891342
-
A Review of Speech Perception of Mandarin-Speaking Children With Cochlear Implantation.Front Neurosci. 2021 Dec 14;15:773694. doi: 10.3389/fnins.2021.773694. eCollection 2021. Front Neurosci. 2021. PMID: 34970113 Free PMC article. Review.
Cited by
-
Bone-conduction hyperacusis induced by superior canal dehiscence in human: the underlying mechanism.Sci Rep. 2020 Oct 6;10(1):16564. doi: 10.1038/s41598-020-73565-4. Sci Rep. 2020. PMID: 33024221 Free PMC article.
-
Processing of Acoustic Information in Lexical Tone Production and Perception by Pediatric Cochlear Implant Recipients.Front Neurosci. 2019 Jun 20;13:639. doi: 10.3389/fnins.2019.00639. eCollection 2019. Front Neurosci. 2019. PMID: 31281237 Free PMC article.
-
Guidelines for Best Practice in the Audiological Management of Adults Using Bimodal Hearing Configurations.Otol Neurotol Open. 2022 Jun;2(2):e011. doi: 10.1097/ONO.0000000000000011. Epub 2022 Jun 24. Otol Neurotol Open. 2022. PMID: 36274668 Free PMC article.
-
Interactions among talker sex, masker number, and masker intelligibility in speech-on-speech recognition.JASA Express Lett. 2021 Jan;1(1):015203. doi: 10.1121/10.0003051. JASA Express Lett. 2021. PMID: 33589889 Free PMC article.
-
Masking Effects in the Perception of Multiple Simultaneous Talkers in Normal-Hearing and Cochlear Implant Listeners.Trends Hear. 2020 Jan-Dec;24:2331216520916106. doi: 10.1177/2331216520916106. Trends Hear. 2020. PMID: 32324486 Free PMC article.
References
-
- Bolia RS, Nelson WT, Ericson MA, et al. (2000). A speech corpus for multitalker communications research. J Acoust Soc Am. 107, 1065–1066. - PubMed
-
- Blamey PJ, Maat B, Başkent D, et al. (2015). A retrospective multicenter study comparing speech perception outcomes for bilateral implantation and bimodal rehabilitation. Ear Hear. 36, 408–416. - PubMed
-
- Brungart D (2001a). Evaluation of speech intelligibility with the coordinate response measure. J Acoust Soc Am. 109, 2276–2279. - PubMed
-
- Brungart D (2001b). Informational and energetic masking effects in the perception of two simultaneous talkers. J Acoust Soc Am. 109, 1101–1109. - PubMed
Publication types
MeSH terms
Grants and funding
LinkOut - more resources
Full Text Sources
Medical
