. 2019 Jul;31(7):1054-1064.
doi: 10.1162/jocn_a_01387. Epub 2019 Mar 18.

A Comparison of Auditory Oddball Responses in Dorsolateral Prefrontal Cortex, Basolateral Amygdala, and Auditory Cortex of Macaque

Affiliations

A Comparison of Auditory Oddball Responses in Dorsolateral Prefrontal Cortex, Basolateral Amygdala, and Auditory Cortex of Macaque

Corrie R Camalier et al. J Cogn Neurosci. 2019 Jul.

Abstract

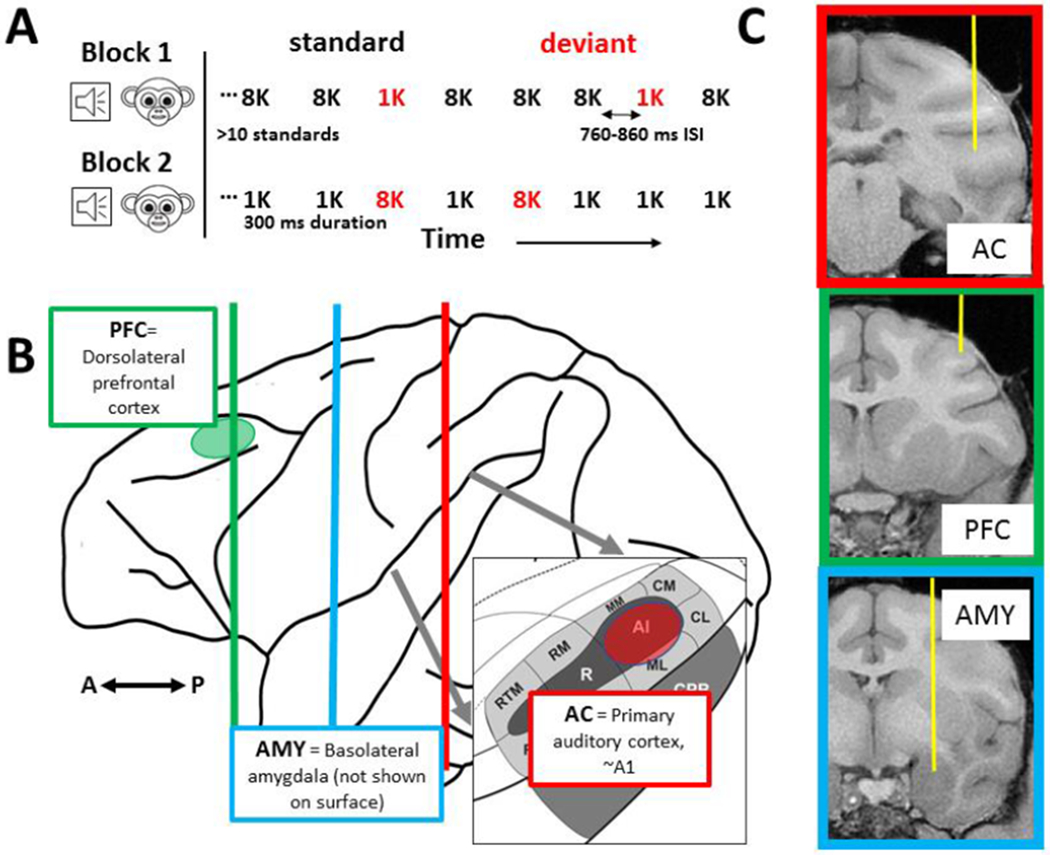
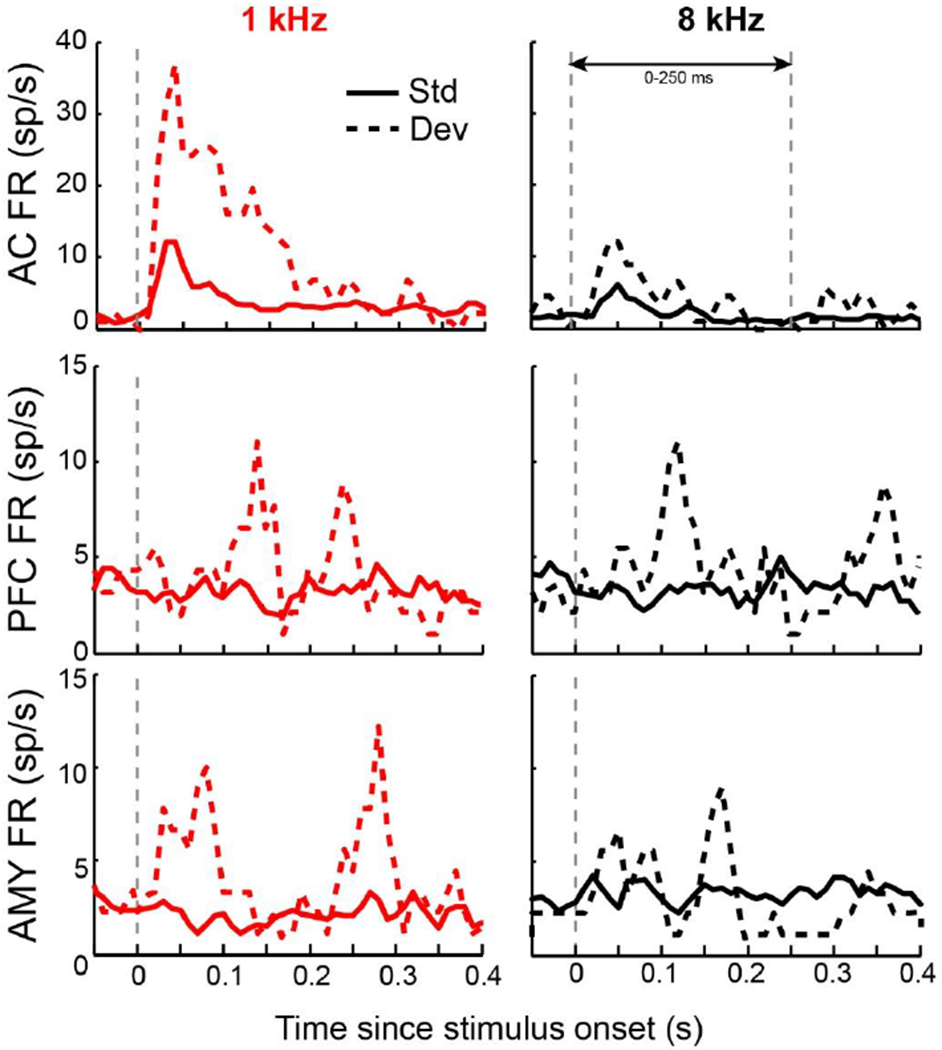
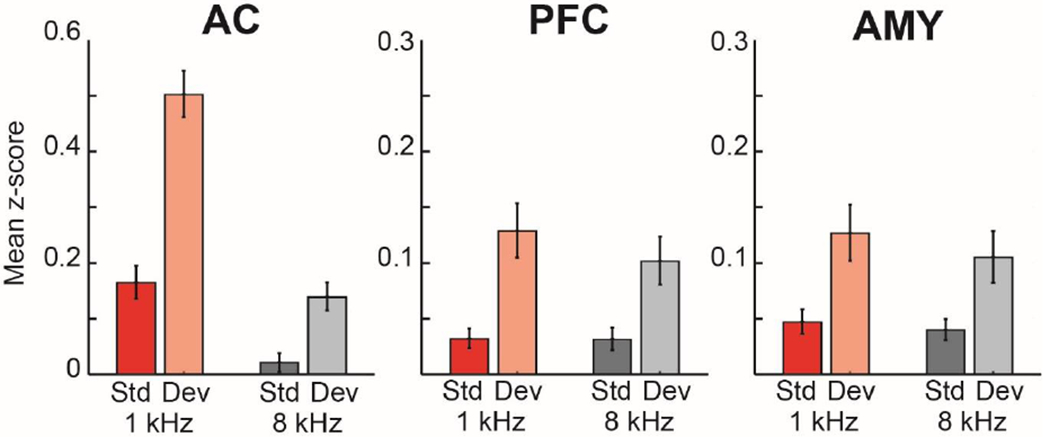
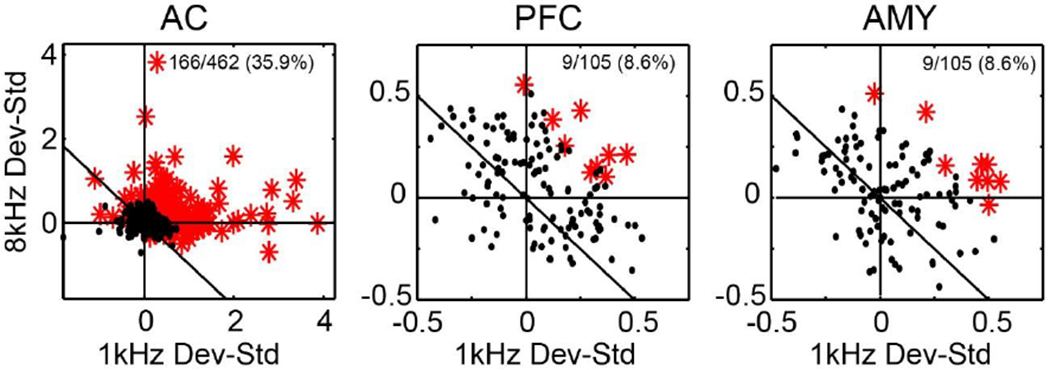
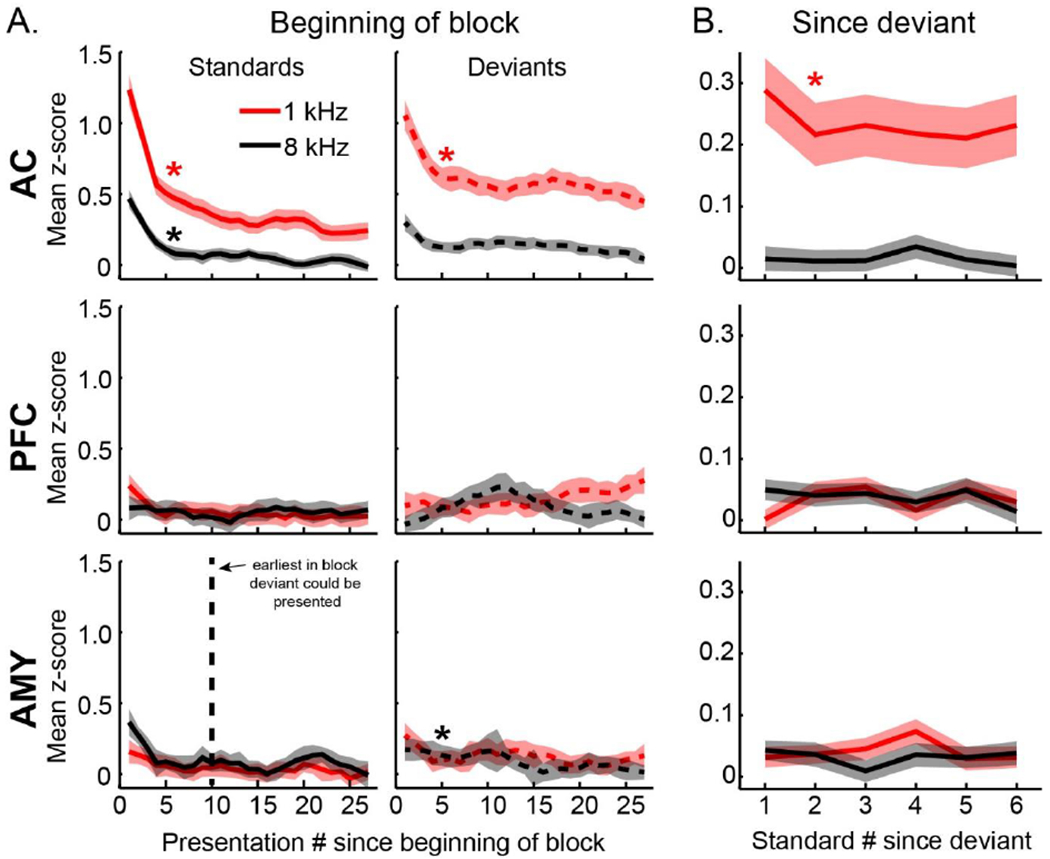
The mismatch negativity (MMN) is an ERP component seen in response to unexpected "novel" stimuli, such as in an auditory oddball task. The MMN is of wide interest and application, but the neural responses that generate it are poorly understood. This is in part due to differences in design and focus between animal and human oddball paradigms. For example, one of the main explanatory models, the "predictive error hypothesis", posits differences in timing and selectivity between signals carried in auditory and prefrontal cortex (PFC). However, these predictions have not been fully tested because (1) noninvasive techniques used in humans lack the combined spatial and temporal precision necessary for these comparisons and (2) single-neuron studies in animal models, which combine necessary spatial and temporal precision, have not focused on higher order contributions to novelty signals. In addition, accounts of the MMN traditionally do not address contributions from subcortical areas known to be involved in novelty detection, such as the amygdala. To better constrain hypotheses and to address methodological gaps between human and animal studies, we recorded single neuron activity from the auditory cortex, dorsolateral PFC, and basolateral amygdala of two macaque monkeys during an auditory oddball paradigm modeled after that used in humans. Consistent with predictions of the predictive error hypothesis, novelty signals in PFC were generally later than in auditory cortex and were abstracted from stimulus-specific effects seen in auditory cortex. However, we found signals in amygdala that were comparable in magnitude and timing to those in PFC, and both prefrontal and amygdala signals were generally much weaker than those in auditory cortex. These observations place useful quantitative constraints on putative generators of the auditory oddball-based MMN and additionally indicate that there are subcortical areas, such as the amygdala, that may be involved in novelty detection in an auditory oddball paradigm.


Conflict of interest statement

Conflict of interest: None.

Figures

Figure 1.
Figure 1.. Task design, recording locations and trajectory.
A. Details of the “flip-flop” oddball task. The 1 kHz and 8 kHz stimuli were consistently used for all areas. B. Schematic of macaque brain with locations of recording areas shown on surface (where possible) in red (AC) and green (dlPFC). Vertical lines indicate sagittal slices shown in panel C. C. Exemplar recording trajectory for each area reconstructed from T1-weighted scan – all areas were recorded with multichannel laminar probes oriented vertically which allowed for a comparison of ~600 neurons per area.
Figure 2.
Figure 2.. Example neuron responses.
Peristimulus time histograms of average firing rate (FR) of an example single neuron response from each area (auditory cortex: AC, dorsolateral prefrontal cortex: PFC and lateral amygdala: AMY) to each stimulus and type combination. Each neuron shown is novelty selective. Note that in the prefrontal cortex and amygdala baseline firing rates and evoked activity are generally lower than in auditory cortex. PSTHs are smoothed for visualization purposes only.
Figure 3.
Figure 3.. Population oddball response by area, collapsed by stimulus.
Measure shown is average response to both deviants -average response to both standards calculated for each responsive neuron in each area (AC n=462, PFC n=105, AMY n=105). Note that the overall deviance response is approximately twice as large in AC than in PFC and AMY. Error bars are SEM across cells.
Figure 4.
Figure 4.. Population response by stimulus across areas.
Average response magnitude for each stimulus, type (standard vs deviant), and area. Consistent with the exemplar responses in Fig. 2, responses are on average larger in AC than PFC and AMY. Error bars are SEM across cells.
Figure 5.
Figure 5.. Population novelty signal across areas.
Average novelty signal, computed as a neuron’s response to a stimulus as a standard subtracted from its response as a deviant (DEV-STD). Average magnitude of novelty signal is shown separately for each stimulus and area, error bars are SEM. All areas show a population-based novelty signal, but only auditory cortex shows a signal whose magnitude is affected by driving stimulus (sig difference denoted as a star).
Figure 6.
Figure 6.. Individual neuron-based magnitude of novelty signal (response as deviant – response as standard) and novelty selectivity for each stimulus and area.
Single neurons which exhibited a significant novelty signal are shown in red. This fraction is lower in PFC and AMY but greater than chance, and magnitude in these areas is lower than in AC (see text). Note that at level of individual neurons, generally responses in AC are skewed towards stronger novelty responses for 1 kHz, and there is less stimulus selectivity in PFC and AMY.
Figure 7.
Figure 7.. Latency of deviance signal across areas.
A-C. Average PSTHs of DEV-STD differences for each area (shaded bars are SEM). Earliest 30 ms bin in which differences were significant denoted as vertical dotted line. Plots are smoothed for visualization purposes only. D. Cumulative distribution function of latencies of individual neuron sensitivity to stimulus type for each area. Mean of each area denoted as vertical dotted line.
Figure 8.
Figure 8.. Adaptation effects across areas.
A. Adaptation since block start. Average response to a standard (solid) and deviant (dotted) plotted by ordinal presentation number since beginning of block for each area, stimulus, and type (shaded bars are SEM). Significant adaptation is denoted with a star. Vertical dotted line indicates the earliest that a deviant could be presented within a block (all blocks started with >10 standards). B. Adaptation since deviant. Average response to standard after presentation of a deviant for each area and stimulus (shaded bars are SEM). Plots are smoothed for visualization purposes only.

References

    1. Alain C, Woods DL, & Knight RT (1998). A distributed cortical network for auditory sensory memory in humans. Brain Research, 812(1-2), 23–37. - PubMed
    1. Alho K, Woods DL, Algazi A, Knight RT, & Naatanen R (1994). Lesions of frontal cortex diminish the auditory mismatch negativity. Electroencephalography and Clinical Neurophysiology, 91(5), 353–362. - PubMed
    1. Antunes FM, Nelken I, Covey E, & Malmierca MS (2010). Stimulus-specific adaptation in the auditory thalamus of the anesthetized rat. PloS One, 5(11), e14071. doi:10.1371/journal.pone.0014071 - DOI - PMC - PubMed
    1. Ayala YA, Perez-Gonzalez D, Duque D, Nelken I, & Malmierca MS (2012). Frequency discrimination and stimulus deviance in the inferior colliculus and cochlear nucleus. Front Neural Circuits, 6, 119. doi:10.3389/fncir.2012.00119 - DOI - PMC - PubMed
    1. Balderston NL, Schultz DH, & Helmstetter FJ (2013). The effect of threat on novelty evoked amygdala responses. PloS One, 8(5), e63220. doi:10.1371/journal.pone.0063220 - DOI - PMC - PubMed

Publication types