

Biodiversity data integration-the significance of data resolution and domain
- PMID: 30883539
- PMCID: PMC6445469
- DOI: 10.1371/journal.pbio.3000183
Biodiversity data integration-the significance of data resolution and domain
Abstract
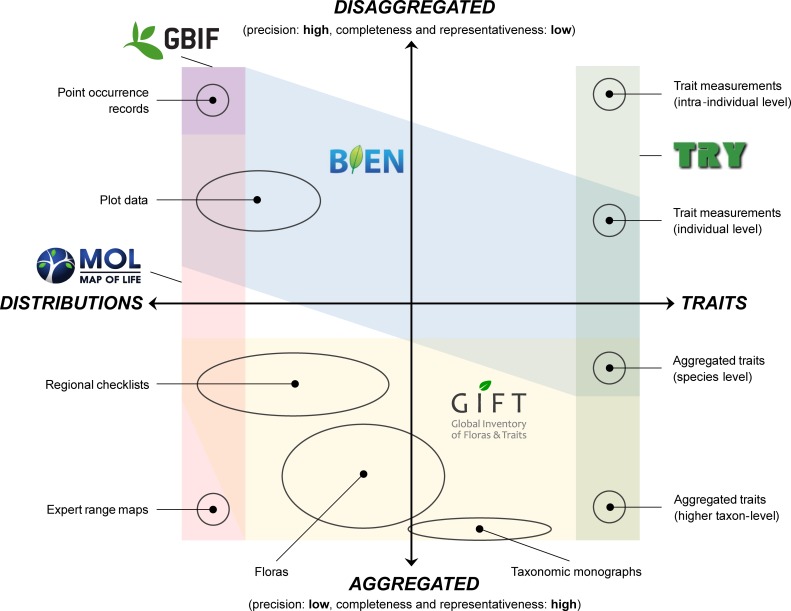
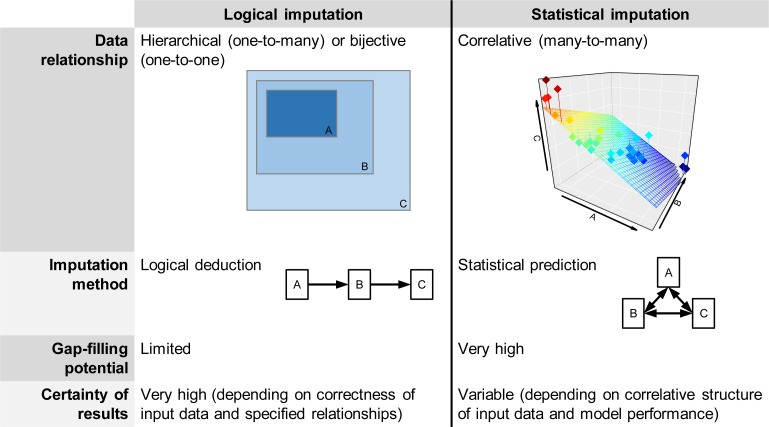
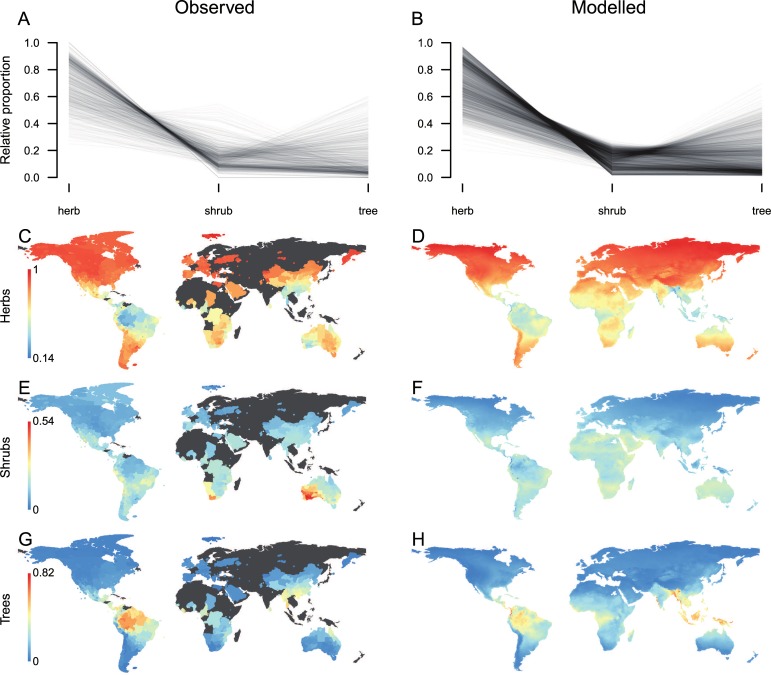
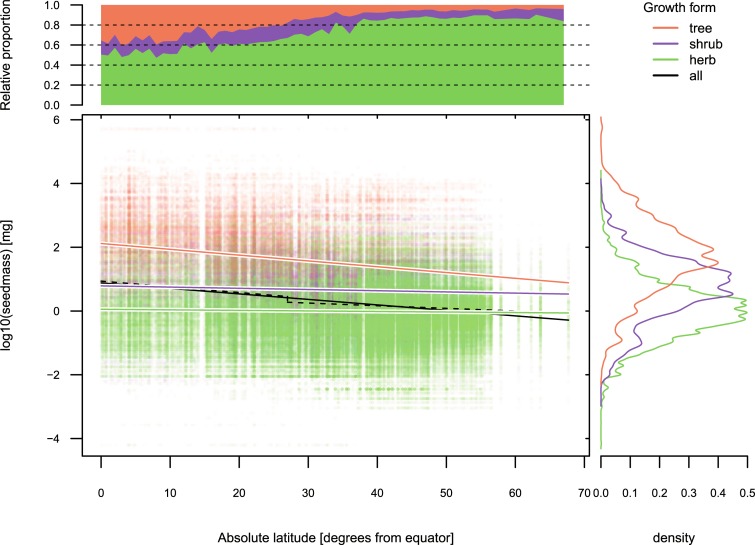
Recent years have seen an explosion in the availability of biodiversity data describing the distribution, function, and evolutionary history of life on earth. Integrating these heterogeneous data remains a challenge due to large variations in observational scales, collection purposes, and terminologies. Here, we conceptualize widely used biodiversity data types according to their domain (what aspect of biodiversity is described?) and informational resolution (how specific is the description?). Applying this framework to major data providers in biodiversity research reveals a strong focus on the disaggregated end of the data spectrum, whereas aggregated data types remain largely underutilized. We discuss the implications of this imbalance for the scope and representativeness of current macroecological research and highlight the synergies arising from a tighter integration of biodiversity data across domains and resolutions. We lay out effective strategies for data collection, mobilization, imputation, and sharing and summarize existing frameworks for scalable and integrative biodiversity research. Finally, we use two case studies to demonstrate how the explicit consideration of data domain and resolution helps to identify biases and gaps in global data sets and achieve unprecedented taxonomic and geographical data coverage in macroecological analyses.
Conflict of interest statement
The authors have declared that no competing interests exist.
Figures
References
-
- Watson JEM, Jones KR, Fuller RA, Di Marco M, Segan DB, Butchart SHM, et al. Persistent Disparities between Recent Rates of Habitat Conversion and Protection and Implications for Future Global Conservation Targets. Conservation Letters. 2016; 9: 413–421. 10.1111/conl.12295 - DOI
-
- Pachauri RK, Allen MR, Barros VR, Broome J, Cramer W, Christ R, et al. Climate change 2014. Synthesis report. Contribution of Working Groups I, II and III to the fifth assessment report of the Intergovernmental Panel on Climate Change: IPCC; 2014.
-
- Kelling S, Hochachka WM, Fink D, Riedewald M, Caruana R, Ballard G, et al. Data-intensive Science. A New Paradigm for Biodiversity Studies. BioScience. 2009; 59: 613–620. 10.1525/bio.2009.59.7.12 - DOI
-
- Hampton SE, Strasser CA, Tewksbury JJ, Gram WK, Budden AE, Batcheller AL, et al. Big data and the future of ecology. Frontiers in Ecology and the Environment. 2013; 11: 156–162. 10.1890/120103 - DOI
MeSH terms
LinkOut - more resources
Full Text Sources
