. 2019 Mar 18;17(3):e3000197.
doi: 10.1371/journal.pbio.3000197. eCollection 2019 Mar.

Evidence that alternative transcriptional initiation is largely nonadaptive

Affiliations

Evidence that alternative transcriptional initiation is largely nonadaptive

Chuan Xu et al. PLoS Biol. .

Abstract

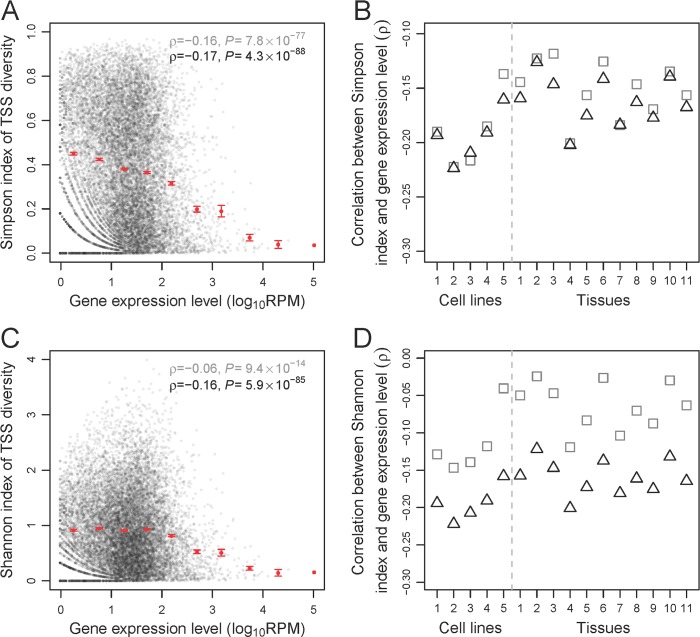
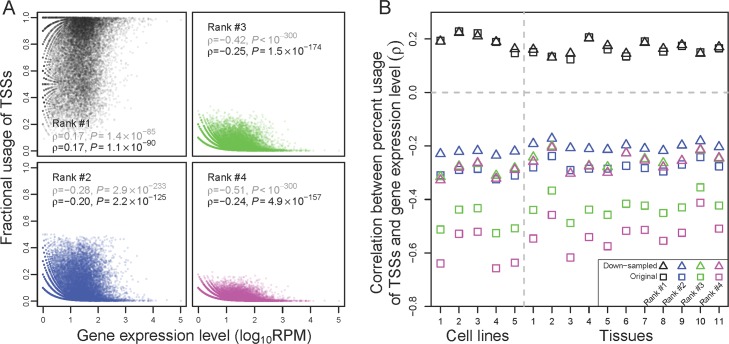
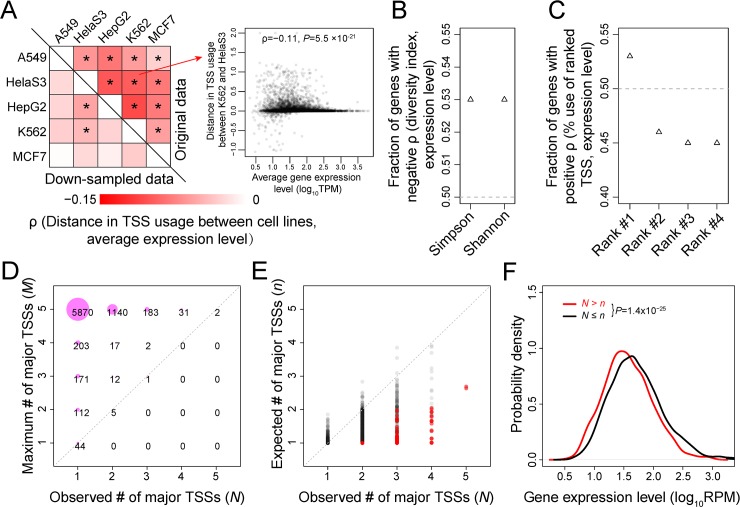
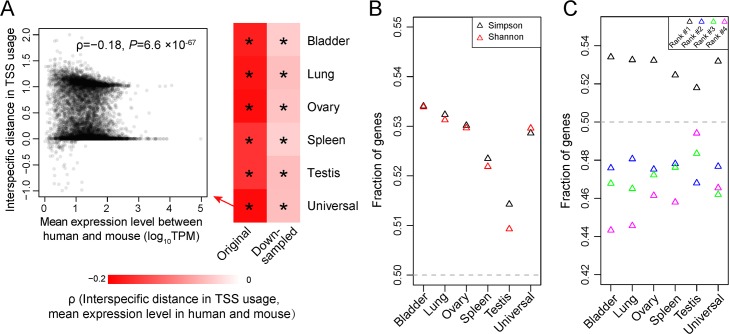
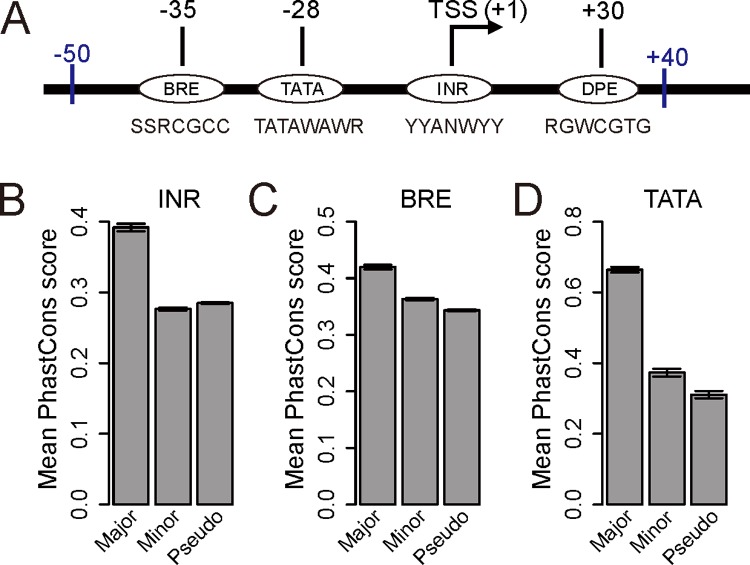
Alternative transcriptional initiation (ATI) refers to the frequent observation that one gene has multiple transcription start sites (TSSs). Although this phenomenon is thought to be adaptive, the specific advantage is rarely known. Here, we propose that each gene has one optimal TSS and that ATI arises primarily from imprecise transcriptional initiation that could be deleterious. This error hypothesis predicts that (i) the TSS diversity of a gene reduces with its expression level; (ii) the fractional use of the major TSS increases, but that of each minor TSS decreases, with the gene expression level; and (iii) cis-elements for major TSSs are selectively constrained, while those for minor TSSs are not. By contrast, the adaptive hypothesis does not make these predictions a priori. Our analysis of human and mouse transcriptomes confirms each of the three predictions. These and other findings strongly suggest that ATI predominantly results from molecular errors, requiring a major revision of our understanding of the precision and regulation of transcription.


Conflict of interest statement

The authors have declared that no competing interests exist.

Figures

Fig 1
Fig 1. The TSS diversity of a gene generally decreases with the gene expression level.
(A) The Simpson index of TSS diversity of a gene in the human universal sample declines with the expression level of the gene in the sample. (B) Spearman's correlations between gene expression level and Simpson index of TSS diversity in each of five human cell lines and 11 human tissue samples examined. (C) The Shannon index of TSS diversity of a gene in the human universal sample declines with the expression level of the gene in the sample. (D) Spearman's correlations between gene expression level and Shannon index of TSS diversity in each human cell line and tissue sample examined. In (A) and (C), each black dot represents a gene. Spearman's rank correlation coefficient (ρ) and associated P-value are presented for the original unbinned data (gray) and down-sampled data (black), respectively. Each red dot shows the mean X-value and mean Y-value of the genes in each of 10 equal-interval bins (i.e., all bins have the same log10RPM interval), while the error bars show standard errors (error bar is absent when a bin contains only one gene). In (B) and (D), gray squares and black triangles show the correlations on the basis of the original unbinned data and down-sampled data, respectively. P < 5 × 10⁻³ for all correlations. Sample IDs listed on the x-axis refer to those in S1 Table. Data are available at https://github.com/ZhixuanXu/Nonadaptive-alternative-TSSs. ID, identifier; RPM, reads mapped to the gene per million reads; TSS, transcription start site.
Fig 2
Fig 2. Increased fractional use of the most frequently used TSS of a gene and decreased fractional use of each other TSS when gene expression level rises.
(A) Spearman's correlation (ρ) between the expression level of a gene and the fractional uses of its TSSs in the human universal sample. TSSs are ranked on the basis of their fractional uses in the sample concerned, with rank #1 being the most frequently used one (major TSS). Each dot represents a gene. Gray and black ρ and P are based on the original and down-sampled data, respectively. (B) Spearman's rank correlation between the expression level of a gene and the fractional uses of its TSSs in each human cell line or tissue sample examined. P < 10−39 in all cases. Squares and triangles show the correlations on the basis of the original and down-sampled data, respectively. In both panels, the correlation for TSSs with a particular rank is calculated using the genes that have at least that particular number of TSSs. Sample IDs listed on the x-axis of (B) refer to those in S1 Table. Data are available at https://github.com/ZhixuanXu/Nonadaptive-alternative-TSSs. ID, identifier; RPM, reads mapped to the gene per million reads; TSS, transcription start site.
Fig 3
Fig 3. Variation in TSS usage among five human cell lines.
(A) Spearman's correlations between the mean expression level of a gene in two cell lines and the between-cell–line distance in TSS usage. Above and below the diagonal are results obtained from the original and down-sampled data, respectively. All correlations are negative; those significant at P = 0.05 are indicated by an asterisk. The scatter plot for the comparison between K562 and HeLa S3 is presented as an example. (B) Fraction of genes with a negative among-cell–line Spearman's correlation between the Simpson or Shannon index of TSS diversity and expression level. (C) Fraction of genes with a positive among-cell–line Spearman's correlation between the gene expression level and fractional use of a ranked TSS. In (B) and (C), results are based on down-sampled data and P < 10−4 in all cases (binomial test). (D) The maximum number (M) of different major TSSs that a gene can have (given its observed TSSs) in the five human cell lines is greater than the observed number (N) of different major sites for almost all genes with M ≥ 2. The area of a circle is proportional to the indicated number of genes in the circle. (E) Only in a minority of human genes is the number (N) of observed major TSSs significantly greater than that (n) expected under no differential use of TSSs among five human cell lines. Each dot represents a gene, with red dots denote genes whose N exceeds n significantly (Q < 0.05). No gene has a significantly lower N than n (Q < 0.05). (F) The probability densities of expression level for genes with larger N than n (not necessarily significantly; red) and the rest of the genes (black). In this panel, N and n have been re-estimated using down-sampled data to equalize the sampling error among genes. Data are available at https://github.com/ZhixuanXu/Nonadaptive-alternative-TSSs. HepG2, human liver cancer cell line Hep G2; MCF7, human breast cancer cell line MCF-7; RPM, reads mapped to the gene per million reads; TSS, transcription start site.
Fig 4
Fig 4. TSS usages of human–mouse orthologous genes in each of six tissue samples.
(A) Spearman's correlations between the mean expression level of a gene in the two species and its interspecific distance in TSS usage. All correlations are negative; those significant at P = 0.05 are indicated by an asterisk. The scatter plot of the human–mouse comparison of the universal sample is presented as an example. (B) The fraction of genes for which the Simpson or Shannon index of TSS diversity is lower in the species where the gene expression level is higher. All fractions significantly exceed the random expectation of 50% (P < 0.05) except for those in the testis. (C) Fraction of genes for which the percent usage of the TSS of a particular rank is higher in the species where the gene expression level is higher. All fractions deviate significantly from the random expectation of 50% (P < 0.05). In (B) and (C), down-sampled data are used. Data are available at https://github.com/ZhixuanXu/Nonadaptive-alternative-TSSs. TPM, transcripts per million; TSS, transcription start site.
Fig 5
Fig 5. Evolutionary conservations of cis-elements of human core promoters.
(A) The typical structure of a core promoter and consensus sequences of cis-elements. The most likely positions in nts relative to the TSS (+1) are given for core promoter cis-elements. (B–D) Mean PhastCons scores of cis-elements of global major TSSs, cis-elements of global minor TSSs, and pseudoelements for INR (B), BRE (C), and TATA (D). In (B)–(D), the mean PhastCons score is significantly different (P < 0.05, Mann–Whitney U test) between any pair of the three bins. Error bars show the standard error. Degenerate nucleotide symbols used are as follows. N: A, G, C, or T; H: A, T, or C; W: A or T; R: A or G; Y: C or T; M: A or C; K: G or T; S: G or C. Data are available at https://github.com/ZhixuanXu/Nonadaptive-alternative-TSSs. BRE, TFIIB recognition element; DPE, downstream promoter element; INR, initiator; nt, nucleotide; TATA, TATA box; TSS, transcription start site.

References

    1. Sandelin A, Carninci P, Lenhard B, Ponjavic J, Hayashizaki Y, Hume DA. Mammalian RNA polymerase II core promoters: insights from genome-wide studies. Nat Rev Genet. 2007;8(6):424–36. 10.1038/nrg2026 - DOI - PubMed
    1. Smale ST, Kadonaga JT. The RNA polymerase II core promoter. Annu Rev Biochem. 2003;72:449–79. 10.1146/annurev.biochem.72.121801.161520 - DOI - PubMed
    1. Juven-Gershon T, Hsu JY, Kadonaga JT. Perspectives on the RNA polymerase II core promoter. Biochem Soc Trans. 2006;34(Pt 6):1047–50. 10.1042/BST0341047 - DOI - PubMed
    1. Juven-Gershon T, Hsu JY, Theisen JW, Kadonaga JT. The RNA polymerase II core promoter—the gateway to transcription. Curr Opin Cell Biol. 2008;20(3):253–9. 10.1016/j.ceb.2008.03.003 - DOI - PMC - PubMed
    1. Juven-Gershon T, Kadonaga JT. Regulation of gene expression via the core promoter and the basal transcriptional machinery. Dev Biol. 2010;339(2):225–9. 10.1016/j.ydbio.2009.08.009 - DOI - PMC - PubMed

Publication types