. 2019 May;52(3):e12567.
doi: 10.1111/cpr.12567. Epub 2019 Mar 18.

miR-664a-3p functions as an oncogene by targeting Hippo pathway in the development of gastric cancer

Affiliations

miR-664a-3p functions as an oncogene by targeting Hippo pathway in the development of gastric cancer

Lu Wang et al. Cell Prolif. 2019 May.

Retraction in

Abstract

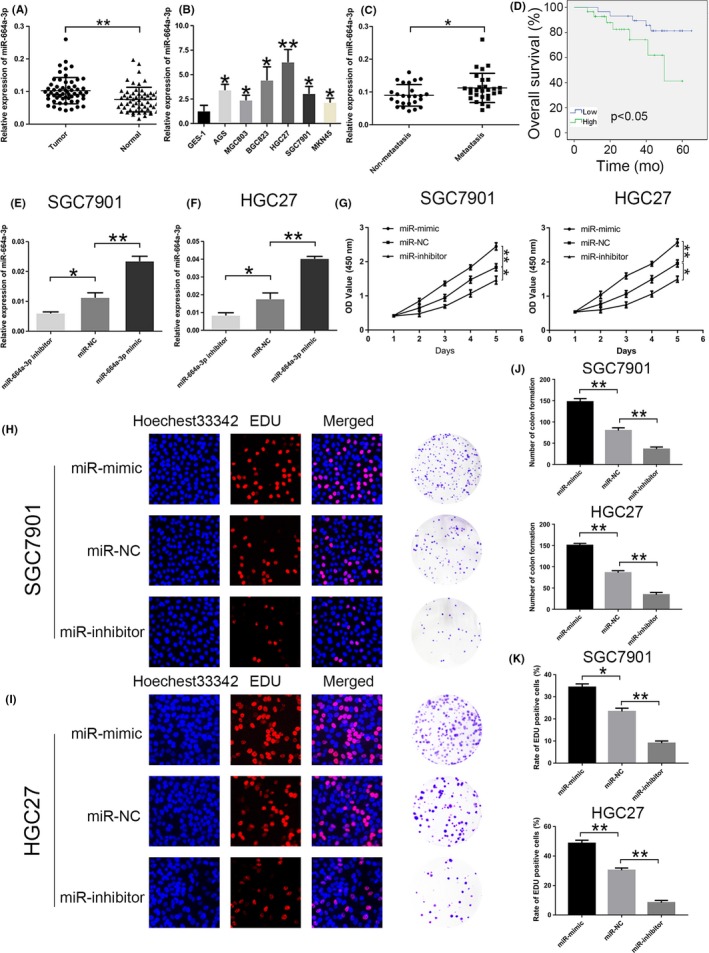
Objectives: It has been accounted that miR-664a-3p has different functions in several malignancies; however, the precise role and underlying mechanism in gastric cancer have not been elucidated. Our study aims to explore the function of miR-664a-3p on the progression of gastric cancer (GC).

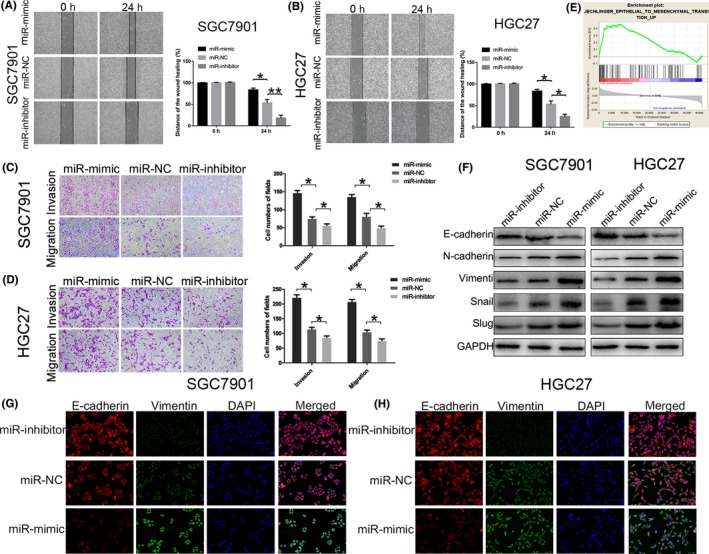
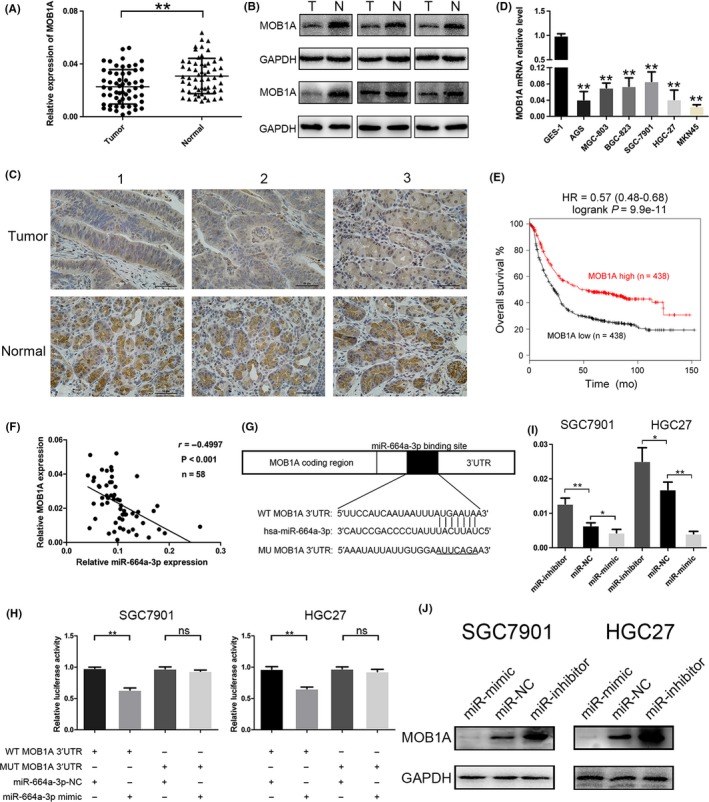
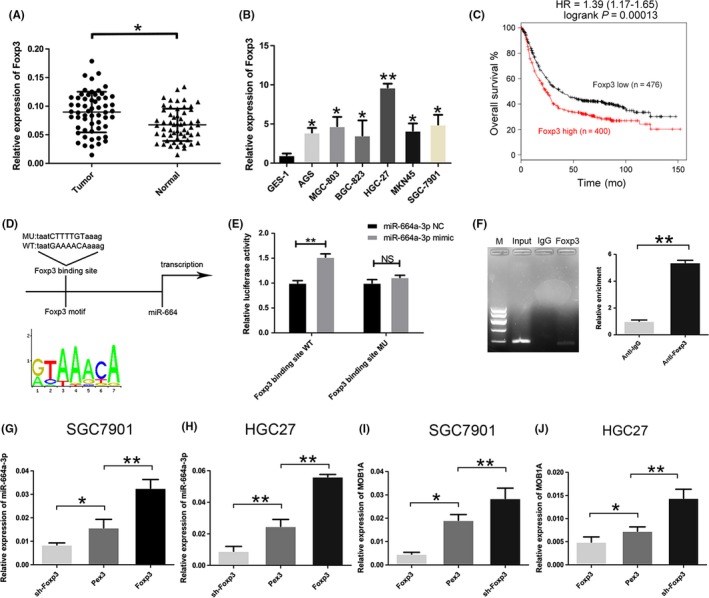
Methods: qRT-PCR was applied to detect the expression of miR-664a-3p in GC tissues and cells. The functions of miR-664a-3p on GC in vitro were examined by cell proliferation assay, and transwell assay. Related proteins of epithelial-mesenchymal transition (EMT) and signal pathway were evaluated by Western blot and immunofluorescence analysis. The bioinformatic, dual-luciferase assay or ChIP assay were employed to identify the interaction between miR-664a-3p and its target gene or Foxp3. The effects in vivo were investigated through a mouse tumorigenicity model.

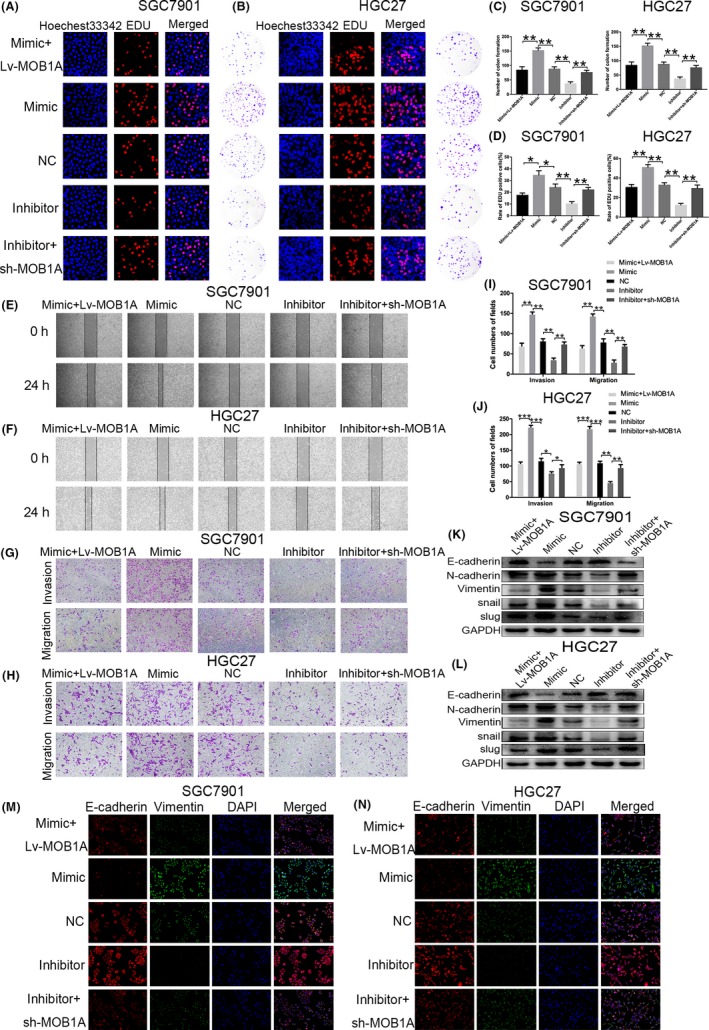
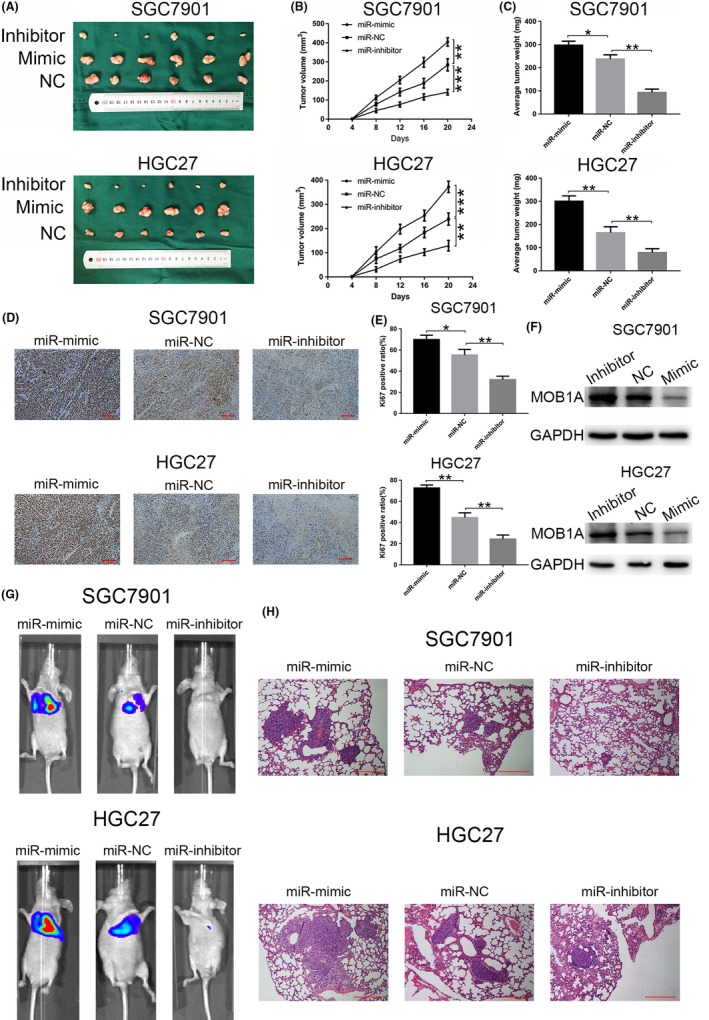
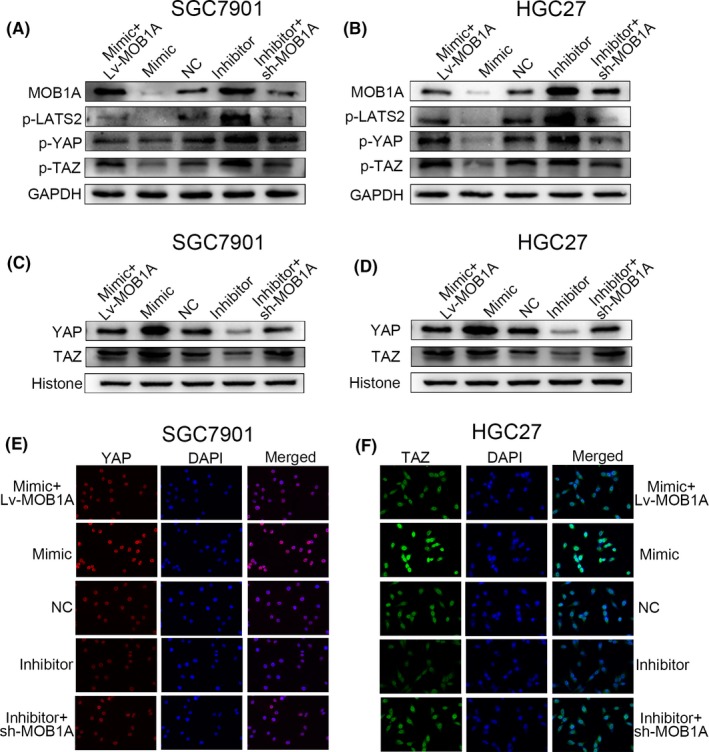
Results: miR-664a-3p was frequently upregulated in GC tissues and cells. Elevated expression of miR-664a-3p significantly promoted proliferation and invasion in vitro and in vivo. MOB1A was confirmed to be a target of miR-664a-3p and restoration of MOB1A attenuated the effects of miR-664a-3p. A series of investigations indicated that miR-664a-3p contributed to EMT process and inactivated the Hippo pathway by downregulating MOB1A.

Conclusion: Taken together, we revealed that miR-664a-3p functions as an oncogene by targeting Hippo pathway in the development of gastric cancer.

Keywords: GC; Hippo; MOB1A; metastasis; miR-664a-3p; proliferation.


Conflict of interest statement

The authors declare that they have no conflict of interest.

Figures

Figure 1
Figure 1
Relative expression of miR‐664a‐3p in GC tissues and cell lines. A, The relative expression of miR‐664a‐3p in 58 pairs of human GC tissues and normal tissues. B, The relative expression of miR‐664a‐3p in GC cells and GES‐1. C, The expression of miR‐664a‐3p in metastasis group compared to non‐metastasis group. D,E, The relative expression of miR‐664a‐3p in cells after tansfection of miR‐664a‐3p mimic, NC and inhibitor lentivirous, respectively, in SGC7901 and HGC27. F, CCK‐8 was used to determine the proliferation of GC cells transfected with miR‐664a‐3p mimic and inhibitor lentivirus in SGC7901 and HGC27. G,H, Representative profiles of EdU assay and colony formation assay in miR‐664a‐3p mimic and inhibitor groups in SGC7901 and HGC27. I,J, The number of colony formation and rate of EdU positive cells were counted in miR‐664a‐3p mimic and inhibitor groups. *P < 0.05, **P < 0.01, ***P < 0.001. The data expressed as the mean ± SD
Figure 2
Figure 2
miR‐664a‐3p facilitates invasion, migration and EMT process in vitro. A,B, Wound‐healing assay was used to determine the migration of GC cells after transfection of miR‐664a‐3p mimic, NC and inhibitor lentivirous, respectively, in SGC7901 and HGC27. C,D, Effects of miR‐664a‐3p alteration on invasion and migration by transwell assay in vitro. E, Effects of miR‐664a‐3p on EMT process analyzed by Gene Set Enrichment Analysis (GSEA). F, The expression of EMT‐associated proteins detected by Western blot when expression of miR‐664a‐3p was altered in SGC7901 and HGC27. G,H, The Immunofluorescence assay of Ecadherin (red) and Vimentin (green) in SGC7901 and HGC27. The nucleus staining with DAPI (blue).*P < 0.05, **P < 0.01, ***P < 0.001. The data expressed as the mean ± SD
Figure 3
Figure 3
MOB1A is a direct target of miR‐664a‐3p and downregulated in GC tissues and cells. A, The relative expression of miR‐664a‐3p in 58 pairs of GC tissues. B, The expression of MOB1A was detected in six pairs of GC samples by Western blot. C, Representative IHC staining of MOB1A in six pairs of GC and normal specimens. D, The relative expression of MOB1A in GC cells compared to GES‐1. E, The survival analysis of MOB1A on the Kaplan‐Meier Plotter. F, Negative relation between of miR‐664a‐3p and MOB1A in GC tissues. G, Luciferase reporter assay was conducted to confirm that miR‐664a‐3p directly binded to the 3′‐UTR region of MOB1A. H, The relative expression of MOB1A after transfection of miR‐664a‐3p mimic, NC and inhibitor lentivirous by qRT‐PCR. I, Relative luciferase activity was analyzed in GC cells co‐transfcted miR‐664a‐3pmimics or NC with pGL3‐MOB1A‐WT or pGL3‐MOB1A‐MUT, respectively. J, Western blot was ultilized to determine the expression of MOB1A when miR‐664a‐3p expression was altered in GC cells
Figure 4
Figure 4
MOB1A restores the effects of miR‐664a‐3p on GC cells. A,B, Co‐transfection of Lv‐MOB1A in miR‐ 664a‐3p mimic cells reversed the promotional function of miR‐664a‐3p in EdU assay and colon formation assay in SGC7901 and HGC27. C,D, The number of colony formation and rate of EdU positive cells were counted in different groups. E,F, Wound‐healing assay was used to verify the rescuement effects of MOB1A on migration of GC cells. G,H, MOB1A eliminated the roles of miR‐664a‐3p on invasion and migration in SGC7901 and HGC27 using transwell assay. I,J, The cells counts of transwell assay in SGC7901 and HGC27. K,L, The expression of EMT‐associated proteins was detected when Lv‐MOB1A or sh‐MOB1A tranfected into miR‐664a‐3p mimic or inhibitor group in vitro. M,N, The immunofluorescence assay of E‐cadherin (red) and Vimentin (green) in SGC7901 and HGC27 after co‐transfection. The nucleus staining with DAPI (blue). *P < 0.05, **P < 0.01, ***P < 0.001. The data expressed as the mean ± SD
Figure 5
Figure 5
miR‐664a‐3p promotes metastasis of GC in vivo. A, photographs of tumors obtained from mice in miR 664a‐3p mimic and inhibitor groups. B,C, tumor volume and weight were calculated in miR‐664a‐3p mimic and inhibitor groups in SGC7901 and HGC27. D,E, Ki67 staining assay was used to further verify that miR‐664a‐3p promoted tumorigenicity. The Ki67 positive ratio was higher in miR‐664a‐3p mimic group, while the opposite trend was shown in miR‐664a‐3p inhibitor group compared with that in miR‐NC group. F, Western blot assay of tumor in mice indicated significant downregulation of MOB1A expression in miR‐664a‐3p mimic group, which was contrast in miR‐664a‐3p inhibitor group. *P < 0.05, **P < 0.01, ***P < 0.001. The data expressed as the mean ± SD. G, Representative photographs of tumors were taken by the IVIS Imaging System in different groups. H, Representative H&E‐stained sections of lung from mice in different groups.
Figure 6
Figure 6
miR‐664a‐3p plays a role in GC cells by directly targeting MOB1A through inactivation of the Hippo pathway. A,B, The alteration of downstream moleculars of the Hippo pathway detected by Western blot. C,D, Elevation of miR‐664a‐3p expression contributed to the trap of YAP and TAZ in nucleus. E,F, YAP and TAZ was accumulated in nucleus in SGC7901 and HGC27, respectively, by immunofluorescence analysis due to increase of miR‐664a‐3p expression and MOB1A could rescue the effects
Figure 7
Figure 7
Foxp3 actives miR‐664a‐3p expression. A, The expression of Foxp3 in 58 pairs of GC specimens. B, The expression of Foxp3 in GC cells compared to GES‐1. C, The survival analysis of Foxp3 on the Kaplan‐Meier Plotter. D, Bioinformatic analysis indicated that Foxp3 might bind to miR‐664a‐3p promoter. E, Relative luciferase activity was analyzed in HEK293 cell. F, ChIP assay was performed with control (rat IgG), anti‐Foxp3 antibody to determine Foxp3 occupancy of miR‐664a‐3p promoter. G,H, The relative expression of miR‐664a‐3p altered when transfected Lv‐Foxp3, Pex3, and sh‐Foxp3 in SGC7901 and HGC27. Pex3 was control vector. I,J, qRT‐PCR was used to detected the relative expression of MOB1A when the level of Foxp3 was altered

References

    1. Torre LA, Bray F, Siegel RL, et al. Global cancer statistics, 2012. CA Cancer J Clin. 2015;65:87‐108. - PubMed
    1. Van Cutsem E, Sagaert X, Topal B, et al. Gastric cancer. Lancet. 2016;388(10060):2654‐2664. - PubMed
    1. Ferlay J, Soerjomataram I, Dikshit R, et al. Cancer incidence and mortality worldwide: sources, methods and major patterns in GLOBOCAN 2012. Int J Cancer. 2015;136:E359‐E386. - PubMed
    1. Ikoma N, Blum M, Chiang Y, et al. Race is a risk for lymph node metastasis in patients with gastric cancer. Ann Surg Oncol. 2017;24:960‐965. - PubMed
    1. Glockzin G, Piso P. Current status and future directions in gastric cancer with peritoneal dissemination. Surg Oncol Clin N Am. 2012;21:625‐633. - PubMed

Publication types

MeSH terms