. 2020 Mar;25(2):e12726.
doi: 10.1111/adb.12726. Epub 2019 Mar 18.

Influence of nonsynaptic α1 glycine receptors on ethanol consumption and place preference

Affiliations

Influence of nonsynaptic α1 glycine receptors on ethanol consumption and place preference

Braulio Muñoz et al. Addict Biol. 2020 Mar.

Abstract

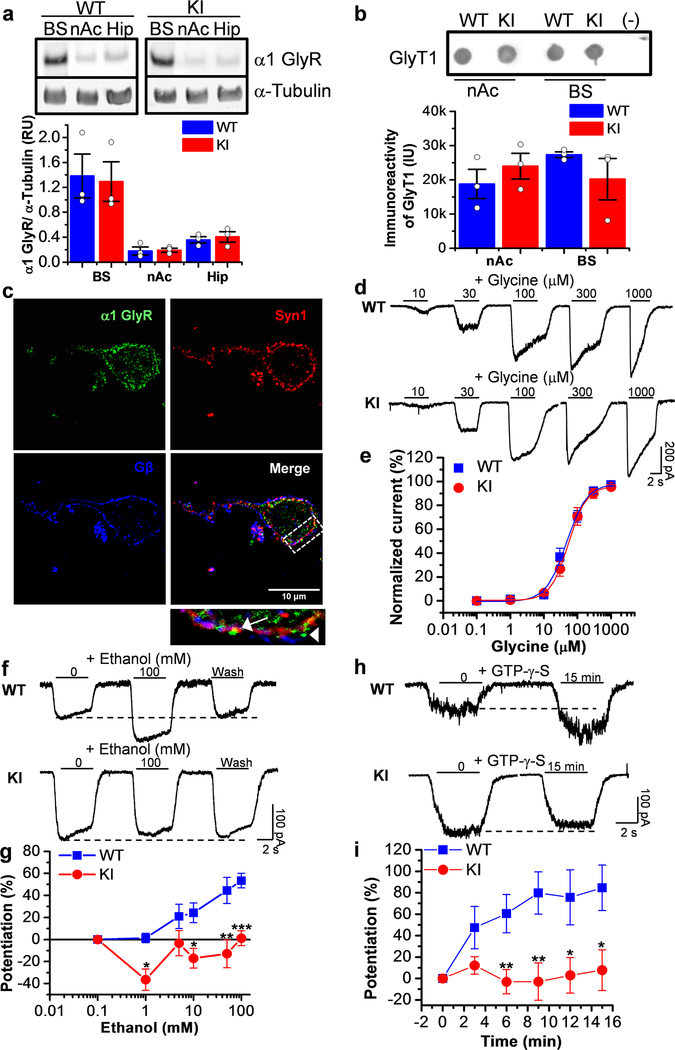
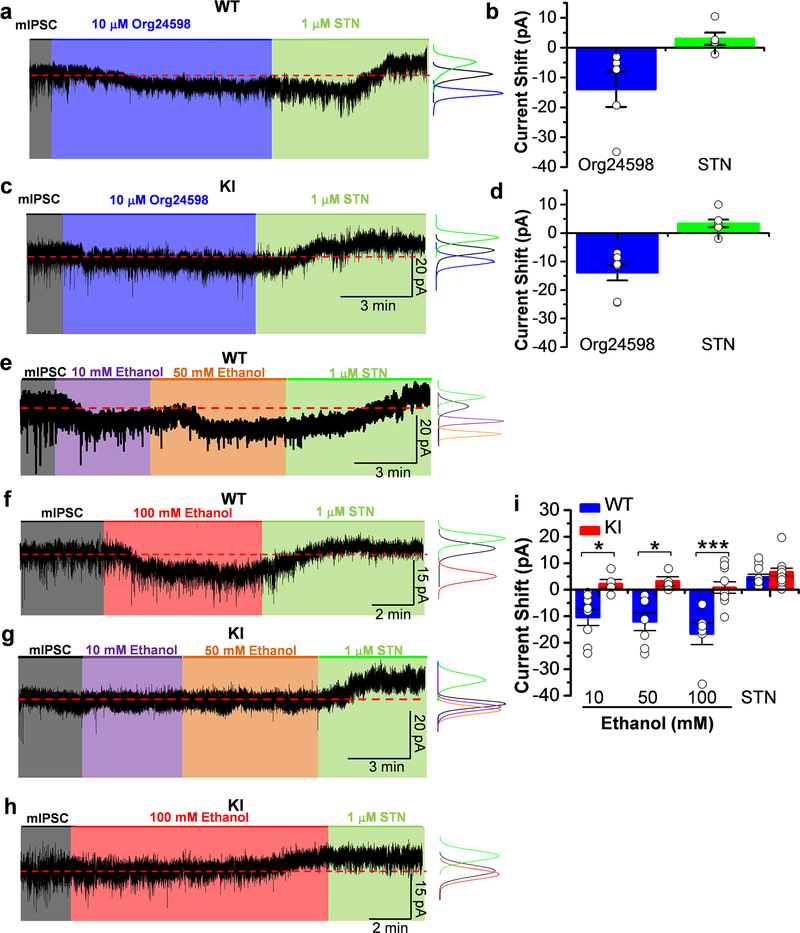
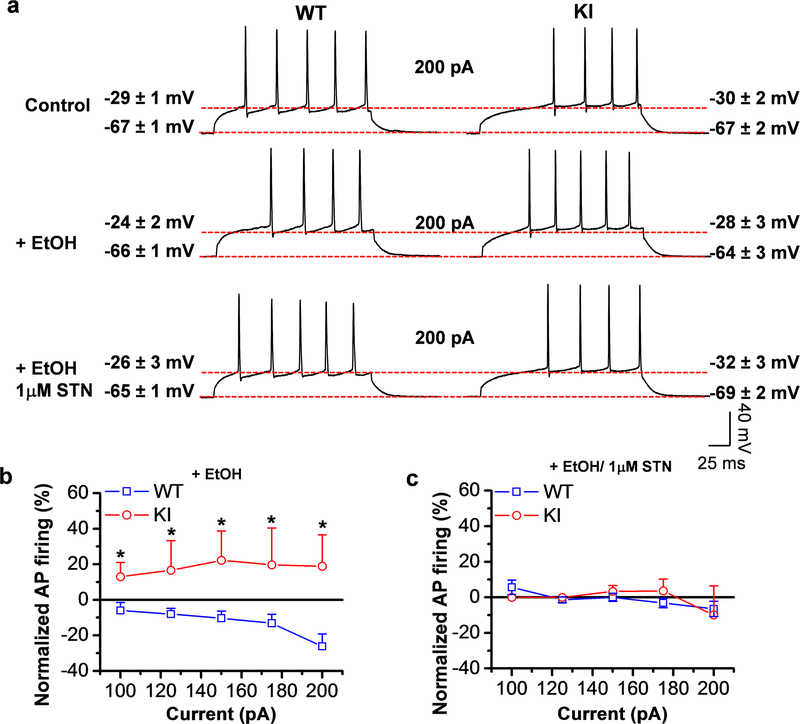
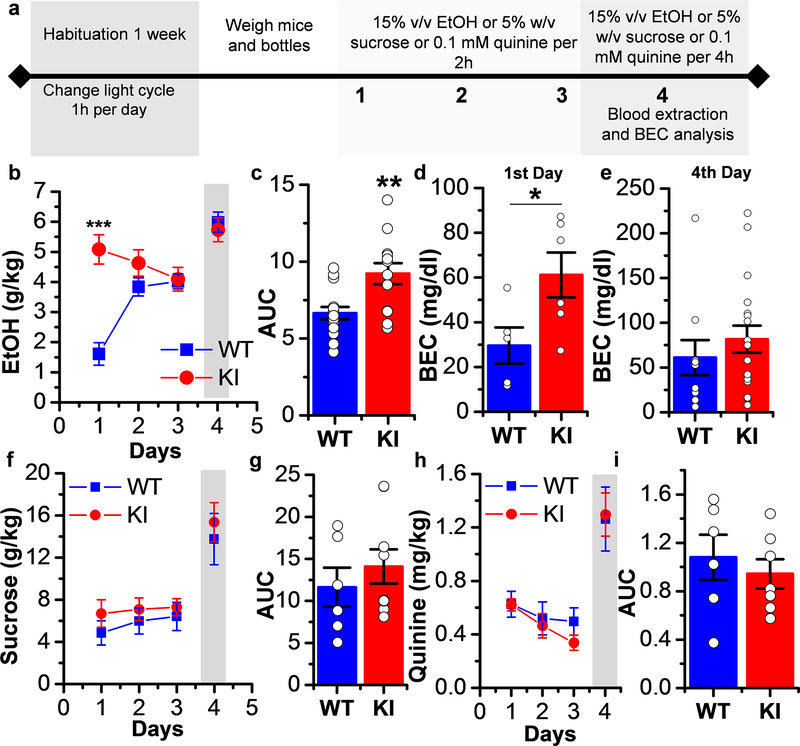
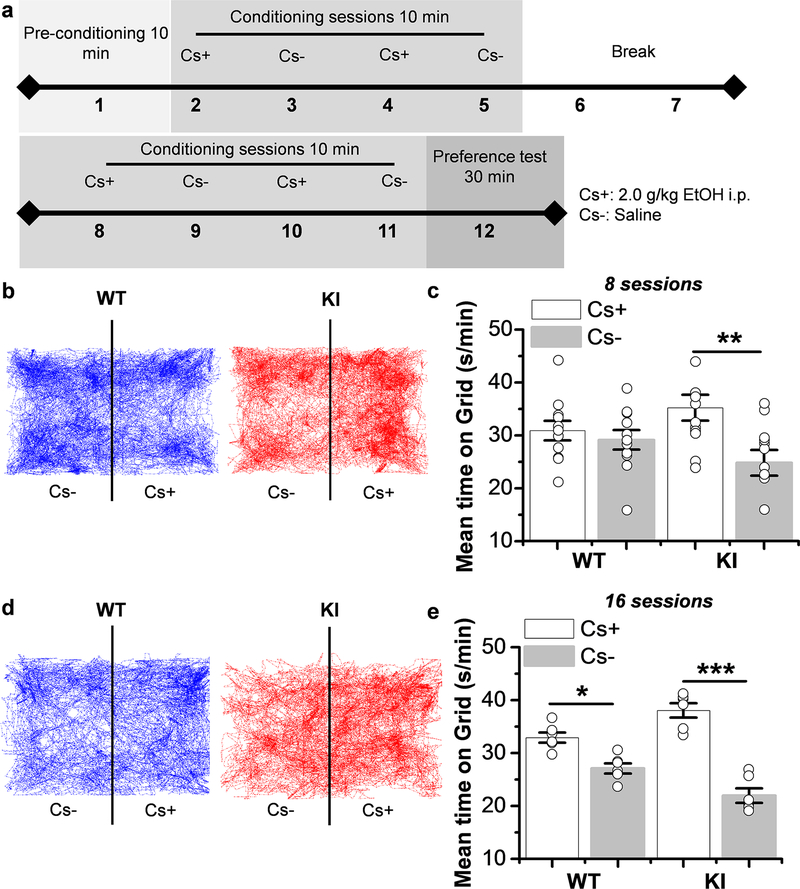
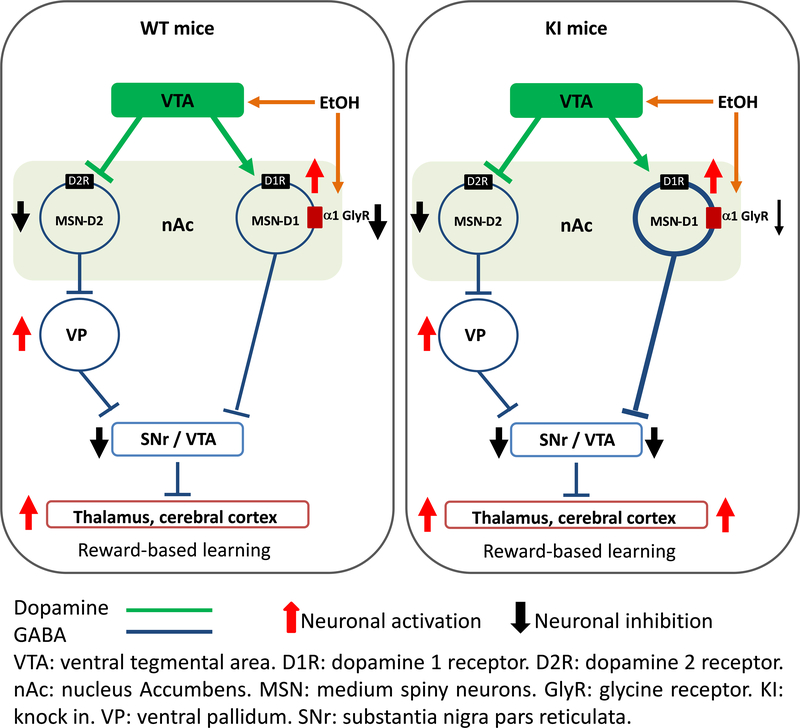
Here, we used knock-in (KI) mice that have ethanol-insensitive alpha 1 glycine receptors (GlyRs) (KK385/386AA) to examine how alpha 1 GlyRs might affect binge drinking and conditioned place preference. Data show that tonic alpha 1 GlyR-mediated currents were exclusively sensitive to ethanol only in wild-type mice. Behavioral studies showed that the KI mice have a higher intake of ethanol upon first exposure to drinking and greater conditioned place preference to ethanol. This study suggests that nonsynaptic alpha 1-containing GlyRs have a role in motivational and early reinforcing effects of ethanol.

Alcohol abuse leads to great medical, social, and economic burdens throughout the world. It is believed that the rewarding actions of alcohol are mediated by alterations in the mesolimbic dopaminergic system leading to increased levels of dopamine in the nucleus accumbens (NAc). Little is known about the role that ligand-gated ion channels (LGICs), such as glycine receptors (GlyRs), have in regulating levels of ethanol intake and place preference. In this study, we used knock-in (KI) mice that have ethanol-insensitive α1 GlyRs (KK385/386AA) and a combination of electrophysiological and behavioral approaches to examine how expression of ethanol-resistant α1 GlyRs in brain neurons might affect binge drinking and conditioned place preference. Data show that tonic α1 GlyR-mediated currents that modulate accumbal excitability were exclusively sensitive to ethanol only in wild-type (WT) mice. Behavioral studies showed that the KI mice have a higher intake of ethanol upon first exposure to drinking and greater conditioned place preference to ethanol, suggesting that α1 GlyRs in the brain have a protective role against abuse. This study suggests that nonsynaptic α1-containing GlyRs have a role in motivational and early reinforcing effects of ethanol and open a novel opportunity for pharmacotherapy development to treat alcohol use disorders.

Keywords: G-protein; alcohol and alcoholism; animal models; glycine receptor; nucleus accumbens; receptor pharmacology.


Figures

Figure 1.
Figure 1.. Presence of GlyRs sensitive to the effects of ethanol in nAc.
a) Western blot of brainstem (BS), nucleus accumbens (nAc) and hippocampus (Hip) from WT and KI animals for α1 GlyR and α−tubulin. Western blot analysis shows low levels of α1 GlyR in nAc and Hip and high levels in BS (n=3 animals). b) Dot blot from nAc and BS of WT and KI mice for GlyT1. The graph shows a quantitative analysis of immunoreactivity for GlyT1 in nAc and BS from WT and KI animals (n=3 mice). c) Confocal photomicrograph of dissociated neurons from nAc showing immunoreactivity to α1 GlyR (green), synapsin 1 (red) and Gβ (blue). The presence of colocalization of α1 GlyR with Syn1 represents a synaptic receptor (arrow); while α1 GlyR alone is non-synaptic (arrowhead). The scale bar represents 10 μm. d) Representative traces of glycine evoked currents (1–1000 μM) in dissociated neurons from WT and KI mice. e) The graph shows the glycine concentration-response curve in accumbal neurons from WT (blue squares) and KI mice (red circles). The EC50 was similar in both genotypes: 47 ± 6 μM WT and 54 ± 1 μM KI (WT n=15 neurons from 3 animals and KI n=12 neurons from 2 animals). f) Representative evoked current traces from WT and KI showing the effects of 100 mM ethanol measured with an EC10 of glycine (15 μM). g) The graph summarizes the effect of ethanol concentrations on accumbal neurons from WT (blue squares) and KI (red circles) animals. Data shows positive modulation only in WT neurons (n=12 neurons from 2 WT mice, n=22 neurons from 6 KI mice) (p=0.00675, F1,30= 8.4673). h) Representative evoked current traces from WT and KI showing the effects of G protein activation by intracellular dialysis of GTP-γ-S (0.2 mM) for 15 minutes. i) The time course graph summarizes the effects of G-protein activation by GTP-γ-S in MSNs from WT (blue squares) and KI (red circles) animals. An important potentiation was found only in WT neurons (n=5–8 neurons from 2 WT mice, n=9–11 neurons from 3 KI mice) (p=1.218E−7, F1,94= 32.802). Data are mean ± SEM. *p<0.05, **p<0.01, ***p<0.001. Two-way ANOVA, Tukey test.
Figure 2.
Figure 2.. Presence of tonic inhibitory currents mediated by GlyRs that are sensitive to ethanol in WT nAc.
a and c) Representative electrophysiological trace from WT and KI neuron in the presence of 10 μM Org24598 (blue shaded area) and 1 μM STN (green shaded area). The red dotted line indicates the baseline. The histogram graph shows the analysis of the trace. Org24598 induced an inward current in nAc. STN abolished mIPSCs and produced a positive shift in the holding current in both genotypes. b and d) The graph summarizes the effects of Org24598 and STN on glycine tonic currents from WT and KI neurons. (n=5 neurons from 3 WT mice and n=7 neurons from 4 KI mice). e) Representative electrophysiological trace from a WT neuron in the presence of 10 (purple shaded area) and 50 mM ethanol (orange shaded area) and 1 μM STN (green shaded area). The red dotted line indicates the baseline. The histograms show the analysis of the trace. Low and high ethanol concentrations increased GlyR-mediated currents in the nAc. This effect was abolished by STN. f) Representative electrophysiological trace from a WT neuron in the presence of 100 mM ethanol (red shaded area) and 1 μM STN (green shaded area). The red dotted line indicates the baseline. The histogram graph shows the analysis of the trace. Ethanol increased the GlyR-mediated current in the nAc. This effect was abolished by STN. g) Representative electrophysiological trace from a KI neuron in the presence of 10 (purple shaded area) and 50 mM ethanol (orange shaded area) and 1 μM STN (green shaded area). The red dotted line indicates the baseline. The histogram graph shows the analysis of the trace. GlyR-mediated tonic currents in KI were not affected by low and high concentrations of ethanol. STN produced a positive shift in the holding current. h) Representative electrophysiological trace from a KI neuron in the presence of 100 mM ethanol (red shaded area) and 1 μM STN (green shaded area). The red dotted line indicates the baseline. The histogram graph shows the analysis of the trace. Ethanol did not affect the holding current; however STN abolished the mIPSCs and produced a positive shift in the holding current. Tonic currents in KI neurons were resistant to ethanol effects. i) The graph summarizes the effects of 10, 50 and 100 mM ethanol and STN on WT and KI glycine tonic currents, showing an increase in tonic current only in WT neurons (p=5.189E−7, F1,36=37.1487). Data are mean ± SEM. n=7 neurons from 3 WT mice and n=5 neurons from 2 KI mice for 10 and 50 mM ethanol and n=6 neurons from 3 WT mice and n=10 neurons from 4 KI mice for 100 mM ethanol. ns p>0.05, *p<0.05, ***p<0.001. Two-way ANOVA, Tukey test.
Figure 3.
Figure 3.. Ethanol decreased excitability in WT neurons.
a) Representative action potential traces from WT and KI neurons stimulated with 200 pA of current clamp in the absence and presence of 100 mM ethanol and co-application of 100 mM ethanol plus 1 μM STN. Similar resting (−67 ± 1 mV WT and −67 ± 2 mV KI) and threshold potentials (−29 ± 1 mV WT and −30 ± 2 mV KI) were found in control condition. Traces show a decrease in AP in WT neurons with 100 mM ethanol that was reverted by the co-application of ethanol plus STN. This effect was not present in KI neurons. b) Graph shows the decrease in AP in WT neurons with ethanol at 100–200 pA current clamp, while KI neurons were resistant to the effects of ethanol (p= 2.70E−6, F1,116= 24.3628, n=13–20 neurons from 3 WT mice and n=6–14 from 3 KI mice). c) Graph shows the recovery of APs in WT neurons by ethanol/STN at 100–200 pA, while KI neurons were resistant to the effects of ethanol. Data represent mean ± SEM.*p<0.05. Two-way ANOVA, Tukey test.
Figure 4.
Figure 4.. Increased ethanol first exposure consumption without change in sucrose and quinine intake in KI mice.
a) Experimental timeline of DID experiment for ethanol, sucrose or quinine. b) Graph summarizing the DID test in WT and KI mice. The gray shaded bar represents 4 hr sessions rather than the 2 hr sessions on the other days. WT mice had an escalated ethanol consumption, while ethanol consumption in KI mice was elevated for all the days tested (p=1.79281E−6, F3,55= 12.846, n=15 WT mice and n=13 KI mice, Two-way ANOVA, Bonferroni post hoc test). c) Summary graph of area under the curve (AUC) showing a higher area in KI mice (p=0.0026, t26=3.336, Unpaired Student’s t test, n=15 WT mice and n=13 KI mice). d) The graph shows that after the 1st day of consumption KI mice had higher BEC than WT mice (p=0.042, t9= 2.369, Unpaired Student’s t test, n=5 WT mice and n=6 KI mice). e) The graph shows that there were no differences in the blood ethanol concentration between WT and KI mice after the 4th day of consumption (p=0.417, t26= 0.825, Unpaired Student’s t test, n=10 WT mice and n=18 KI mice). f) The graph shows that no differences were found in sucrose consumption between WT and KI mice (n=6 WT mice and n=9 KI mice). The gray shaded bar represents 4 hr sessions rather than the 2 hr sessions on the other days. g) Summary graph of AUC showing no difference in the area between WT and KI mice (p=0.447, t13=0.784, Unpaired Student’s t test, n=6 WT mice and n=9 KI mice). h) The graph shows that no differences were found in quinine consumption between WT and KI mice (p=0.589, F1,47= 0.294, Two-way ANOVA, n=6 WT mice and n=7 KI mice). The gray shaded bar represents 4 hr sessions rather than the 2 hr sessions on the other days. i) Summary graph of AUC showing no difference in the area between WT and KI mice (p=0.539, t11= 0.6334, Unpaired Student’s t test, n=6 WT mice and n=7 KI mice). Data represent mean ± SEM. *p<0.05, **p<0.01, ***p<0.001.
Figure 5.
Figure 5.. Increase in ethanol-conditioned place preference in KI mice.
a) Timeline design of CPP experiment. b) Representative trajectory traces of 30 min obtained from WT (left) and KI (right) mice during preference test after 8 conditioning sessions. c) The graph summarizes the Post conditioned place preference after 8 sessions in WT and KI mice and demonstrates that KI mice spent more time in the ethanol side (Cs+) than in the vehicle side (Cs-) (p=0.0062, F1,22= 9.183). WT mice did not show any preference for either side (p=0.508, F1,20= 0.454) (n=11 WT mice and n=12 KI mice).d) Representative trajectory traces of 30 min obtained from WT (left) and KI (right) mice during preference test after 16 conditioning sessions. e) The graph summarizes the Post conditioned place preference after 16 sessions in WT and KI mice and demonstrates that WT and KI mice spent more time in the ethanol side (Cs+) than in the vehicle side (Cs-) (WT: p=0.020, F1,10= 18.18 and KI: p=8.1E−6, F1,10= 69.77) (n=6 WT mice and n=6 KI mice). Data represent mean ± SEM, **p<0.01, ***p<0.001. One-way ANOVA, Bonferroni post hoc test.
Figure 6.
Figure 6.. Glycine receptors containing α1 subunits affect preference to ethanol.
In the absence of ethanol, WT GlyRs activation inhibits (black arrow) D1 MSNs releasing the GABAergic inhibition of VTA by disinhibition (thalamus is excited, red arrow). In presence of ethanol, release of dopamine from VTA increase and further stimulate D1 MSN in the nAc (red arrow). In parallel, ethanol potentiates non-synaptic α1 GlyRs in D1 MSN decreasing membrane excitability, see figure 3 and (Forstera et al., 2017). On the other hand, mutated α1 GlyR in the nAc are insensitive to ethanol leading to a higher activation of MSNs (more GABA released, thicker blue line) and higher VTA inhibition (black arrow). This mechanism explains the enhanced behavior/learning results in this study that show high first exposure and preference to ethanol by these KI mice (see Fig. 4). (Modified from Nakanishi et al. (2014))

Similar articles

Cited by

References

    1. Aguayo LG, Castro P, Mariqueo T, Munoz B, Xiong W, Zhang L, Lovinger DM, Homanics GE (2014) Altered sedative effects of ethanol in mice with alpha1 glycine receptor subunits that are insensitive to Gbetagamma modulation. Neuropsychopharmacology : official publication of the American College of Neuropsychopharmacology 39:2538–2548. - PMC - PubMed
    1. Aguayo LG, Tapia JC, Pancetti FC (1996) Potentiation of the glycine-activated Cl- current by ethanol in cultured mouse spinal neurons. The Journal of pharmacology and experimental therapeutics 279:1116–1122. - PubMed
    1. Avila A, Vidal PM, Dear TN, Harvey RJ, Rigo JM, Nguyen L (2013) Glycine receptor alpha2 subunit activation promotes cortical interneuron migration. Cell Rep 4:738–750. - PMC - PubMed
    1. Badanich KA, Doremus-Fitzwater TL, Mulholland PJ, Randall PK, Delpire E, Becker HC (2011) NR2B-deficient mice are more sensitive to the locomotor stimulant and depressant effects of ethanol. Genes Brain Behav 10:805–816. - PMC - PubMed
    1. Badanich KA, Mulholland PJ, Beckley JT, Trantham-Davidson H, Woodward JJ (2013) Ethanol reduces neuronal excitability of lateral orbitofrontal cortex neurons via a glycine receptor dependent mechanism. Neuropsychopharmacology : official publication of the American College of Neuropsychopharmacology 38:1176–1188. - PMC - PubMed

Publication types

LinkOut - more resources