. 2019 May 13;21(5):425-435.
doi: 10.1021/acscombsci.9b00037. Epub 2019 Mar 29.

Activity-Based DNA-Encoded Library Screening

Affiliations

Activity-Based DNA-Encoded Library Screening

Wesley G Cochrane et al. ACS Comb Sci. .

Abstract

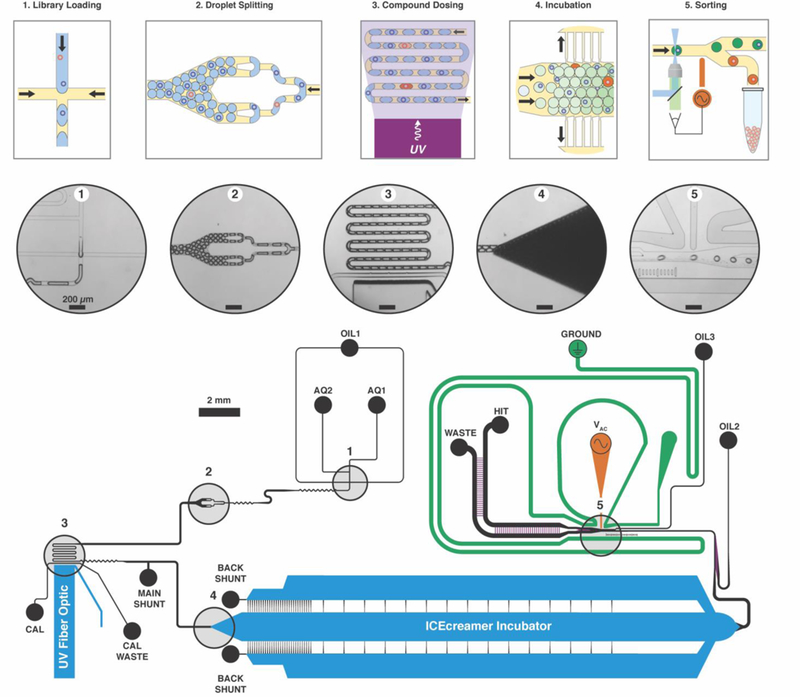
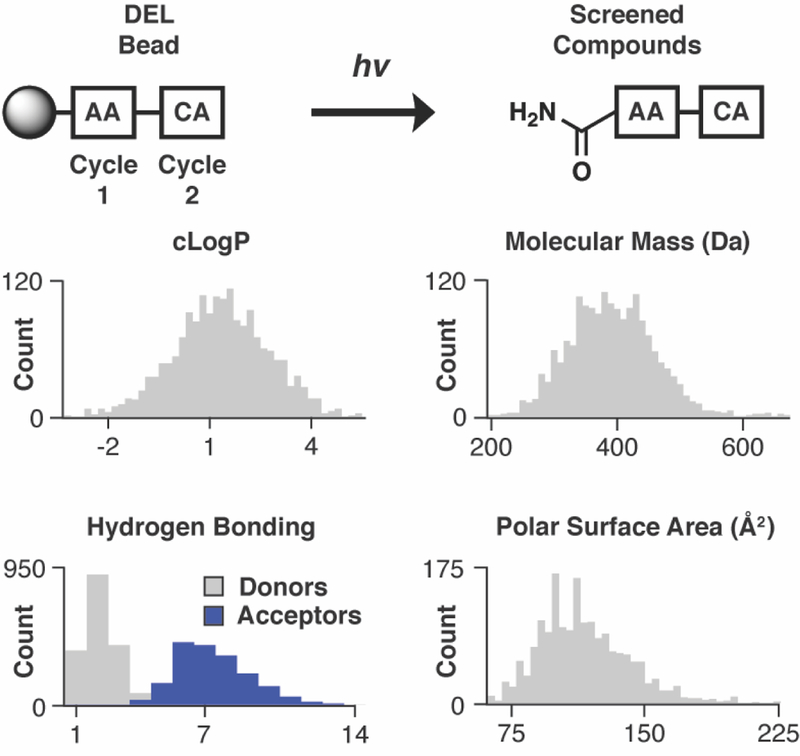
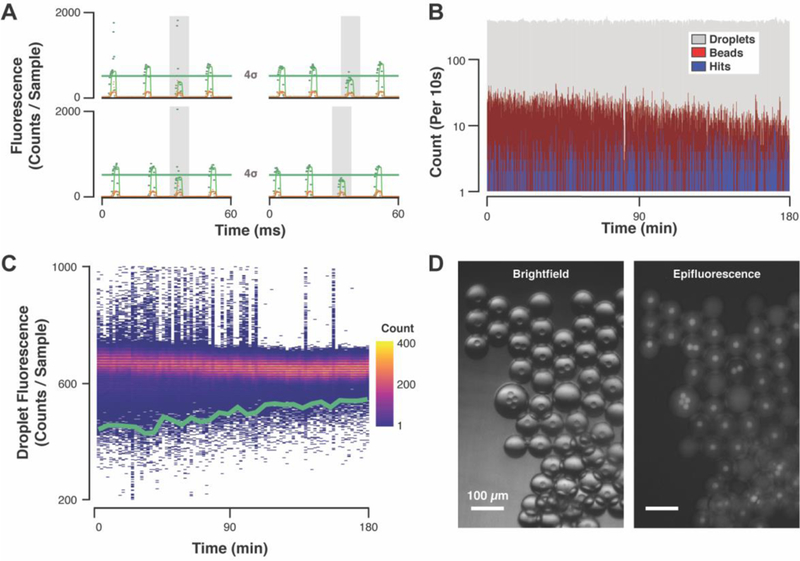
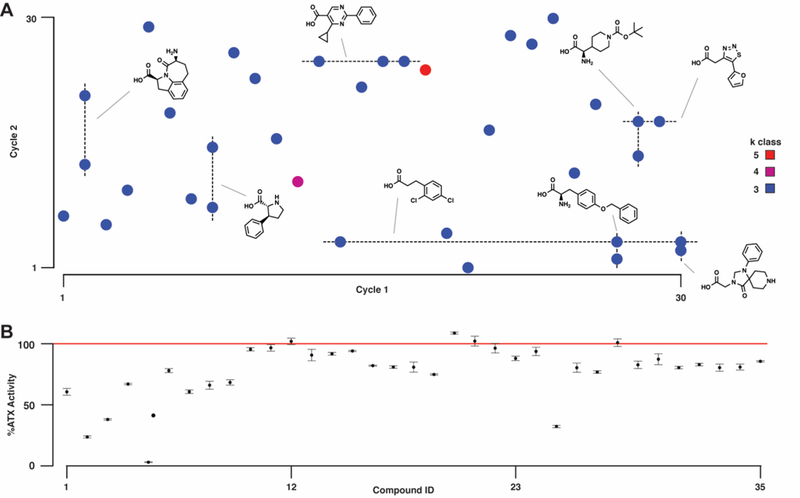
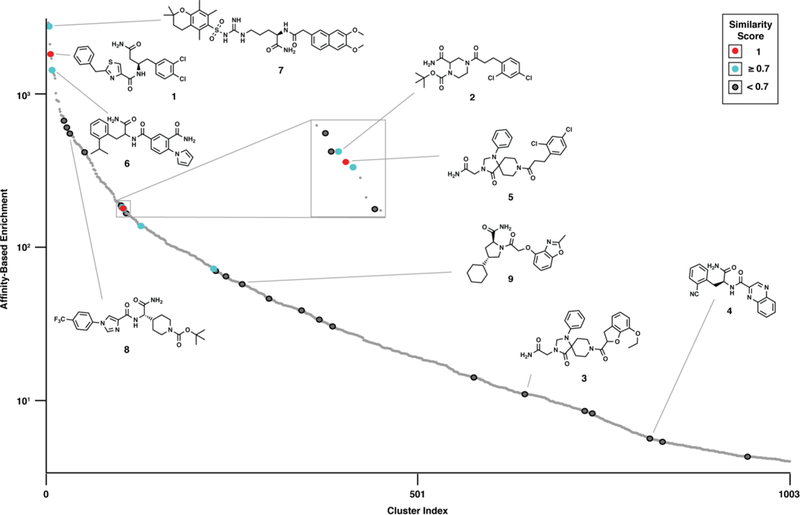
Robotic high-throughput compound screening (HTS) and, increasingly, DNA-encoded library (DEL) screening are driving bioactive chemical matter discovery in the postgenomic era. HTS enables activity-based investigation of highly complex targets using static compound libraries. Conversely, DEL grants efficient access to novel chemical diversity, although screening is limited to affinity-based selections. Here, we describe an integrated droplet-based microfluidic circuit that directly screens solid-phase DELs for activity. An example screen of a 67 100-member library for inhibitors of the phosphodiesterase autotaxin yielded 35 high-priority structures for nanomole-scale synthesis and validation (20 active), guiding candidate selection for synthesis at scale (5/5 compounds with IC50 values of 4-10 μM). We further compared activity-based hits with those of an analogous affinity-based DEL selection. This miniaturized screening platform paves the way toward applying DELs to more complex targets (signaling pathways, cellular response) and represents a distributable approach to small molecule discovery.

Keywords: DNA-encoded library; OBOC; droplet; drug discovery; microfluidics.


Figures

Figure 1.
Figure 1.. Integrated microfluidic screening architecture.
Library beads enter the circuit together with ATX activity-based fluorogenic substrate (AQ1) and mix with enzyme (AQ2) immediately upstream of the water-in-oil (OIL1) flow-focusing junction (1) where droplets form (15 Hz). Flow continues toward the droplet splitter (2), which splits each droplet in half twice (60 Hz). Compound is released from beads into the ATX activity assay droplets as they traverse a serpentine photochemical reactor illuminated with a 365-nm waveguide-coupled LED (3). Oil drains from the droplet flow, packing droplets in the ICEcreamer (4) for assay incubation. At the incubator exit, two oil flows space (OIL2) and focus (OIL3) the droplet stream for analysis. Laser-induced fluorescence assay detection occurs upstream of the droplet sorting junction (5). Hit droplets are statistically significantly less fluorescent than the overall instantaneous droplet population, and trigger a high-voltage AC pulse to the working electrode (VAC) that electrokinetically forces the hit droplet toward the electrode and into the hit collection flow. Channel heights depicted in purple and blue are 30 μm and 250 μm, respectively. All other channel heights are 50 μm.
Figure 2.
Figure 2.. Library properties.
The library was generated with two cycles of acylation chemistry with amino acid (AA) and carboxylic acid (CA) monomers, respectively. Photochemical cleavage releases compound from the library bead as a primary amide. Physicochemical property analysis of photochemically cleaved compounds included hydrophobicity (cLogP), molar mass, hydrogen bond donors/acceptors, and polar surface area. Most compounds analyzed (1,738/1,766) are ‘drug-like’.
Figure 3.
Figure 3.. Microfluidic activity-based screening data.
(A) Laser-induced fluorescence traces of hit droplets contain raw data for ATX activity assay signal (520 nm, green points), raw internal standard signal (570 nm, orange points), and median-smoothed data for both channels (green and orange lines). The autofluorescent library beads occasionally pass through the confocal volume, resulting in fluorescence signal spikes (see top and bottom left traces) that are smoothed to identify droplet peak fluorescence, but also used to monitor bead introduction. If a droplet peak fluorescence falls below the sorting threshold (green lines), it is sorted into the hit collection. For each droplet, the mean (μ) and standard deviation (σ) of the previous 1,000 droplet peak fluorescence values is calculated to establish the sorting threshold (μ - 4σ). (B) Droplet generation and hit droplet identification rates were uniform while bead-induced fluorescence signal spikes steadily decreased over the 3 h screen. (C) Hit distribution and negative droplet fluorescence uniformity are visualized in a heat map of binned droplet fluorescence signals (120-s bins) overlaid with sorting threshold (green line). (D) An example hit collection imaged in brightfield and epifluorescence (λex = 470 nm, λem = 525 nm) contains droplets of variably attenuated activity assay signal.
Figure 4.
Figure 4.. Hit collection deconvolution and validation.
(A) Hit bead sequences were decoded to monomer structures based on their synthesis-encoding region. Replicate hits exhibit a lower false discovery rate (FDR) and thus are statistically more likely to validate as active molecules. Higher numbers of replicates (k class) correlate with exponentially lower FDR. Dashed lines indicate monomer conservation in cycle 1 (vertical) and cycle 2 (horizontal). Monomer conservation in k class ≥ 3 hits is shown. (B) Thirty-five compounds were prepared via parallel solid-phase synthesis, structure-validated by mass spectral analysis, and irradiated (λ = 360 nm) to release compound from the beads. Photocleavage reaction supernatants were then incubated with ATX and the samples subsequently assayed for enzymatic activity using conditions analogous to the droplet-scale ATX assay. Intervals represent standard deviation of the mean.
Figure 5.
Figure 5.. Activity- and affinity-based screening comparison.
The 35 activity-based screening hits were clustered by chemical similarity with those of an 866,250-member DEL affinity selection. Larger dots indicate that an activity-based hit is included in the cluster. A higher similarity score indicates that the activity-based hit was more similar to the cluster representative of the DEL affinity selection hit. Affinity-based hits discovered as activity-based hits have similarity score = 1. Clusters are ranked by their cumulative enrichment from an affinity-based screen.

References

    1. Schreiber SL; Kotz JD; Li M; Aubé J; Austin CP; Reed JC; Rosen H; White EL; Sklar LA; Lindsley CW; et al. Advancing Biological Understanding and Therapeutics Discovery with Small-Molecule Probes. Cell 2015, 161, 1252–1265. - PMC - PubMed
    1. Brown DG; Boström J Where Do Recent Small Molecule Clinical Development Candidates Come From? J Med Chem 2018, 61, 9442–9468. - PubMed
    1. Scott DE; Bayly AR; Abell C; Skidmore J Small Molecules, Big Targets: Drug Discovery Faces the Protein-Protein Interaction Challenge. Nat Rev Drug Discov 2016, 15, 533–550. - PubMed
    1. Angelbello AJ; Chen JL; Childs-Disney JL; Zhang P; Wang Z-F; Disney MD Using Genome Sequence to Enable the Design of Medicines and Chemical Probes. Chem. Rev. 2018, 118, 1599–1663. - PMC - PubMed
    1. Tommasi R; Brown DG; Walkup GK; Manchester JI; Miller AA ESKAPEing the Labyrinth of Antibacterial Discovery. Nat Rev Drug Discov 2015, 14, 529–542. - PubMed

Publication types

MeSH terms