. 2019 Mar 15;9(3):51.
doi: 10.3390/metabo9030051.

PLS2 in Metabolomics

Affiliations

PLS2 in Metabolomics

Matteo Stocchero et al. Metabolites. .

Abstract

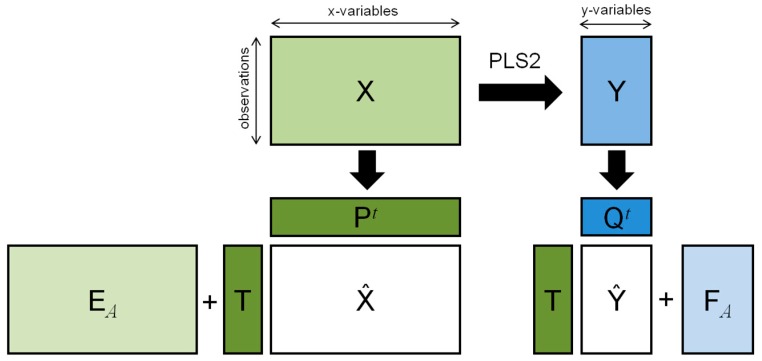
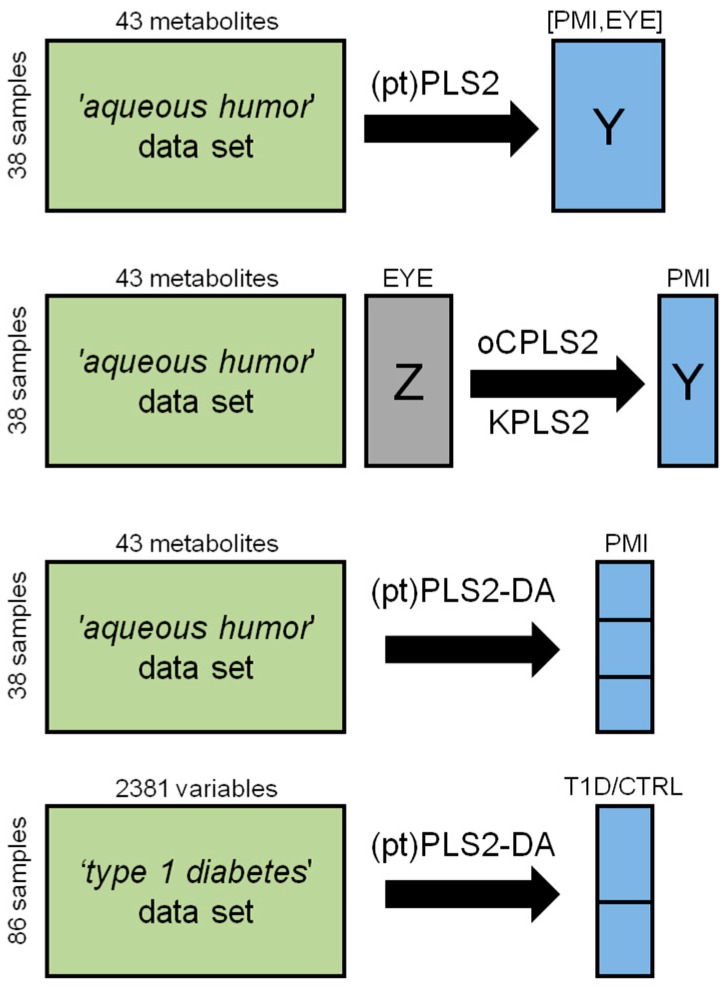
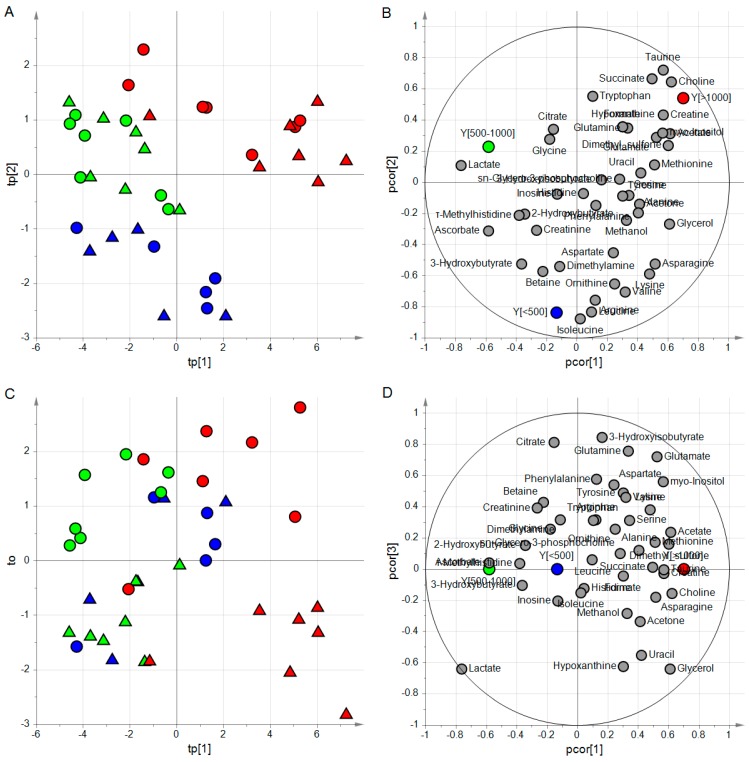
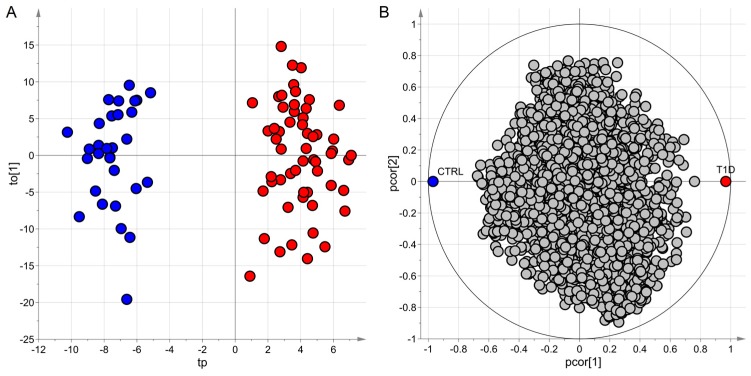
Metabolomics is the systematic study of the small-molecule profiles of biological samples produced by specific cellular processes. The high-throughput technologies used in metabolomic investigations generate datasets where variables are strongly correlated and redundancy is present in the data. Discovering the hidden information is a challenge, and suitable approaches for data analysis must be employed. Projection to latent structures regression (PLS) has successfully solved a large number of problems, from multivariate calibration to classification, becoming a basic tool of metabolomics. PLS2 is the most used implementation of PLS. Despite its success, PLS2 showed some limitations when the so called 'structured noise' affects the data. Suitable methods have been recently introduced to patch up these limitations. In this study, a comprehensive and up-to-date presentation of PLS2 focused on metabolomics is provided. After a brief discussion of the mathematical framework of PLS2, the post-transformation procedure is introduced as a basic tool for model interpretation. Orthogonally-constrained PLS2 is presented as strategy to include constraints in the model according to the experimental design. Two experimental datasets are investigated to show how PLS2 and its improvements work in practice.

Keywords: PLS-DA; orthogonally-constrained PLS2; post-transformation of PLS2; projection to latent structures regression.


Conflict of interest statement

The authors declare no conflict of interest.

Figures

Figure 1
Figure 1
Matrix decomposition generated by PLS2.
Figure 2
Figure 2
Structure of the data used to present how PLS2-based methods work in practice and techniques applied for data modelling.
Figure 3
Figure 3
ptPLS2 model built to investigate the effects of PMI and EYE on the metabolite content of AH. In the score scatter plot of panel A, each AH sample is represented as a circle with a color code depending on the value of PMI. The arrow indicates the direction where PMI increases. Samples of opened or closed eyes are arranged above or below the arrow, respectively. In the correlation loading plot of panel B, the quantified metabolites (light grey circles) and the factors (PMI in blue and EYE in red) are reported in the same plot. It is possible to highlight a group of metabolites (choline, taurine, and succinate) closely related to the effect of PMI whereas other metabolites (citrate, 3-hydroxyisobutyrate, glycerol, and uracil) are related to the effect of EYE.
Figure 4
Figure 4
Spectrum of SR; taurine, choline, and succinate resulted significantly related to PMI (α = 0.05); the dashed line indicates the threshold used for variable selection (F(0.05,36,35) = 1.75).
Figure 5
Figure 5
ptPLS2-DA model; the two predictive latent variables tp[1] and tp[2] are reported in the score scatter plot of panel A where the samples of the three classes result to belong to three different regions; in the correlation loading plot of panel B, groups of metabolites characterizing each class can be identified; if one considers the orthogonal latent variable to, samples of opened eyes show positive values while samples of closed eyes negative values (panel C); the correlation loading plot of panel D allows the identification of metabolites related to the state of the eye; samples with PMI < 500 min are colored in blue, samples with PMI between 500 and 1000 min in green and samples with PMI > 1000 min in red; triangles are used for samples of closed eyes whereas circles for opened eyes.
Figure 6
Figure 6
ptPLS2-DA model; the predictive latent variables tp and the first non-predictive latent variable to[1] are reported in the score scatter plot of panel A where the samples of the two classes belong to two different regions; in the correlation loading plot of panel B, groups of metabolites characterizing each class can be identified; samples of subjects with type 1 diabetes (T1D) are colored in red whereas samples of the control group (CTRL) in blue.

References

    1. Wold S., Martens H., Wold H. The multivariate calibration method in chemistry solved by the PLS method. In: Ruhe A., Kågström B., editors. Proceedings of the Conference on Matrix Pencils, Lecture Notes in Mathematics. Springer; Heidelberg, Germany: 1983. pp. 286–293.
    1. Wold S. Personal memories of the early PLS development. Chemom. Intell. Lab. Syst. 2001;58:83–84. doi: 10.1016/S0169-7439(01)00152-6. - DOI
    1. Martens H. Reliable and relevant modelling of real world data: A personal account of the development of PLS Regression. Chemom. Intell. Lab. Syst. 2001;58:85–95. doi: 10.1016/S0169-7439(01)00153-8. - DOI
    1. De Jong S. SIMPLS: An alternative approach to partial least squares regression. Chemom. Intell. Lab. Syst. 1993;18:251–263. doi: 10.1016/0169-7439(93)85002-X. - DOI
    1. Burnham A.J., Viveros R., MacGregor J.F. Frameworks for latent variable multivariate regression. J. Chemom. 1996;10:31–45. doi: 10.1002/(SICI)1099-128X(199601)10:1<31::AID-CEM398>3.0.CO;2-1. - DOI

LinkOut - more resources