Clinical Trial
. 2019 Mar 15;8(3):252.
doi: 10.3390/cells8030252.

Hepatitis C Direct Acting Antivirals and Ribavirin Modify Lipid but not Glucose Parameters

Affiliations
Clinical Trial

Hepatitis C Direct Acting Antivirals and Ribavirin Modify Lipid but not Glucose Parameters

Mary-Anne Doyle et al. Cells. .

Abstract

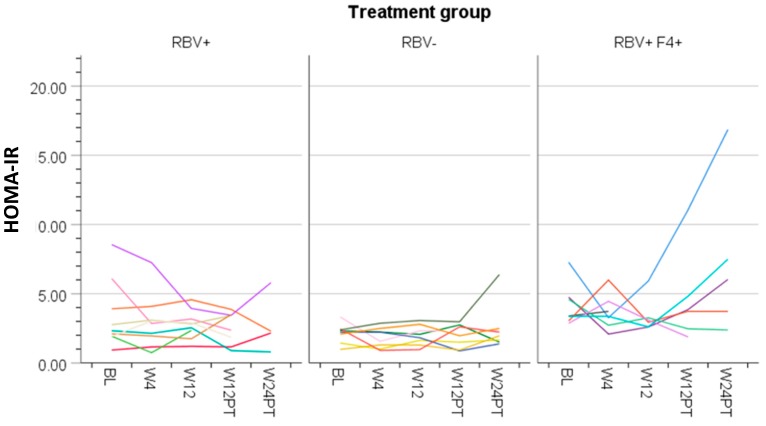
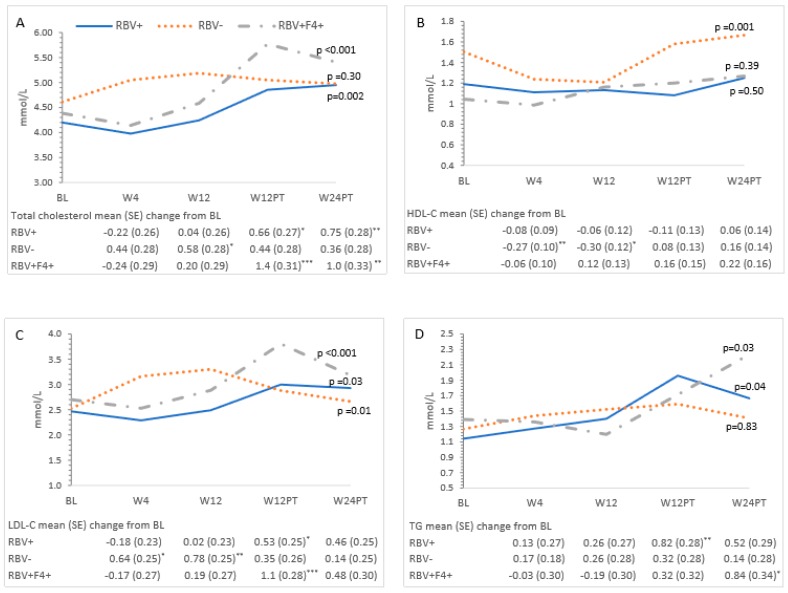
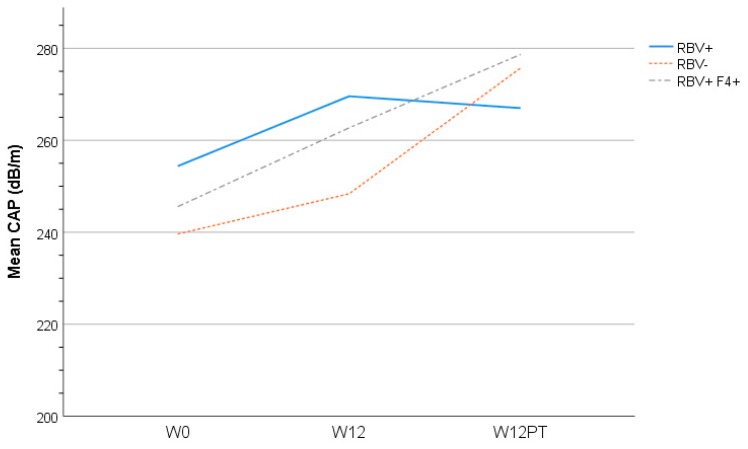
Chronic hepatitis C (HCV) infection perturbs lipid and glucose metabolism. The influenceof direct acting antiviral (DAA) treatment and ribavirin on these measures was evaluated.Furthermore, the effect of HCV cure on these parameters was assessed. Participants were allocatedto one of three 12-week treatment groups: non-cirrhotic genotype 1aparitaprevir/ritonavir/ombitasvir/dasabuvir (PrOD) plus ribavirin; non-cirrhotic 1b-PrOD;compensated cirrhotic 1a or 1b-PrOD plus ribavirin. Fasting insulin, glucose, lipid andapolipoprotein measures were assessed at baseline, Treatment Weeks 4 and 12, and 12 and 24 weekspost-dosing. Twenty-three of 24 participants achieved SVR (PP= 23/24, 96% SVR). Overall, totalcholesterol, low-density lipoprotein cholesterol (LDL-C), and triglyceride levels all increased intreatment and post-dosing. However, LDL-C levels decreased during treatment in ribavirinrecipients. Fasting glucose, insulin, and HOMA-IR were unchanged during treatment and 12 weekspost-treatment. By 12 weeks post-treatment, controlled attenuation parameter (CAP) scores, ameasure of steatosis, increased from baseline (mean 30.3 ± 63.5, p = 0.05). This regimen was safe andhighly effective and did not influence glucose metabolism. Ribavirin exposure may mitigate someon-treatment lipid changes. Further mechanistic studies are needed to understand how ribavirinimpacts lipid pathways, as there could be therapeutic implications. The metabolic pathophysiologyof increased CAP score with HCV treatment requires explanation.

Keywords: antiviral therapy; cirrhosis; insulin resistance; lipid metabolism; viral hepatitis.


Conflict of interest statement

The authors declare no conflict of interest.

Figures

Figure 1
Figure 1
Homeostatic Model Assessment—Insulin Resistance (HOMA-IR) at each study time point (baseline, Week 4 of treatment, end of treatment at Week 12, 12 weeks after treatment completion, and 24 weeks after treatment completion) for each participant by treatment group (RBV+ = ribavirin containing hepatitis C (HCV) treatment in participants without cirrhosis, RBV− = ribavirin free HCV treatment in participants without cirrhosis, RBV+F4+ = ribavirin containing HCV treatment in participants with cirrhosis).
Figure 2
Figure 2
Changes in glucose measures over time and mean changes compared to baseline. (A) HOMA-IR, (B) insulin, (C) glucose, and (D) HbA1c. The estimated mean and the mean change from baseline at each study time point is from a linear mixed model adjusted for group, and the baseline BMI and their interaction with time is from a linear mixed model with a random effect for participant. HbA1c was adjusted for the effect of hemoglobin. All p-values were determined by the linear mixed model for the effect of time and group at each time point. Significant mean changes in the glucose measures compared to baseline at the p < 0.05 significance level were denoted by (*), p < 0.01 by (**), and p < 0.001 by (***). Missing data: baseline: HbA1c (n = 1); Week 4 (W4): HbA1c (n = 1); Week 12 (W12): insulin/HOMA-IR (n = 1), HbA1c (n = 3); 12 weeks after treatment (W12PT): glucose/HOMA-IR (n = 3), insulin (n = 2); HbA1c (n = 2); 24 weeks after treatment (W24PT): HOMA-IR (n = 7), insulin (n = 7), glucose (n = 4), HbA1c (n = 4).
Figure 3
Figure 3
Changes in lipid measures over time and mean changes compared to baseline. (A) Total cholesterol, (B) high-density lipoprotein cholesterol (HDL-C), (C) low-density lipoprotein cholesterol (LDL-C), and (D) triglycerides (TG). The estimated mean and the mean change from baseline at each study time point is from a linear mixed model adjusted for group and its interaction with time from a linear mixed model with a random effect for participant. All p-values were determined by the linear mixed model for the effect of time and group at each time point. Significant mean changes in the glucose measures compared to baseline at the p < 0.05 significance level were denoted by (*), p < 0.01 by (**), and p < 0.001 by (***). BL = Baseline; W4 = Week 4 of treatment; W12 = Week 12 of treatment; W12PT = 12 weeks after treatment; W24PT = 24 weeks after treatment. Missing data: W12PT (n = 2) and W24PT (n = 4) for total cholesterol, triglycerides, and HDL-C; W12PT (n = 4) and W24PT (n = 4) for LDL-C.
Figure 4
Figure 4
Changes in Apolipoproteins over time and mean changes compared to baseline. (A) apoA1, (B) apoA1, (C) apoB, (D) apoC2, (E) apoC3, and (F) apoE. The estimated mean and the mean change from baseline at each study time point is from the generalized linear mixed model adjusted for group, and baseline viral load and their interaction with time. All p-values were determined by the generalized linear mixed model for the effect of time and group at each time point. Significant mean changes in the apolipoproteins compared to baseline at the p < 0.05 significance level were denoted by (*), p < 0.01 by (**), and p < 0.001 by (***). ¥ Mean changes expressed as 102. BL = Baseline; W4 = Week 4 of treatment; W12 = Week 12 of treatment; W12PT = 12 weeks after treatment; W24PT = 24 weeks after treatment. Missing data for all apolipoproteins apoA1–E at W12 (n = 1); W12PT (n = 2); W24PT (n = 4).
Figure 5
Figure 5
Mean controlled attenuation parameter (CAP) score at each study time point (baseline, end of treatment at Week 12 (W12), 12 weeks after treatment (W12PT) completion) by treatment grouping (RBV+ = ribavirin containing HCV treatment in participants without cirrhosis; RBV− = ribavirin free HCV treatment in participants without cirrhosis; RBV+F4+ = ribavirin containing HCV treatment in participants with cirrhosis).

Similar articles

Cited by

References

    1. Averhoff F.M., Glass N., Holtzman D. Global burden of hepatitis C: Considerations for healthcare providers in the United States. Clin. Infect. Dis. 2012;55(Suppl. 1):S10–S15. doi: 10.1093/cid/cis361. - DOI - PubMed
    1. Hung C.H., Wang J.H., Hu T.H., Chen C.H., Chang K.C., Yen Y.H., Kuo Y.H., Tsai M.C., Lu S.N., Lee C.M. Insulin resistance is associated with hepatocellular carcinoma in chronic hepatitis C infection. World J. Gastroenterol. 2010;16:2265–2271. doi: 10.3748/wjg.v16.i18.2265. - DOI - PMC - PubMed
    1. Baid S., Cosimi A.B., Farrell M.L., Schoenfeld D.A., Feng S., Chung R.T., Tolkoff-Rubin N., Pascual M. Posttransplant diabetes mellitus in liver transplant recipients: Risk factors, temporal relationship with hepatitis C virus allograft hepatitis, and impact on mortality. Transplantation. 2001;72:1066–1072. doi: 10.1097/00007890-200109270-00015. - DOI - PubMed
    1. Taura N., Ichikawa T., Hamasaki K., Nakao K., Nishimura D., Goto T., Fukuta M., Kawashimo H., Fujimoto M., Kusumoto K., et al. Association between liver fibrosis and insulin sensitivity in chronic hepatitis C patients. Am. J. Gastroenterol. 2006;101:2752–2759. doi: 10.1111/j.1572-0241.2006.00835.x. - DOI - PubMed
    1. Butt A.A., Xiaoqiang W., Budoff M., Leaf D., Kuller L.H., Justice A.C. Hepatitis C virus infection and the risk of coronary disease. Clin. Infect. Dis. 2009;49:225–232. doi: 10.1086/599371. - DOI - PMC - PubMed

Publication types

MeSH terms

LinkOut - more resources