. 2019 Mar 16;20(6):1337.
doi: 10.3390/ijms20061337.

Inhibition of Triple-Negative Breast Cancer Cell Aggressiveness by Cathepsin D Blockage: Role of Annexin A1

Affiliations

Inhibition of Triple-Negative Breast Cancer Cell Aggressiveness by Cathepsin D Blockage: Role of Annexin A1

Mariana Alves Pereira Zóia et al. Int J Mol Sci. .

Abstract

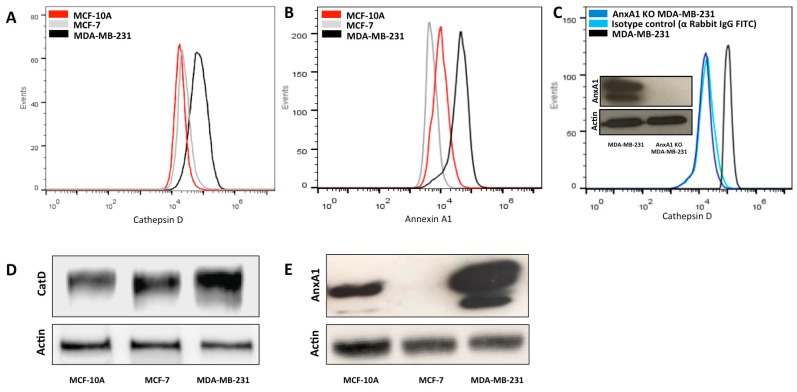
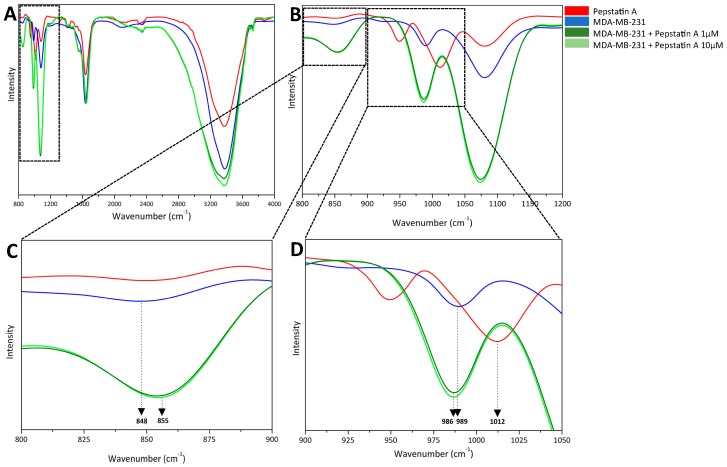
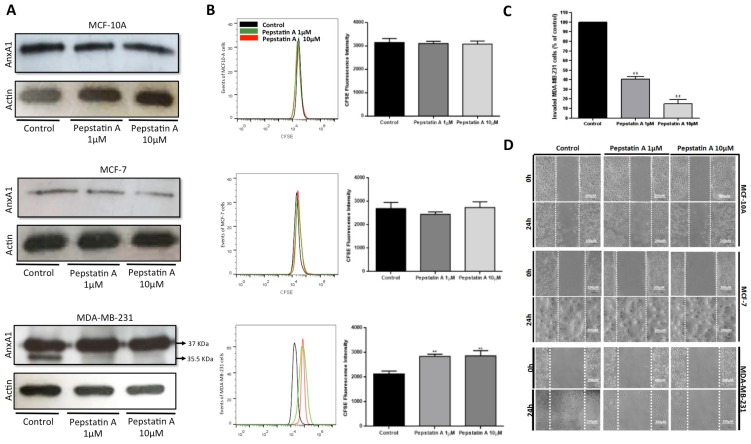
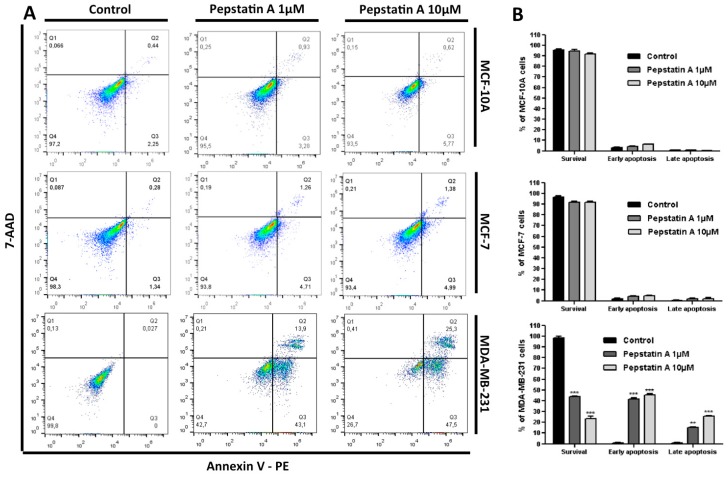
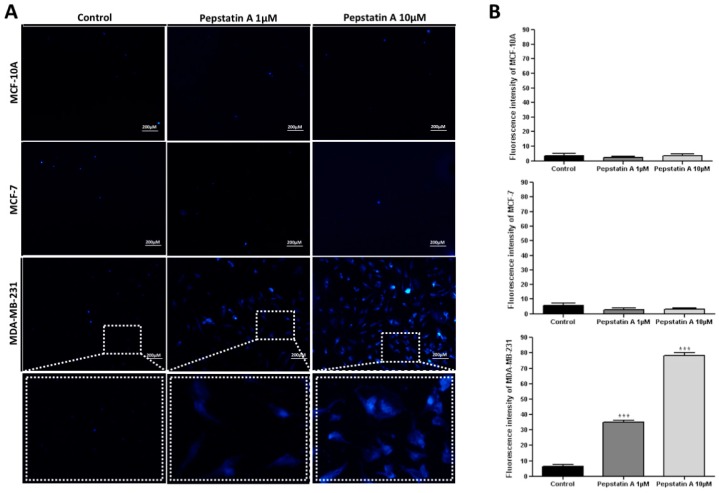
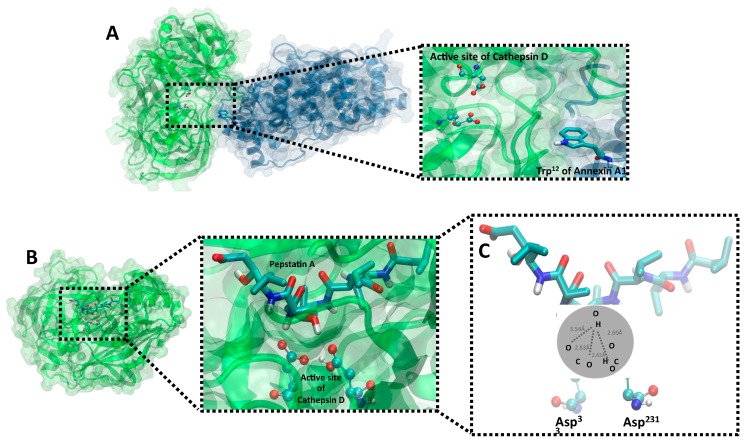
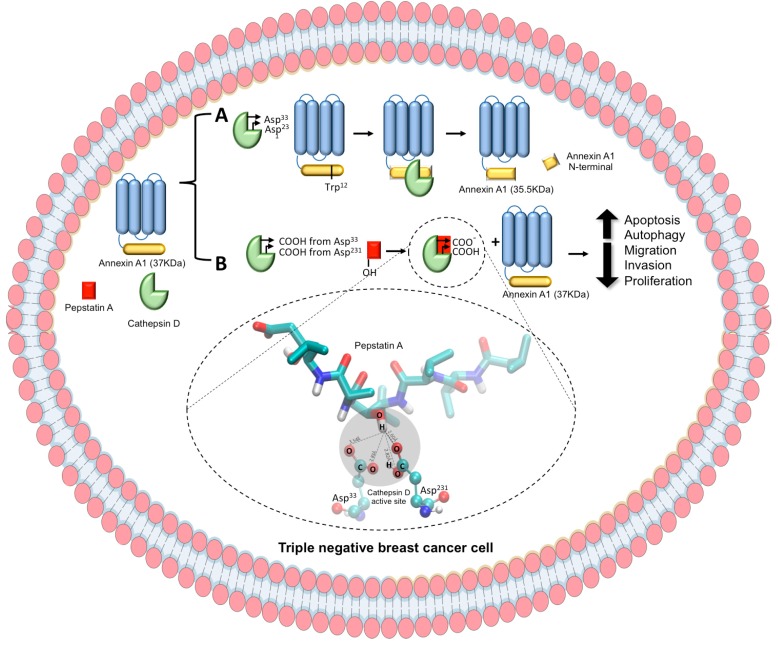
Triple-negative breast cancers (TNBCs) are more aggressive than other breast cancer (BC) subtypes and lack effective therapeutic options. Unraveling marker events of TNBCs may provide new directions for development of strategies for targeted TNBC therapy. Herein, we reported that Annexin A1 (AnxA1) and Cathepsin D (CatD) are highly expressed in MDA-MB-231 (TNBC lineage), compared to MCF-10A and MCF-7. Since the proposed concept was that CatD has protumorigenic activity associated with its ability to cleave AnxA1 (generating a 35.5 KDa fragment), we investigated this mechanism more deeply using the inhibitor of CatD, Pepstatin A (PepA). Fourier Transform Infrared (FTIR) spectroscopy demonstrated that PepA inhibits CatD activity by occupying its active site; the OH bond from PepA interacts with a CO bond from carboxylic acids of CatD catalytic aspartate dyad, favoring the deprotonation of Asp33 and consequently inhibiting CatD. Treatment of MDA-MB-231 cells with PepA induced apoptosis and autophagy processes while reducing the proliferation, invasion, and migration. Finally, in silico molecular docking demonstrated that the catalytic inhibition comprises Asp231 protonated and Asp33 deprotonated, proving all functional results obtained. Our findings elucidated critical CatD activity in TNBC cell trough AnxA1 cleavage, indicating the inhibition of CatD as a possible strategy for TNBC treatment.

Keywords: Annexin A1; Cathepsin D; protease inhibition; triple-negative breast cancer.


Conflict of interest statement

The authors declare no conflict of interest.

Figures

Figure 1
Figure 1
Enhanced expression of CatD in MDA-MB-231 cells is associated with AnxA1 expression. (A) Flow cytometry analysis of CatD overall protein expression in MCF-10A (red peak), MCF-7 (grey peak), and MDA-MB-231 (black peak) cells. (B) Flow cytometry analysis of AnxA1 overall protein expression in MCF-10A (red peak), MCF-7 (grey peak), and MDA-MB-231 (black peak) cells. (C) Flow cytometry analysis of CatD expression in MDA-MB-231 cells having native levels of AnxA1 (black peak), AnxA1 knockdown MDA-MB-231 (dark blue peak) cells in which AnxA1 expression was suppressed, and isotype control anti-Rabbit, IgG FITC (light blue peak). Western blotting analysis of AnxA1 expression of MDA-MB-231 cells having native levels and having complete knockdown of AnxA1 expression. (D) Western blotting analysis of CatD expression of MCF-10A, MCF-7, and MDA-MB-231 cells. Actin was used as loading control. (E) Western blot analysis of AnxA1 expression of MCF-10A, MCF-7, and MDA-MB-231 cells. Actin was used as loading control.
Figure 2
Figure 2
FTIR spectroscopy analysis of atoms involved in CatD inhibition. (A) Fourier transform infrared spectroscopy spectra of PepA (red), cells (blue), and cells treated with PepA (1 µM, light green; 10 µM, dark green) at a range of 800–4000 cm−1. For better visualization, spectra are zoomed in on the following ranges: (B) 800–1200 cm−1, (C) 800–900 cm−1 with dominant bands from OH bending vibration at 848 cm−1 and CO bending vibration at 855 cm−1, both from carboxylic acid from CatD aspartates; and (D) 900–1050 cm−1 with dominant bands at 986 cm−1 and 989 cm−1 from OH bending vibration and 1012 cm−1 from OH angular deformation from PepA molecule structure.
Figure 3
Figure 3
CatD inhibition by PepA impairs proliferation, migration, and invasion of MDA-MB-231. (A) Western blot analysis of AnxA1 expression of cells treated or not treated (control, vehicle only) for 24 h with 1 µM and 10 µM of PepA. Full-length AnxA1 (37 KDa) was detected in all cells and cleaved form (35.5 KDa) was detected only in MDA-MB-231 cells. Actin was used as loading control. (B) Proliferation analysis of MCF-10A, MCF-7, and MDA-MB-231 cells treated with PepA (1 µM, grey peak; and 10 µM, red peak) compared to control group (vehicle only, black peak) using CFSE staining. Respective bar graphs show the CFSE fluorescence intensity and statistical analysis of three independent experiments expressed as means ± SD (**, p < 0.01). (C) Percentage of invaded cells relative to control was measured by Matrigel invasion assay. Graph shows the percentage of invasion of three cell lines and statistical analysis of three independent experiments were expressed as means ± SD (**, p < 0.01). (D) Migration potential was assessed by wound-healing assay. Cells were plated, scratched with pipette tips, and photographed by phase-contrast microscopy. Representative images, showing cells migrated at 0 h and after 24 h. Scale bars = 200 µm.
Figure 4
Figure 4
CatD inhibition induces apoptosis only in MDA-MB-231 cells. (A) The apoptotic fraction of MCF-10A, MCF-7, and MDA-MB-231 cells after 24 h treatment with PepA (1 µM and 10 µM) compared to control (vehicle only) is shown, with numerals in the lower right-hand panel (early apoptosis) and in the upper right-hand panel (late apoptosis). Annexin V and 7-AAD staining were used to assess the basal level of early (Annexin-V-labeled cells) and late apoptosis (Annexin-V- and 7-AAD-labeled cells). (B) PepA induced early and later apoptosis rate shown by histogram. Data are expressed as the mean ± SD of three independent experiments. Asterisks indicate significant difference from control group (** p < 0.01; *** p < 0.001). Comparisons between different groups were performed using one-way analysis of variance.
Figure 5
Figure 5
CatD inhibition promotes MDC-labeled autophagic vacuoles formation only in MDA-MB-231 cells. (A) Autophagic vacuoles (blue) in MCF-10A, MCF-7, and MDA-MB-231 cells stained with MDC after exposure to PepA (1 µM and 10 µM) for 24 h compared to control group (vehicle only). Dashed rectangle demonstrates the zoom view of each cell group. Scale bars = 200 µm. (B) Histogram representing fluorescence intensity of MDC, determined by ImageJ software, in control and treated three cell lines. Data are expressed as the mean ± SD of three independent determinations, n = 15. Asterisks (*) indicate significant difference from control group (* p < 0.05; ** p < 0.01; *** p < 0.001). Comparisons between different groups were performed using one-way analysis of variance.
Figure 6
Figure 6
Molecular models of CatD/AnxA1 and CatD/PepA complexes. (A) Protein–protein docking of AnxA1 (blue) and CatD (green) interaction highlighting through dashed rectangle, on the zoom view, the active site (ball-and-stick model) of protease nearby AnxA1 Trp12 (licorice model). (B) A protein–ligand docking of CatD and PepA. A zoomed-in image, indicated by dashed lines, focusing on active site of CatD (ball-and-stick model) blocked by PepA (licorice model) is shown. All proteins are represented in cartoon model, whose spirals are alpha-helices and strips with arrows show beta-sheets, and transparent surface indicates the interface region. (C) A zoomed-in image at a different angle for better demonstration evidencing binding interactions in the PepA and CatD structure. OH of PepA has a hydrogen bond interaction with carboxylic acid of Asp33 and Asp231 (active site of CatD) with contact approximated distances of 3.54 Å, 2.83 Å, 2.832 Å, and 2.60 Å. Ball-and-stick and licorice models are colored by atom (nitrogen, dark blue; oxygen, red; hydrogen, white; carbon, light blue).
Figure 7
Figure 7
Schematic representation of CatD activity and inhibition by PepA and its in vitro consequences in TNBC cell. CatD is presented as a green generic representation, PepA, red square, and AnxA1 is presented as a core domain (blue) and an N-terminal domain (yellow). (A) On the one hand, CatD (with Asp33 and Asp231 from active site) cleaves AnxA1 at Trp12 to yield 35.5 KDa fragment. (B) On the other hand, OH from PepA interacts with carboxylic acids from Asp33 and Asp231 from CatD active sites, blocking CatD protease activity. Then, AnxA1 remains intact (37 KDa), leading to a decrease of MDA-MB-231 aggressiveness, which includes increase of apoptosis and autophagy process and decrease of migration, invasion, and proliferation rates.

References

    1. The Lancet Oncology New interventions offer prostate cancer hope. Lancet Oncol. 2018;19:427. doi: 10.1016/S1470-2045(18)30219-5. - DOI - PubMed
    1. Wyatt A.W., Mo F., Wang Y., Collins C.C. The diverse heterogeneity of molecular alterations in prostate cancer identified through next-generation sequencing. Asian J. Androl. 2013;15:301–308. doi: 10.1038/aja.2013.13. - DOI - PMC - PubMed
    1. Sharma S., Zapatero-Rodriguez J., O’Kennedy R. Prostate cancer diagnostics: Clinical challenges and the ongoing need for disruptive and effective diagnostic tools. Biotechnol. Adv. 2017;35:135–149. doi: 10.1016/j.biotechadv.2016.11.009. - DOI - PubMed
    1. Kadoch C., Crabtree G.R. Mammalian SWI/SNF chromatin remodeling complexes and cancer: Mechanistic insights gained from human genomics. Sci. Adv. 2015;1:e1500447. doi: 10.1126/sciadv.1500447. - DOI - PMC - PubMed
    1. Lu C., Allis C.D. SWI/SNF complex in cancer. Nat. Genet. 2017;49:178–179. doi: 10.1038/ng.3779. - DOI - PMC - PubMed

MeSH terms