

Locus-specific DNA methylation prediction in cord blood and placenta
- PMID: 30885044
- PMCID: PMC6557556
- DOI: 10.1080/15592294.2019.1588685
Locus-specific DNA methylation prediction in cord blood and placenta
Abstract
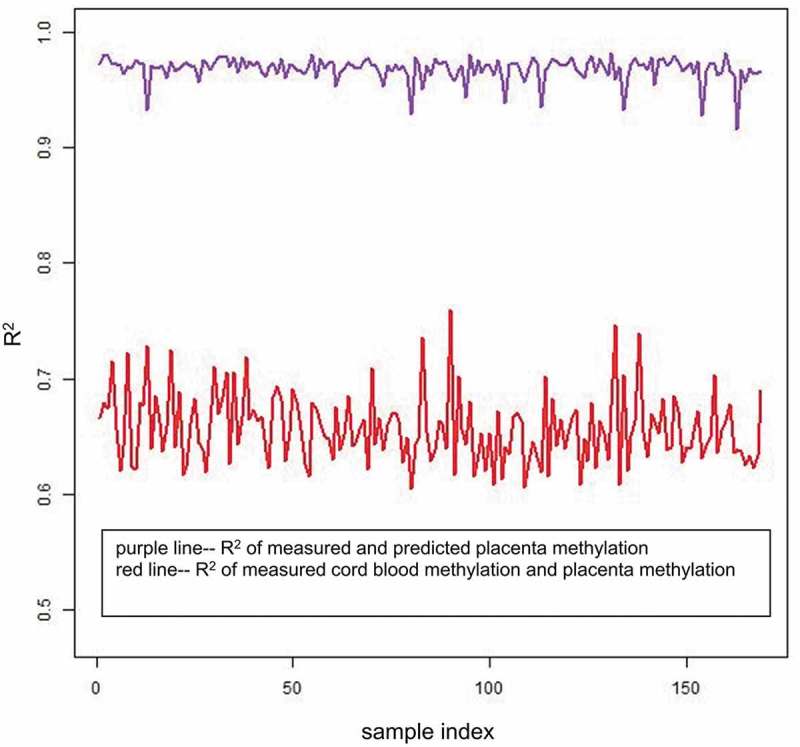
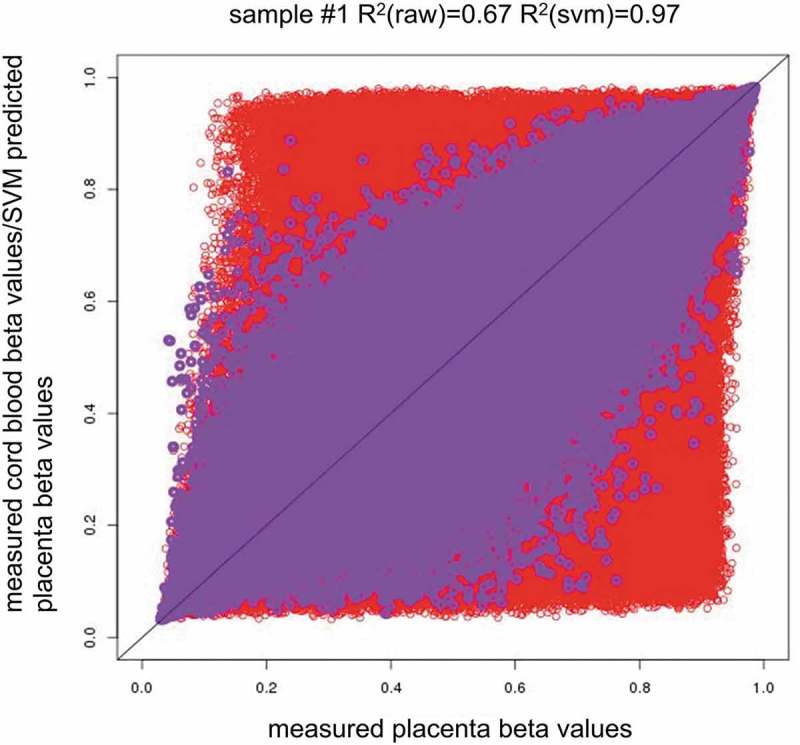
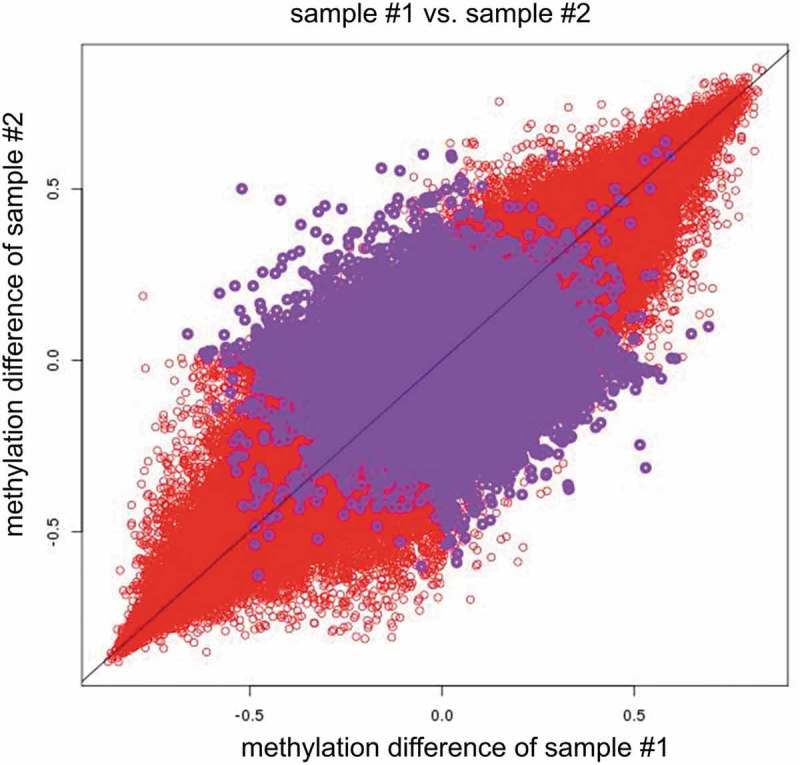
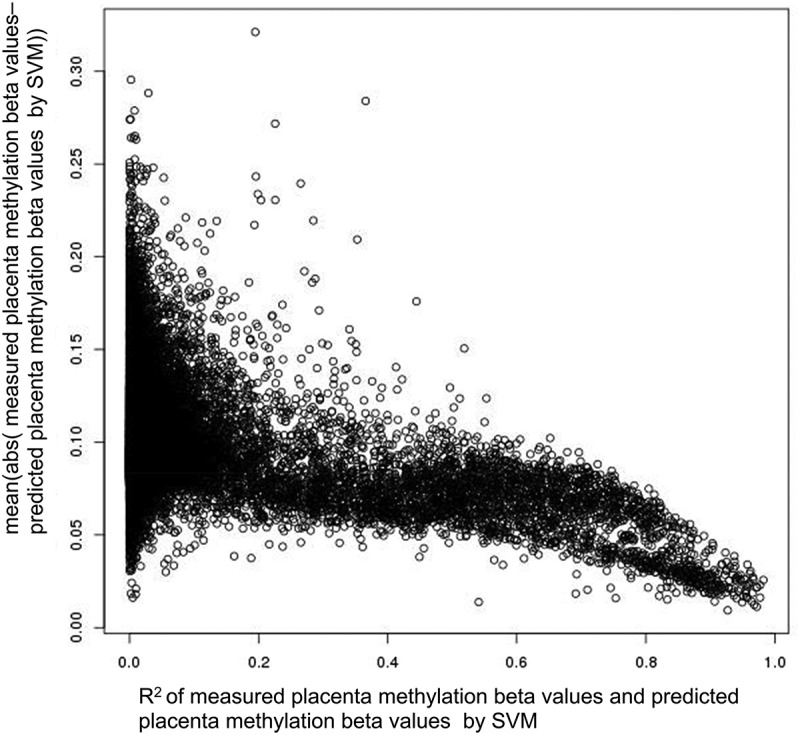
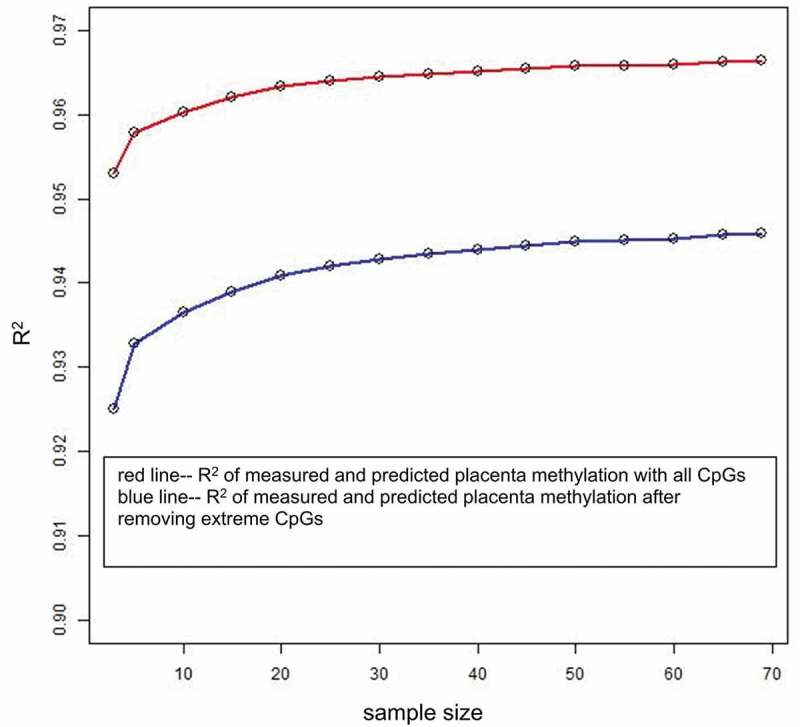
DNA methylation is known to be responsive to prenatal exposures, which may be a part of the mechanism linking early developmental exposures to future chronic diseases. Many studies use blood to measure DNA methylation, yet we know that DNA methylation is tissue specific. Placenta is central to fetal growth and development, but it is rarely feasible to collect this tissue in large epidemiological studies; on the other hand, cord blood samples are more accessible. In this study, based on paired samples of both placenta and cord blood tissues from 169 individuals, we investigated the methylation concordance between placenta and cord blood. We then employed a machine-learning-based model to predict locus-specific DNA methylation levels in placenta using DNA methylation levels in cord blood. We found that methylation correlation between placenta and cord blood is lower than other tissue pairs, consistent with existing observations that placenta methylation has a distinct pattern. Nonetheless, there are still a number of CpG sites showing robust association between the two tissues. We built prediction models for placenta methylation based on cord blood data and documented a subset of 1,012 CpG sites with high correlation between measured and predicted placenta methylation levels. The resulting list of CpG sites and prediction models could help to reveal the loci where internal or external influences may affect DNA methylation in both placenta and cord blood, and provide a reference data to predict the effects on placenta in future study even when the tissue is not available in an epidemiological study.
Keywords: DNA methylation; cord blood; illumina humanmethylation 450; machine learning; placenta.
Figures
Similar articles
-
Epigenetic signatures of maternal-fetal health: insights from cord blood and placenta.Epigenetics. 2025 Dec;20(1):2508067. doi: 10.1080/15592294.2025.2508067. Epub 2025 May 23. Epigenetics. 2025. PMID: 40405669 Free PMC article.
-
Epigenome-wide cross-tissue predictive modeling and comparison of cord blood and placental methylation in a birth cohort.Epigenomics. 2017 Mar;9(3):231-240. doi: 10.2217/epi-2016-0109. Epub 2017 Feb 17. Epigenomics. 2017. PMID: 28234020 Free PMC article.
-
Comparison of DNA methylation profiles associated with spontaneous preterm birth in placenta and cord blood.BMC Med Genomics. 2019 Jan 3;12(1):1. doi: 10.1186/s12920-018-0466-3. BMC Med Genomics. 2019. PMID: 30606219 Free PMC article.
-
Tissue differences in DNA methylation changes at AHRR in full term low birth weight in maternal blood, placenta and cord blood in Chinese.Placenta. 2017 Apr;52:49-57. doi: 10.1016/j.placenta.2017.02.017. Epub 2017 Feb 17. Placenta. 2017. PMID: 28454697
-
Exposure to Gestational Diabetes Mellitus (GDM) alters DNA methylation in placenta and fetal cord blood.Diabetes Res Clin Pract. 2021 Apr;174:108690. doi: 10.1016/j.diabres.2021.108690. Epub 2021 Feb 5. Diabetes Res Clin Pract. 2021. PMID: 33549677
Cited by
-
Probing prenatal bisphenol exposures and tissue-specific DNA methylation responses in cord blood, cord tissue, and placenta.Reprod Toxicol. 2023 Jan;115:74-84. doi: 10.1016/j.reprotox.2022.11.005. Epub 2022 Dec 5. Reprod Toxicol. 2023. PMID: 36473650 Free PMC article.
-
Epigenetic signatures of maternal-fetal health: insights from cord blood and placenta.Epigenetics. 2025 Dec;20(1):2508067. doi: 10.1080/15592294.2025.2508067. Epub 2025 May 23. Epigenetics. 2025. PMID: 40405669 Free PMC article.
-
Prenatal medication exposure and epigenetic outcomes: a systematic literature review and recommendations for prenatal pharmacoepigenetic studies.Epigenetics. 2022 Apr;17(4):357-380. doi: 10.1080/15592294.2021.1903376. Epub 2021 Apr 29. Epigenetics. 2022. PMID: 33926354 Free PMC article.
-
Periconception and Prenatal Exposure to Maternal Perceived Stress and Cord Blood DNA Methylation.Epigenet Insights. 2022 Feb 26;15:25168657221082045. doi: 10.1177/25168657221082045. eCollection 2022. Epigenet Insights. 2022. PMID: 35237744 Free PMC article.
-
The effect of blastomere loss during frozen embryo transfer on the transcriptome of offspring's umbilical cord blood.Mol Biol Rep. 2020 Nov;47(11):8407-8417. doi: 10.1007/s11033-020-05878-6. Epub 2020 Oct 17. Mol Biol Rep. 2020. PMID: 33068229
References
-
- Bird A. DNA methylation patterns and epigenetic memory. Genes Dev. 2002;16:6–21. - PubMed
-
- Laufer BI, Kapalanga J, Castellani CA, et al. Associative DNA methylation changes in children with prenatal alcohol exposure. Epigenomics-Uk. 2015;7:1259–1274. - PubMed
-
- Wang IJ, Chen SL, Lu TP, et al. Prenatal smoke exposure, DNA methylation, and childhood atopic dermatitis. Clin Exp Allergy. 2013;43:535–543. - PubMed
Publication types
MeSH terms
Grants and funding
LinkOut - more resources
Full Text Sources
Other Literature Sources