. 2019 Jul:127:287-302.
doi: 10.1016/j.nbd.2019.03.012. Epub 2019 Mar 15.

Hyperhomocysteinemia leads to exacerbation of ischemic brain damage: Role of GluN2A NMDA receptors

Affiliations

Hyperhomocysteinemia leads to exacerbation of ischemic brain damage: Role of GluN2A NMDA receptors

Ankur Jindal et al. Neurobiol Dis. 2019 Jul.

Abstract

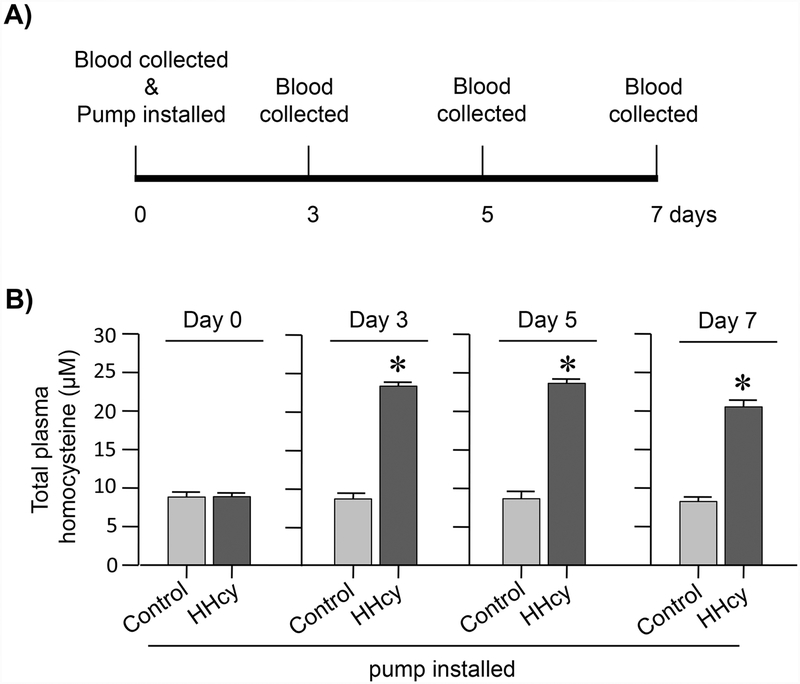
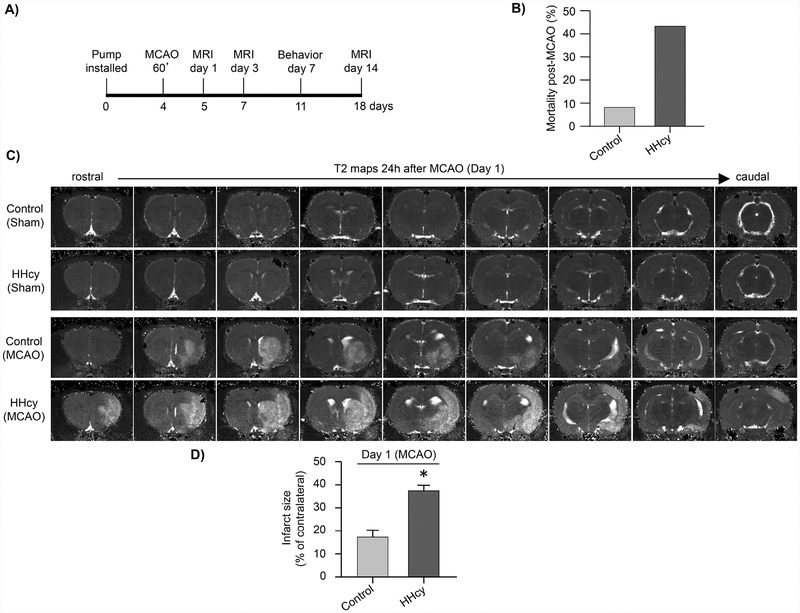
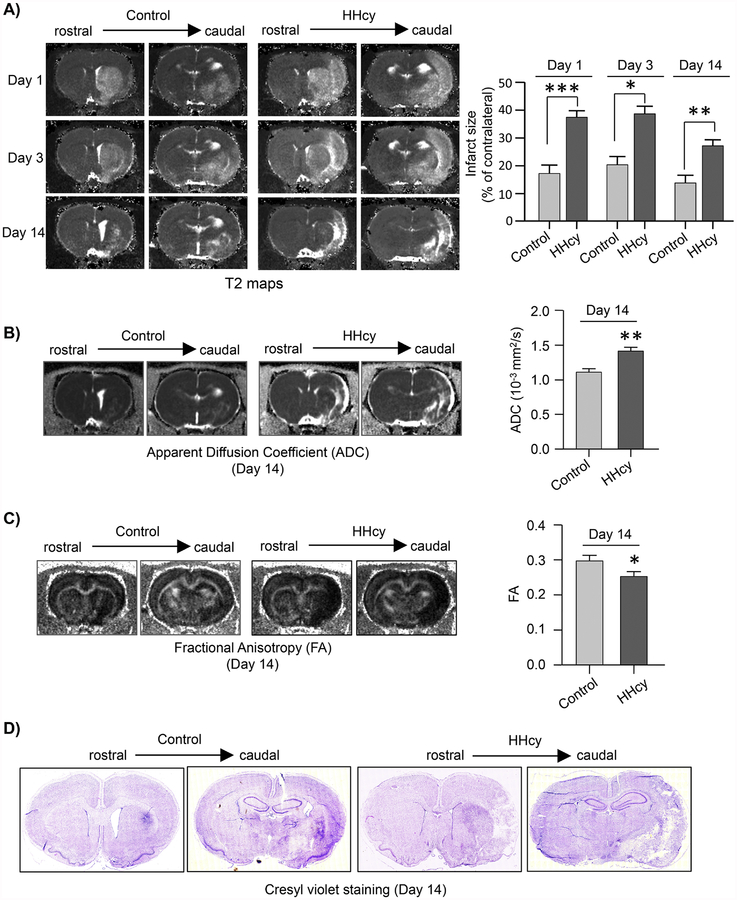
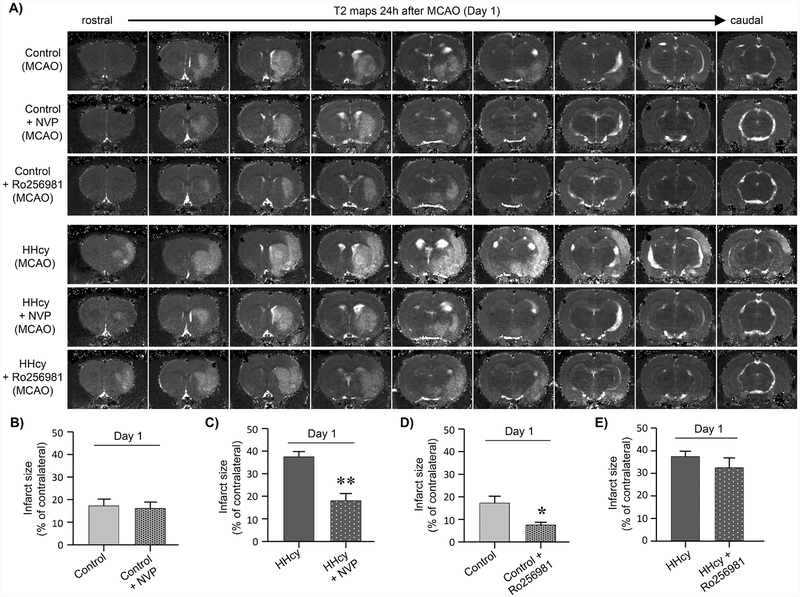
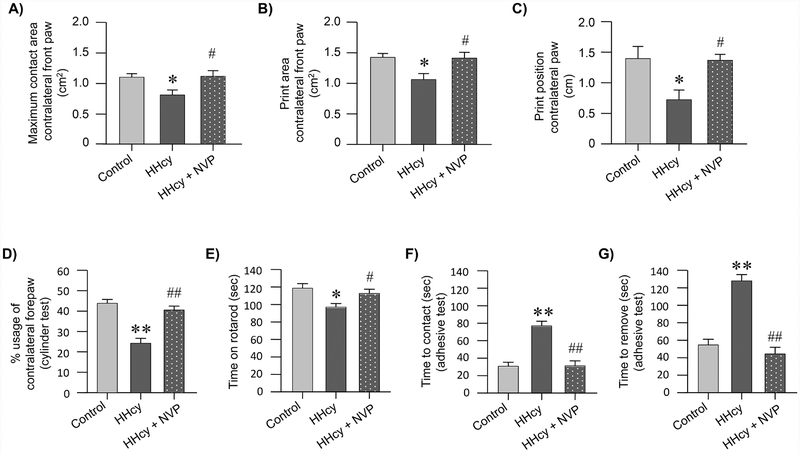
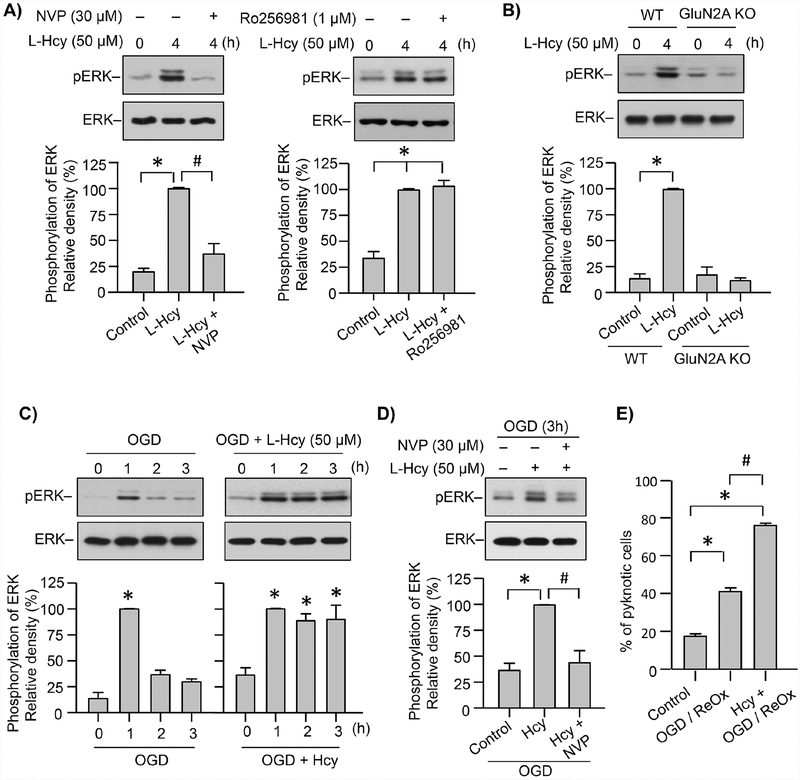
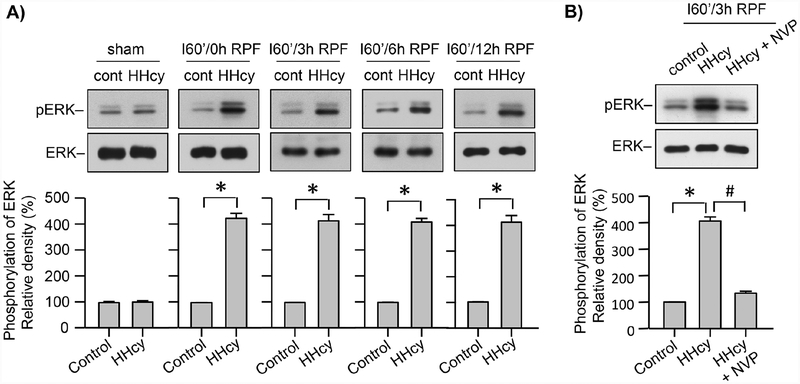
Hyperhomocysteinemia has been implicated in several neurodegenerative disorders including ischemic stroke. However, the pathological consequences of ischemic insult in individuals predisposed to hyperhomocysteinemia and the associated etiology are unknown. In this study, we evaluated the outcome of transient ischemic stroke in a rodent model of hyperhomocysteinemia, developed by subcutaneous implantation of osmotic pumps containing L-homocysteine into male Wistar rats. Our findings show a 42.3% mortality rate in hyperhomocysteinemic rats as compared to 7.7% in control rats. Magnetic resonance imaging of the brain in the surviving rats shows that mild hyperhomocysteinemia leads to exacerbation of ischemic injury within 24 h, which remains elevated over time. Behavioral studies further demonstrate significant deficit in sensorimotor functions in hyperhomocysteinemic rats compared to control rats. Using pharmacological inhibitors targeting the NMDAR subtypes, the study further demonstrates that inhibition of GluN2A-containing NMDARs significantly reduces ischemic brain damage in hyperhomocysteinemic rats but not in control rats, indicating that hyperhomocysteinemia-mediated exacerbation of ischemic brain injury involves GluN2A-NMDAR signaling. Complementary studies in GluN2A-knockout mice show that in the absence of GluN2A-NMDARs, hyperhomocysteinemia-associated exacerbation of ischemic brain injury is blocked, confirming that GluN2A-NMDAR activation is a critical determinant of the severity of ischemic damage under hyperhomocysteinemic conditions. Furthermore, at the molecular level we observe GluN2A-NMDAR dependent sustained increase in ERK MAPK phosphorylation under hyperhomocysteinemic condition that has been shown to be involved in homocysteine-induced neurotoxicity. Taken together, the findings show that hyperhomocysteinemia triggers a unique signaling pathway that in conjunction with ischemia-induced pathways enhance the pathology of stroke under hyperhomocysteinemic conditions.

Keywords: Behavioral studies; ERK MAPK; GluN2A-NMDA receptor knockout mice; GluN2A-NMDA receptors (also known as NR2A-NMDA receptors); GluN2B-NMDA receptors (also known as NR2B-NMDA receptors); Hyperhomocysteinemia; Ischemic brain injury; Magnetic resonance imaging; Middle cerebral artery occlusion.


Conflict of interest statement

CONFLICT OF INTEREST:

The authors declare no competing financial interests.

Figures

Figure 1.
Figure 1.. Evaluation of total plasma homocysteine levels in hyperhomocysteinemic rats by HPLC.
(A) Schematic representation of the timeline of implantation of saline or homocysteine containing osmotic pumps and blood collection. (B) Quantitative analysis of total plasma homocysteine levels in rats implanted with saline (control) or homocysteine (HHcy) pumps, before (0 day) and after (3, 5 and 7 days) pump implantation. Values expressed as mean ± SEM (control: n = 4–9, HHcy: n = 7–10). *p < 0.0001 for control vs. HHcy rats.
Figure 2.
Figure 2.. Exacerbation of ischemic brain damage in hyperhomocysteinemic rats at 24h post-occlusion evaluated from T2 maps.
(A) Schematic representation of the timeline of implantation of osmotic pumps, MCAO, MRI scans and behavioral assessments. (B) Quantitative analysis of stroke mortality rate (%) in control and hyperhomocysteinemic (HHcy) rats. (C) Representative T2 maps acquired from sham control and HHcy rats, as well as control and HHcy rats subjected to MCAO (60 min) and reperfusion (24h). (D) Quantitative analysis of ischemic lesion volume in control and HHcy rats subjected to ischemic insult and reperfusion, expressed as mean ± SEM (control: n = 11, HHcy: n = 15); *p < 0.0001 for control vs. HHcy rats.
Figure 3.
Figure 3.. Temporal evolution of ischemic brain damage in hyperhomocysteinemic rats evaluated from T2, ADC and FA maps.
(A) Representative T2 maps from days 1, 3 and 14 after MCAO, acquired from control and hyperhomocysteinemic rats (HHcy) showing changes in ischemic lesion size from rostral to caudal regions of the brain. Corresponding bar diagram provide quantitative analysis of total infarct volume, expressed as mean ± SEM (on day 1 and 3 - control: n = 11, HHcy: n = 15; on day 14 - control: n = 10, HHcy: n = 14). (B) Representative ADC maps acquired from control and HHcy rats at day 14 post-MCAO featuring hyperintense areas that co-loacalize with the lesion area in the T2 maps at day 14 post-MCAO. Quantitative analysis of ADC values in the lesion area, expressed as mean ± SEM (control: n = 10, HHcy: n = 14). (C) Representative FA maps acquired from the same slices as ADC and T2 maps at 14 days post-MCAO as well as quantitative analysis of FA values expressed as mean ± SEM (control: n = 10, HHcy: n = 14). (D) Representative cresyl violet stained images of rostral and caudal regions of the brain from control and HHcy rats 14 days after MCAO. *p < 0.05, **p < 0.01 and ***p < 0.001 for control vs. HHcy rats.
Figure 4.
Figure 4.. Pharmacological inhibition of GluN2A-NMDAR with NVP-AAM077 attenuates hyperhomocysteinemia-induced exacerbation of ischemic brain damage.
(A) Representative T2 maps at 24h post-MCAO acquired from control and hyperhomocysteinemic (HHcy) rats treated with vehicle, NVP-AAM077 (NVP) or Ro 256981 at the onset of the ischemic insult. (B - D) Quantitative analysis of total infarct volume in (B, D) control rats treated with NVP or Ro 256981; and (C, E) HHcy rats treated with NVP or Ro 256981. Values are expressed as mean ± SEM (control: n = 11, control + NVP: n = 12, vehicle + Ro 256981: n = 10, HHcy: n = 15, HHcy + NVP: n = 11, HHcy + Ro256981: n = 7). *p < 0.005 for control vs. control + Ro 256981 treated rats and **p < 0.001 for HHcy vs. HHcy + NVP treated rats.
Figure 5.
Figure 5.. Effect of GluN2A-NMDARs inhibition on the progression of ischemic brain damage in hyperhomocysteinemic rats.
(A) Representative T2 maps from days 1, 3 and 14 after MCAO, acquired from hyperhomocysteinemic rats treated with vehicle (HHcy) or NVPAAM077 (HHcy + NVP), showing changes in ischemic lesion size from rostral to caudal regions of the brain. Corresponding bar diagram provide quantitative analysis of total infarct volume, expressed as mean ± SEM (on days 1 and 3 - HHcy: n = 15; on day 14 - HHcy: n = 14; on days 1, 3 and 14 - HHcy + NVP: n = 11). (B) Representative ADC maps acquired from HHcy and HHcy + NVP treated rats at day 14 post-MCAO, featuring hyperintense areas that co-loacalize with the lesion area in the T2 maps at day 14 post-MCAO. Quantitative analysis of ADC values in the lesion area, expressed as mean ± SEM (HHcy: n = 14, HHcy + NVP: n = 10). (C) Representative FA maps acquired from the same slices as ADC and T2 maps at 14 days post-MCAO as well as quantitative analysis of FA values expressed as mean ± SEM (HHcy: n = 14, HHcy + NVP: n = 10). *p < 0.01, **p < 0.005 and ***p < 0.001 for HHCy vs. HHcy + NVP treated rats.
Figure 6.
Figure 6.. Effect of GluN2A-NMDAR inhibition on ischemia-induced normal gait impairment, motor coordination and sensorimotor deficit in hyperhomocysteinemic rats.
(A-G) Control, hyperhomocysteinemic (HHcy) and hyperhomocysteinemic rats treated with GluN2A-NMDAR inhibitor NVP-AAM077 (HHcy + NVP) were subjected to MCAO followed by reperfusion. Quantitative analysis of (A) Maximum contact area (mm2); (B) Print area (mm2) and (C) Print position (cm) in the affected forepaw (contralateral) assessed by CatWalk 7 days after MCAO (control: n = 11, HHcy: n = 14, HHcy + NVP: n = 11). Quantitative analysis of (D) spontaneous contralateral forelimb use assessed using cylinder test (day 8 post MCAO; control: n = 7, HHcy: n = 14, HHcy + NVP: n = 11); (E) motor impairment and balance assessed using the rotarod test (day 8 post MCAO; control: n = 12, HHcy: n = 14, HHcy + NVP: n = 11); (F, G) mean latency to detect (F) and remove (G) an adhesive label from the contralateral forepaw (time in seconds) assessed as a measure of sensorimotor function (day 9 post MCAO; control: n = 12, HHcy: n = 15, HHcy + NVP: n = 11). All data are expressed as mean ± SEM; *p < 0.05 and **p < 0.001 for control vs. HHcy rats; and #p < 0.05 and ##p < 0.001 for HHcy vs. HHcy + NVP treated rats.
Figure 7.
Figure 7.. Effect of GluN2A-NMDAR gene deletion on the exacerbation of ischemic brain damage in hyperhomocysteinemic mice.
(A) Schematic representation of the timeline of blood collection following implantation of osmotic pump, MCAO, reperfusion and MRI scan in wild-type (WT) and GluN2A-KO mice. (B) Quantitative analysis of total plasma homocysteine level in WT and hyperhomocysteinemic (HHcy) mice before (0 day) and after (3 and 5 days) implantation of pump. Values are expressed as mean ± SEM (n = 3–5 / group); (C) Representative photomicrographs of T2 maps acquired from control-WT, HHcy-WT, control-GluN2A-KO and HHcy-GluN2A-KO mice following MCAO (30 min) and reperfusion (24h). (D) Quantitative analysis of total infarct volume in WT (control and HHcy) and GluN2A-KO (control or HHcy) mice. Values are expressed as mean ± SEM (control-WT: n = 8, HHcy-WT: n = 5, control-GluN2A-KO: n = 3, HHcy-GluN2A-KO: n = 3). *p < 0.01 for WT mice day 0 vs. WT mice day 3 or 5; #p < 0.01 for GluN2A-KO mice day 0 vs. GluN2A-KO mice day 3 or 5. **p < 0.001 for control-WT vs. HHcy-WT mice.
Figure 8.
Figure 8.. Role of GluN2A-NMDAR in neuronal ERK MAPK phosphorylation and cell death following OGD in the presence of L-homocysteine.
(A) Neuron cultures from embryonic rat brain were treated with 50 μM L-homocysteine (L-Hcy) for 4h in the absence or presence of NVP-AAM077 (30 nM, left panel) or Ro 25–6981 (1 μM, right panel). (B) Neuron cultures from WT and GluN2A KO mice embryonic brain were treated with 50 μM L-Hcy for 4h. (C - E) Neuron cultures from embryonic rat brain were exposed to (C) OGD for specified time periods in the absence (left panel) or presence of L-Hcy (50 μM, right panel); (D) OGD, OGD in the presence of L-Hcy (50 μM) or OGD in the presence of L-Hcy and NVP-AAM077 (30 nM) for 3h; (E) OGD or OGD in the presence of L-Hcy (50 μM) for 2h, followed by reoxygenation (ReOx) for 22h. (A-D) Immunblot analysis of neuronal lysates using anti-phospho ERK MAPK antibody (pERK) and then reprobed with anti-ERK MAPK antibody (ERK). The extent of ERK MAPK phosphorylation was quantified using computer-assisted densitometry and Image J analysis. Values are mean ± SEM (n = 5). (A, C, D) *p < 0.001 from control and #p < 0.001 from 4 hr homocysteine treatment; (B) *p < 0.001 from corresponding controls of WT and GluN2A-NMDAR KO cultures. (E) Quantitative analysis of percentage of neurons with pyknotic nuclei following Hoechst DNA staining. Values are mean ± SEM (n = 1500 cells / condition from 4 experiments). *p < 0.001 from control and #p < 0.001 from OGD/ReOx.
Figure 9.
Figure 9.. Role of GluN2A-NMDAR in ERK MAPK phosphorylation in hyperhomocysteinemic rats following MCAO
(A) Control and hyperhomocysteinemic (HHcy) rats were subjected to MCAO for 60 min followed by reperfusion for the specified time periods (sham, 0, 3, 6, 12h). (B) Control, HHcy and HHcy rats treated with NVP-AAM077 (HHcy + NVP) were subjected to MCAO for 60 min followed by reperfusion for 3h. (A, B) Cortical tissue lysates from the ipsilateral hemisphere were analyzed by immunoblotting using anti-pERK and anti-ERK antibodies. The extent of ERK MAPK phosphorylation was quantified using computer-assisted densitometry and Image J analysis. Values are mean ± SEM (n = 5). *p < 0.001 from corresponding control; and #p < 0.001 from HHcy.

Similar articles

Cited by

References

    1. Auberson YP, et al., 2002. 5-Phosphonomethylquinoxalinediones as competitive NMDA receptor antagonists with a preference for the human 1A/2A, rather than 1A/2B receptor composition. Bioorg Med Chem Lett. 12, 1099–102. - PubMed
    1. Austin RC, et al., 2004. Role of hyperhomocysteinemia in endothelial dysfunction and atherothrombotic disease. Cell Death Differ. 11 Suppl 1, S56–64. - PubMed
    1. Balkaya M, et al., 2013. Assessing post-stroke behavior in mouse models of focal ischemia. J Cereb Blood Flow Metab. 33, 330–8. - PMC - PubMed
    1. Barria A, Malinow R, 2002. Subunit-specific NMDA receptor trafficking to synapses. Neuron. 35, 345–53. - PubMed
    1. Bouet V, et al., 2009. The adhesive removal test: a sensitive method to assess sensorimotor deficits in mice. Nat Protoc. 4, 1560–4. - PubMed

Publication types

MeSH terms

Substances