

Functional characterization and optimization of a bacterial cyclic nucleotide-gated channel
- PMID: 30885945
- PMCID: PMC6509488
- DOI: 10.1074/jbc.RA119.007699
Functional characterization and optimization of a bacterial cyclic nucleotide-gated channel
Abstract
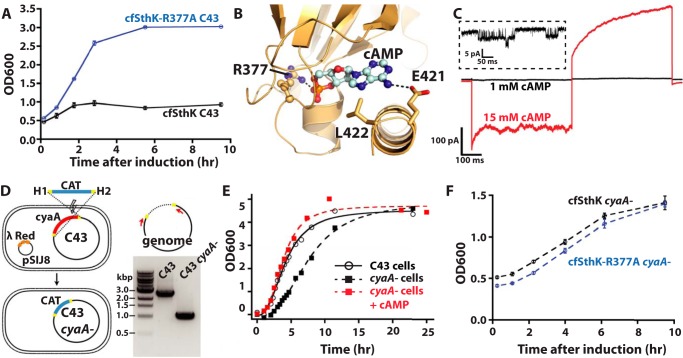
Cyclic nucleotide-gated (CNG) channels produce the initial electrical signal in mammalian vision and olfaction. They open in response to direct binding of cyclic nucleotide (cAMP or cGMP) to a cytoplasmic region of the channel. However, the conformational rearrangements occurring upon binding to produce pore opening (i.e. gating) are not well understood. SthK is a bacterial CNG channel that has the potential to serve as an ideal model for structure-function studies of gating but is currently limited by its toxicity, native cysteines, and low open probability (Po). Here, we expressed SthK in giant Escherichia coli spheroplasts and performed patch-clamp recordings to characterize SthK gating in a bacterial membrane. We demonstrated that the Po in cAMP is higher than has been previously published and that cGMP acts as a weak partial SthK agonist. Additionally, we determined that SthK expression is toxic to E. coli because of gating by cytoplasmic cAMP. We overcame this toxicity by developing an adenylate cyclase-knockout E. coli cell line. Finally, we generated a cysteine-free SthK construct and introduced mutations that further increase the Po in cAMP. We propose that this SthK model will help elucidate the gating mechanism of CNG channels.
Keywords: allosteric regulation; allostery; bacteria; channel activation; cyclic nucleotide; cyclic nucleotide gating; electrophysiology; potassium channel; prokaryotic ion channel; voltage-gated ion channel.
© 2019 Morgan et al.
Conflict of interest statement
The authors declare that they have no conflicts of interest with the contents of this article
Figures


Similar articles
-
Allosteric conformational change of a cyclic nucleotide-gated ion channel revealed by DEER spectroscopy.Proc Natl Acad Sci U S A. 2020 May 19;117(20):10839-10847. doi: 10.1073/pnas.1916375117. Epub 2020 May 1. Proc Natl Acad Sci U S A. 2020. PMID: 32358188 Free PMC article.
-
Ligand binding and activation properties of the purified bacterial cyclic nucleotide-gated channel SthK.J Gen Physiol. 2018 Jun 4;150(6):821-834. doi: 10.1085/jgp.201812023. Epub 2018 May 11. J Gen Physiol. 2018. PMID: 29752414 Free PMC article.
-
Ligand discrimination and gating in cyclic nucleotide-gated ion channels from apo and partial agonist-bound cryo-EM structures.Elife. 2018 Jul 20;7:e39775. doi: 10.7554/eLife.39775. Elife. 2018. PMID: 30028291 Free PMC article.
-
Retinal Cyclic Nucleotide-Gated Channels: From Pathophysiology to Therapy.Int J Mol Sci. 2018 Mar 7;19(3):749. doi: 10.3390/ijms19030749. Int J Mol Sci. 2018. PMID: 29518895 Free PMC article. Review.
-
Cyclic nucleotide-gated channels.Handb Exp Pharmacol. 2009;(191):111-36. doi: 10.1007/978-3-540-68964-5_7. Handb Exp Pharmacol. 2009. PMID: 19089328 Review.
Cited by
-
Allosteric conformational change of a cyclic nucleotide-gated ion channel revealed by DEER spectroscopy.Proc Natl Acad Sci U S A. 2020 May 19;117(20):10839-10847. doi: 10.1073/pnas.1916375117. Epub 2020 May 1. Proc Natl Acad Sci U S A. 2020. PMID: 32358188 Free PMC article.
-
Factors That Affect the Enlargement of Bacterial Protoplasts and Spheroplasts.Int J Mol Sci. 2020 Sep 27;21(19):7131. doi: 10.3390/ijms21197131. Int J Mol Sci. 2020. PMID: 32992574 Free PMC article. Review.
-
Correlating ion channel structure and function.Methods Enzymol. 2021;652:3-30. doi: 10.1016/bs.mie.2021.02.016. Epub 2021 Mar 25. Methods Enzymol. 2021. PMID: 34059287 Free PMC article.
-
Domain Coupling in Allosteric Regulation of SthK Measured Using Time-Resolved Transition Metal Ion FRET.bioRxiv [Preprint]. 2025 May 20:2025.03.31.646362. doi: 10.1101/2025.03.31.646362. bioRxiv. 2025. Update in: Elife. 2025 Aug 12;14:RP106892. doi: 10.7554/eLife.106892. PMID: 40236086 Free PMC article. Updated. Preprint.
-
Why Nature Chose Potassium.J Mol Evol. 2019 Dec;87(9-10):271-288. doi: 10.1007/s00239-019-09915-2. Epub 2019 Oct 28. J Mol Evol. 2019. PMID: 31659374 Review.
References
Publication types
MeSH terms
Substances
Associated data
- Actions
- Actions
- Actions
Grants and funding
LinkOut - more resources
Full Text Sources
