. 2019 Apr 4;476(7):1053-1082.
doi: 10.1042/BCJ20180701.

Glycolytic flux in Saccharomyces cerevisiae is dependent on RNA polymerase III and its negative regulator Maf1

Affiliations

Glycolytic flux in Saccharomyces cerevisiae is dependent on RNA polymerase III and its negative regulator Maf1

Roza Szatkowska et al. Biochem J. .

Abstract

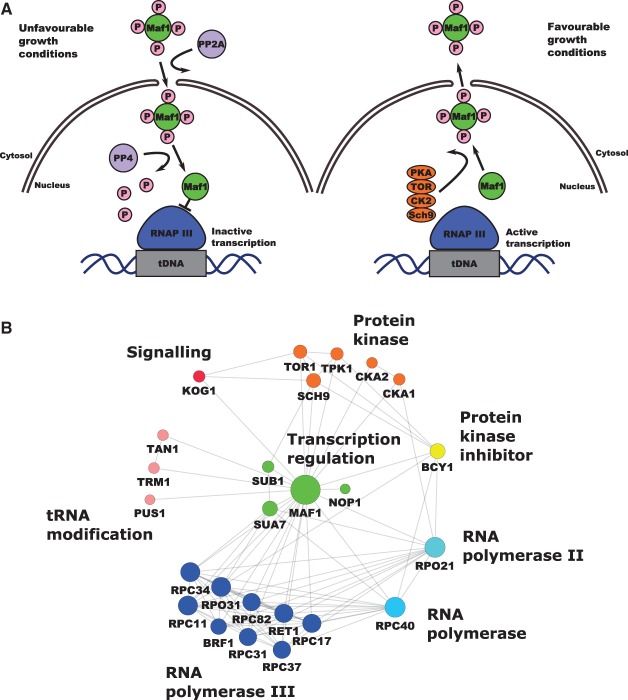
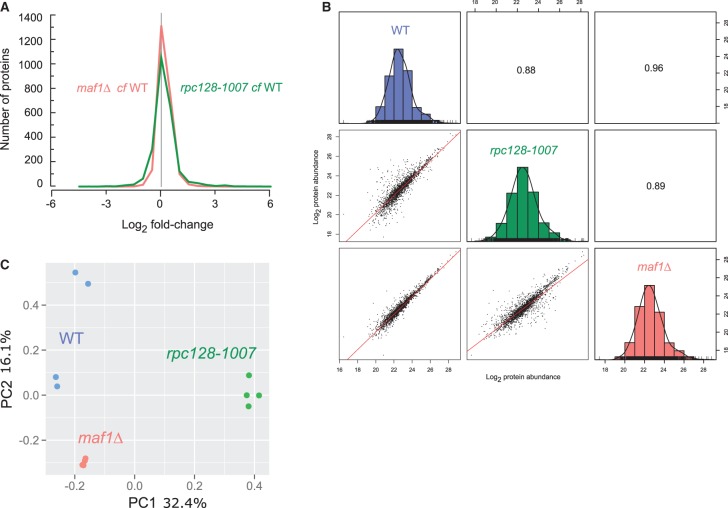
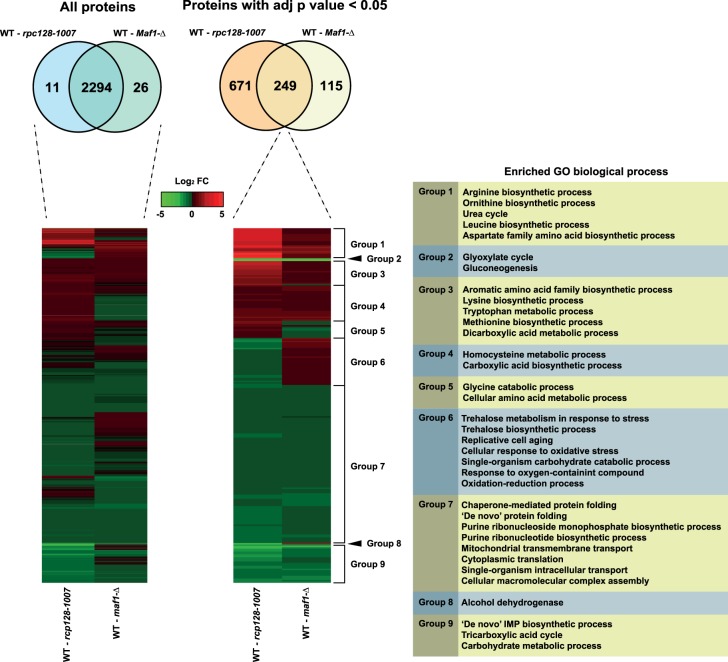
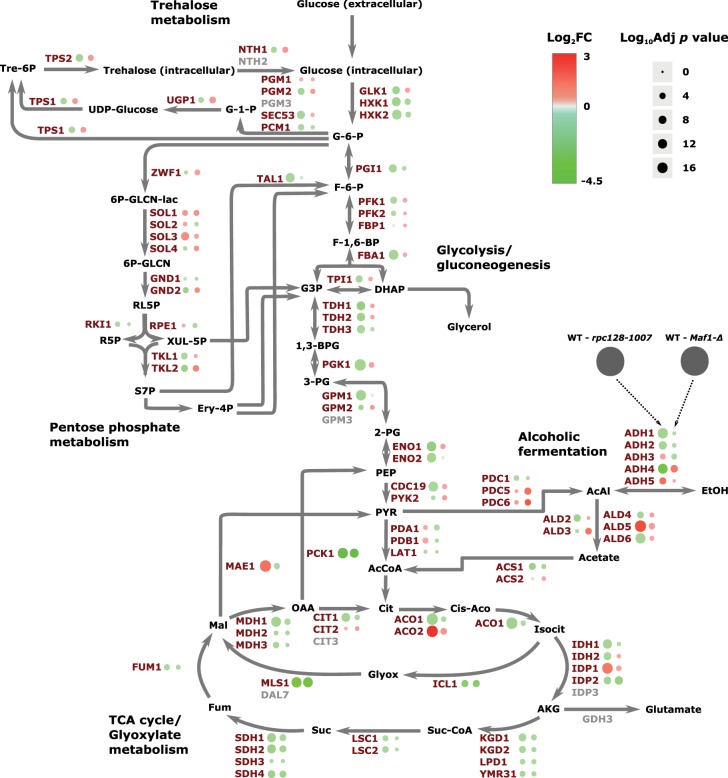
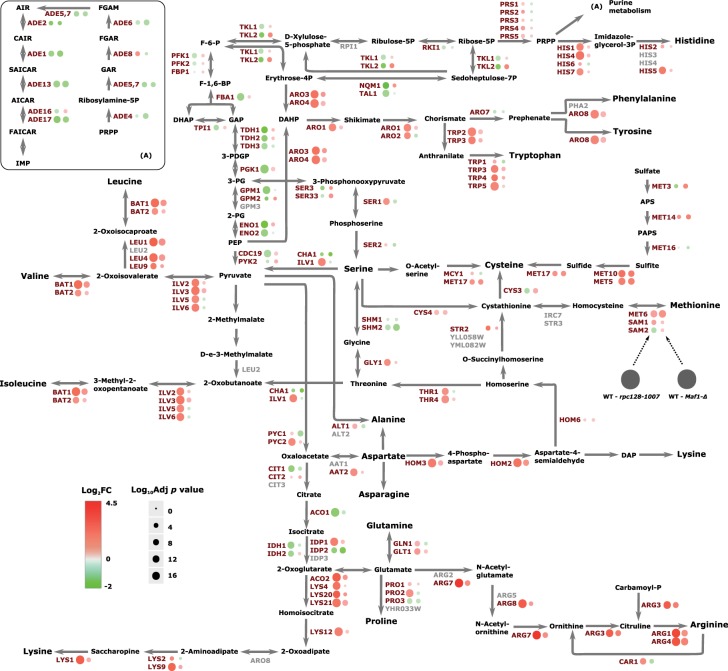
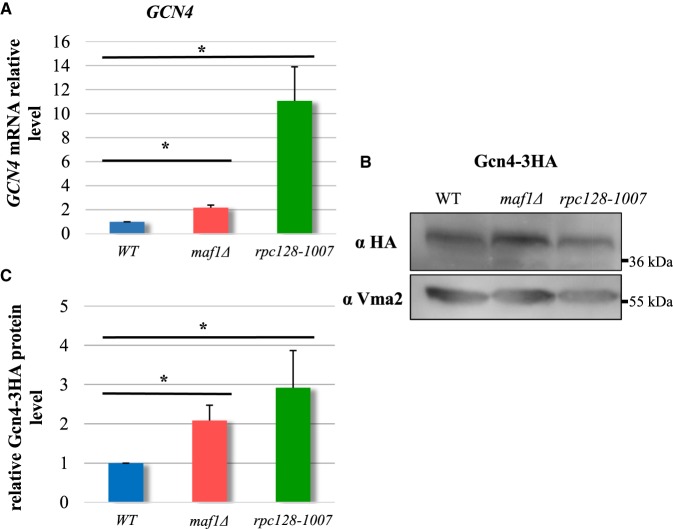
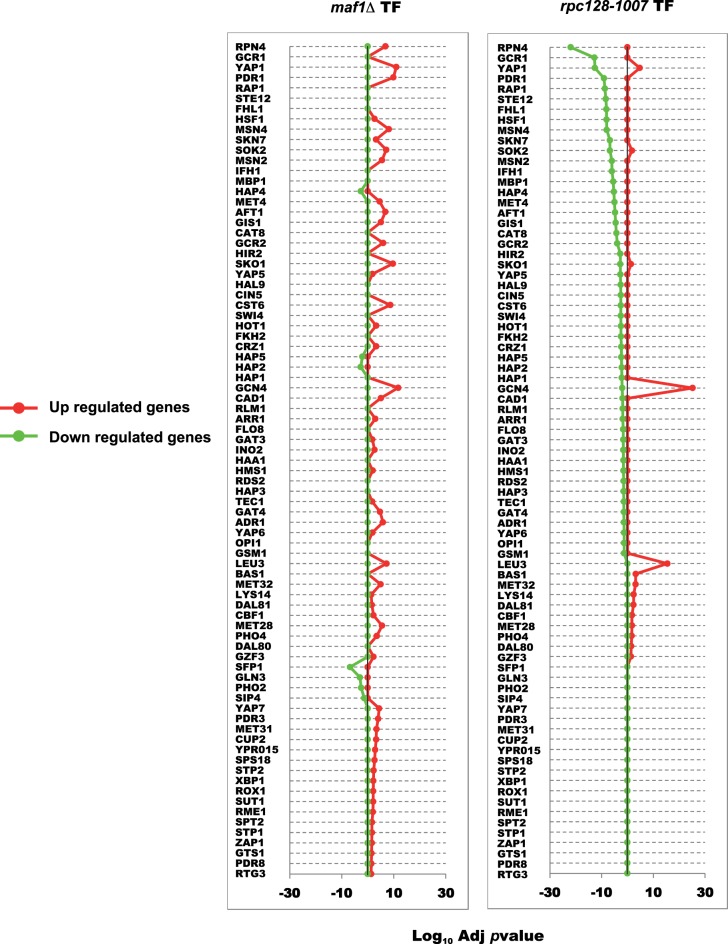
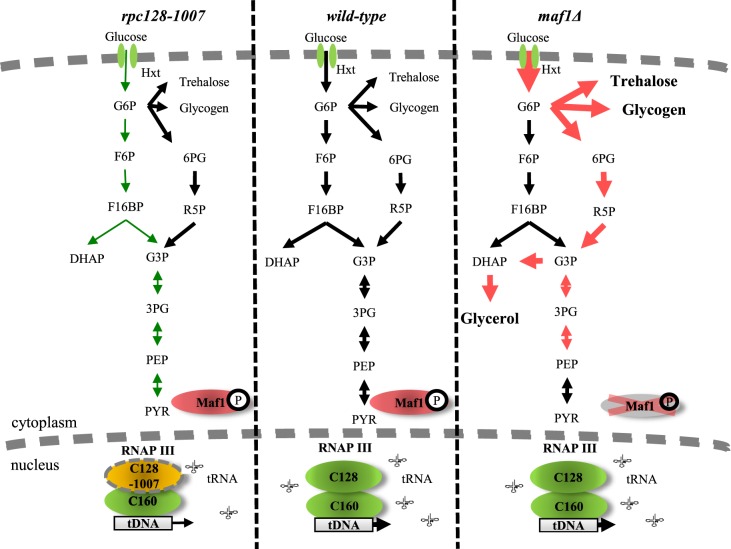
Protein biosynthesis is energetically costly, is tightly regulated and is coupled to stress conditions including glucose deprivation. RNA polymerase III (RNAP III)-driven transcription of tDNA genes for production of tRNAs is a key element in efficient protein biosynthesis. Here we present an analysis of the effects of altered RNAP III activity on the Saccharomyces cerevisiae proteome and metabolism under glucose-rich conditions. We show for the first time that RNAP III is tightly coupled to the glycolytic system at the molecular systems level. Decreased RNAP III activity or the absence of the RNAP III negative regulator, Maf1 elicit broad changes in the abundance profiles of enzymes engaged in fundamental metabolism in S. cerevisiae In a mutant compromised in RNAP III activity, there is a repartitioning towards amino acids synthesis de novo at the expense of glycolytic throughput. Conversely, cells lacking Maf1 protein have greater potential for glycolytic flux.

Keywords: RNA polymerase III; amino acid metabolism; comparative proteomics; glycolysis; maf1.


Conflict of interest statement

The Authors declare that there are no competing interests associated with the manuscript.

Figures

Figure 1.
Figure 1.. RNAP III regulation by Maf1 and Maf1 interaction network.
(A) RNAP III transcription repression is regulated by Maf1. Phosphorylation and dephosphorylation events are involved in the mobility and transportation of Maf1 through the nuclear membrane in which a group of protein kinases are involved in the control of Maf1 nuclear localization responding to stress events. Maf1 produces transcriptional repression on RNAP III by inducing conformational changes. (B) Maf1 protein–protein interaction network. Experimental interactions from STRING database are shown. Nodes have been colored by protein activity in which different protein complexes related to tRNA modification and transportation can be observed. green: transcription regulation; MAF1: negative regulator of RNAP III, SUB1: Sub1 transcriptional regulator facilitating elongation through factors that modify RNAP II, role in hyper-osmotic stress response through RANP II and RNAP III, negatively regulates sporulation [–21], NOP1: Nop1, histone glutamine methyltransferase, modifies H2A at Q105 in nucleolus that regulates transcription from the RNAP I promoter involved in C/D snoRNA 3′-end processing. Essential gene leads to reduced levels of pre-rRNA species and defects in small ribosomal subunits biogenesis [–24], SUA7: transcriptional factor TFIIB, a general transcription factor required for transcription initiation and start site selection by RNAP II [25,26] — Sub1 interaction with TFIIB [27]. Marine blue: RNAP III holoenzyme subunits, red: protein kinases, KOG1: Kog1 the component of the TPR complex, Kog1 depletion display the starvation-like phenotypes — cell growth arrest, reduction in protein synthesis, glycogen accumulation, up-regulation in the transcription of nitrogen catabolite repressed and retrograde responses genes conserved in from yeast to man is the homolog of the mammalian TORC1 regulatory protein RAPTOR/mKOG1 [28,29], TOR1 mediates cell growth in response to nutrient availability and cellular stress by regulating protein synthesis, ribosome biogenesis, autophagy, transcription activation cell cycle [30,31] . Yellow: PKA kinase inhibitor protein BCY1, pink: tRNA modification TAN1: tRNA modifying proteins Tan1 (responsible for tRNASER turnover [32]), TRM1: Trm1 tRNA methyltranspherase produces modified base N2, n2 dimethylguanosine in tRNA in nucleus and mitochondrion [33], PUS1: PUS1 associated with human disease [34], introduces pseudouridines in tRNA, also as on U2 snRNA and pseudouridylation of some mRNA [35,36]. Blue: RPC40 (AC40) is a common subunit to RNAP I and III conserve in all eukaryotes [37,38]. Light blue: RPO21: largest subunit of RNAP II, which produces all nuclear mRNAs, most snoRNAs and snRNA and the telomerase RNA encoded by TLC1 [39,40] (according to Saccharomyces Genome Database).
Figure 2.
Figure 2.. Proteome signature of maf1Δ and rpc128-1007 mutants compared with the wild-type strain.
(A) Histogram of proteins present on both mutants organized according to their corresponding Log2 fold change expression. (B) Comparative scatter plots and histograms of the different strains. The Log2 transformed protein abundances of proteins present in the WT, rpc128-1007 and maf1Δ strains are plotted against one another along with their distribution. The number shown is the Pearson correlation coefficient between the two relevant strains. (C) Principal component analysis (PCA) based on proteins present on all four biological replicates.
Figure 3.
Figure 3.. Increased and decreased protein abundance is presented relative to the wild-type strain for both maf1Δ and rpc128-1007 mutants.
All those statically significant proteins with an adjusted P-value < 0.05 overlapped between both comparisons were then subjected to hierarchical clustering. This clustering analysis created different groups showing the similarities and differences between both mutants with clusters enriching to biological processes related to amino acid and carbohydrate metabolism, response to stress, and respiratory processes.
Figure 4.
Figure 4.. Comparative proteomic profiling of maf1Δ and rpc128-1007 mutants when compared with the wild-type strain.
The differences in protein abundances are presented on a schematic representation of the central carbon metabolism. Those proteins with an increased abundance are presented in red and those with a decreased abundance in green.
Figure 5.
Figure 5.. Opposite effects have been observed in HXT1 promoter activity in strains with altered RNAP III.
(A) Schematic representation of glucose uptake and phosphorylation in yeast cells. Hxt, hexose transporter; P, phosphorylation; Hxk1, hexokinase 1; Hxk2, hexokinase 2; Glk1, glucokinase 1. WT, maf1Δ, rpc128-1007 yeast cells and single or double HXK1, HXK2, GLK1 knockouts strains in WT, maf1Δ and rpc128-1007 genetic background were cultured in YPD (C) or YPGly (D) rich medium under either inducing (2% glucose) or repressing (2% glycerol) conditions. Maf1 deficiency increases HXT1 expression (B) on glucose and Hxk2 activity regardless of carbon source (C, D). Metabolic effects observed in rpc128-1007 correlate with decreased HXT1 expression (B) and decreased hexokinase activity in glucose-rich medium (C), but increased hexokinase activity in glycerol rich medium (D). Compromised RNAP III and maf1Δ have an effect on enzymes in lower glycolysis: Tdh1-3 and Cdc19 activities (E, F). The WT strain (MB159-4D), maf1Δ and rpc128-1007 mutant strains were grown under 2% glucose and 2% glycerol conditions. The experiment was performed in cell-free extracts isolated from the aforementioned strains. Data are expressed as the mean obtained from at least three independent experiments measured in triplicate. The standard deviations are shown. Enzymatic assays were performed in cell-free extracts. The reaction rates were monitored by measuring NADH concentration change over time at 340 nm. Vmax mean value is expressed as µmol·min−1·mg−1 protein (C, D, E, F). (B) HXT1 expression was measured in WT [pBM2636], maf1Δ [pBM2636] and rpc128-1007 [pBM2636] strains by using the lacZ reporter gene system [66]. β-galactosidase activity was assayed in cell-free extracts. The error bars indicate the standard deviation from three independent transformants assayed in triplicate. Asterisk (*) indicate P-value <0.05 and double asterisk (**) illustrate P-values <0.1 according to Student's t-test averaged from all technical repeats.
Figure 6.
Figure 6.. Changes in intracellular concentration of fructose 1,6-bisphosphate (F16BP).
Intracellular fructose 1,6-bisphosphate concentration is lowered in cells with changed RNAP III activity under glucose pulse experiment. Cells were grown in YPD until reaching D600 ≈ 1.0, collected washed in minimal medium lacking carbon source (CBS-C) and resuspended in CBS (-C). Analysis was performed in a thermostatted vessel at 30°C. Cells were flushed with Ar2 gas and glucose was added to a final concentration of 2%. Cell samples suspension were collected in time. Fructose 1,6-bisphosphate content was measured by enzymatic breakdown of NADH monitored by changed absorbance at 340 nm in time according to [4]. Fructose 1,6-biphosphate concentration was calculated from a standard curve and standardized to cells dry weight expressed in g. Results are shown as mean value for four biological replicates.
Figure 7.
Figure 7.. Maf1-deficient yeast strain accumulates glycogen (A) and trehalose (B) during the exponential phase.
Yeasts were cultivated in rich medium supplemented with 2% glucose and harvested by centrifugation at D600 ≈ 1.0. Glucose concentration from enzymatic breakdown of glycogen (A) by amyloglucosidase from A. niger, was determined by the Glucose (HK) Assay Kit (GAHK-20, Sigma). Trehalose (B) content determination assay was performed using Trehalose Assay Kit (Megazyme International Ireland, Wicklow, Ireland) according to the manufacturer's protocol. Trehalose and glycogen content is presented as a mean value of at least three independent biological replicates with standard deviations. There were no significant changes in the ethanol production rate between wild-type (MB159-4D) and maf1Δ strain (C). maf1Δ accumulated glycerol (D). Ethanol and glycerol concentration was determined under Fermentative capacity assay (FCA) conditions in maf1Δ strain (C and D). Fermentative capacity assay was performed as described by van Hoek et al. [75] with modifications (for details, see Materials and methods section). All assays were performed in triplicates. Results are shown as mean concentration (g/L) value with the standard deviation in time (min). ‘C-limited’ stands for ‘carbon-limited conditions’. Asterisk (*) indicate P-value <0.05 and double asterisk (**) illustrate P-values <0.1 according to Student's t-test calculated from biological replicates.
Figure 8.
Figure 8.. Zwf1 and the Ctt1 catalase activity is increased in Maf1-deficient mutant.
Yeast cells logarithmically growing in YPD (A, B, C) or YPGly (A) medium were harvested at D600 ≈ 1.0. (A) For Zwf1 activity assay, NADH breakdown was measured at 340 nm in time at 30°C. For catalase activity (B), hydrogen peroxide decomposition in reaction mixtures containing yeast cell-free extracts was monitored as a change in absorbance at 240 nm in time at 30°C. Results are presented as total mean enzymatic activity from five independent biological replicates with standard deviation expressed as µmol·min−1·mg−1 protein. Asterisk (*) indicate P-value <0.05 according to Student's t-test for biological replicates. (C) Glutathione GSSG/GSH ratio in maf1Δ and rpc128-1007 does not indicate oxidative stress. GSSG, GSH and total glutathione levels were measured according to Quantification kit for oxidized and reduced glutathione (Sigma–Aldrich, 38185) from the kinetic method in agreement with the manufacturer's protocol. Yeast strains were grown in rich medium supplemented with 2% glucose until D600 ≈ 1.0. The absorbance was obtained for four biological samples assayed in duplicate at 405 nm. [GSSG]/[GSH] ratio was measured separately for each sample and averaged. Results are shown as a mean value with standard deviation from four biological replicates. Asterisk (*) indicate P-value <0.05 according to Student's t-test for biological replicates.
Figure 9.
Figure 9.. Amino acid biosynthesis and associated proteome signature.
Abundance protein patterns for amino acid metabolism are presented showing those proteins with an increased abundance in red and those with a decreased abundance in green.
Figure 10.
Figure 10.. GCN4 transcripts and Gcn4 protein relative levels are significantly increased rpc128-1007 yeast cells and moderately in maf1Δ cells.
Yeast cells were grown in rich medium supplemented with 2% glucose until reached exponential growth phase (D600 ≈ 1.0). SYBR-Green-based real-time PCR (A) showed that GCN4 transcript increased 2-fold in maf1Δ and by 11-fold in rpc128-1007. Wild-type strain expression level was taken as 1.0. Samples were normalized to two reference genes — U2 spliceosomal RNA (U2) and small cytosolic RNA (SCR1). Asterisk (*) indicates P-values lowered than 0.05 according to Student's t-test using all technical replicates of biological samples. Western blotting assay (B) showed increased stability of Gcn4-3HA protein in maf1Δ and rpc128-1007 mutant strains expressing chromosomally encoded Gcn4-3HA. Total cell protein extracts were subjected to SDS–PAGE and examined by Western blotting with anti-HA antibodies (B). Quantitative relative level of Gcn4-3HA protein in comparison with yeast Vma2 protein level was calculated for at least three independent biological replicates (C).
Figure 11.
Figure 11.. Transcription factor enrichment analysis.
Enrichment in the proteome sets for individual transcription factors was calculated using the GeneCodis website taking the sets of proteins with an adjusted P-value of <0.05 from both strains maf1Δ and rpc128-1007 compared against the wild-type. Proteins were classified according to their positive or negative fold change and the background set consisted of all proteins identified in the given MS experiment.
Figure 12.
Figure 12.. Proposed model of carbon flow in rpc128-1007 and maf1Δ yeast cells.
Altered RNAP III activity affects carbon flux. Low activity of RNAP III in rpc128-1007 strain is correlated with decreased carbon flow through glycolysis in comparison with reference strain. In contrast, maf1Δ cells demonstrate increased carbon flow through hexokinase step and lower glycolysis compared with the control strain. In maf1Δ, excess glucose-6-P (G6P) is redirected into PPP and trehalose and glycogen biosynthesis. As a result, fructose 1,6-bisphosphate (F16BP) concentration decreases in maf1Δ. From the increased glycerol concentration, carbon flux is partially redirected towards upper glycolysis at PEP. Green: decrease in carbon flux; Red: increase in carbon flux. Legend: glucose-6-phosphate (G6P); fructose-6-phosphate (F6P); fructose 1,6-bisphosphate (F16BP); dihydroxyacetone phosphate (DHAP); glyceraldehyde-3-phosphate (G3P); 6-phosphogluconate (6PG); ribose-5-phosphate (R5P); 3-phosphoglyceric acid (3PG); phosphoenolpyruvate (PEP).

Similar articles

Cited by

References

    1. Otterstedt K., Larsson C., Bill R.M., Ståhlberg A., Boles E., Hohmann S. et al. (2004) Switching the mode of metabolism in the yeast Saccharomyces cerevisiae. EMBO Rep. 5, 532–537 10.1038/sj.embor.7400132 - DOI - PMC - PubMed
    1. Dechant R., Binda M., Lee S.S., Pelet S., Winderickx J. and Peter M. (2010) Cytosolic pH is a second messenger for glucose and regulates the PKA pathway through V-ATPase. EMBO J. 29, 2515–2526 10.1038/emboj.2010.138 - DOI - PMC - PubMed
    1. Zhang C.-S., Hawley S.A., Zong Y., Li M., Wang Z., Gray A. et al. (2017) Fructose-1,6-bisphosphate and aldolase mediate glucose sensing by AMPK. Nature 548, 112–116 10.1038/nature23275 - DOI - PMC - PubMed
    1. Peeters K., Van Leemputte F.L., Fischer B., Bonini B.M., Quezada H., Tsytlonok M. et al. (2017) Fructose-1,6-bisphosphate couples glycolytic flux to activation of Ras. Nat. Commun. 8, 922–922 10.1038/s41467-017-01019-z - DOI - PMC - PubMed
    1. Mitchison J.M. The Biology of the Cell Cycle. CUP Archive; 1971. 324 p.

Publication types

MeSH terms