

Loss of genomic integrity induced by lysosphingolipid imbalance drives ageing in the heart
- PMID: 30886000
- PMCID: PMC6446199
- DOI: 10.15252/embr.201847407
Loss of genomic integrity induced by lysosphingolipid imbalance drives ageing in the heart
Abstract
Cardiac dysfunctions dramatically increase with age. Revealing a currently unknown contributor to cardiac ageing, we report the age-dependent, cardiac-specific accumulation of the lysosphingolipid sphinganine (dihydrosphingosine, DHS) as an evolutionarily conserved hallmark of the aged vertebrate heart. Mechanistically, the DHS-derivative sphinganine-1-phosphate (DHS1P) directly inhibits HDAC1, causing an aberrant elevation in histone acetylation and transcription levels, leading to DNA damage. Accordingly, the pharmacological interventions, preventing (i) the accumulation of DHS1P using SPHK2 inhibitors, (ii) the aberrant increase in histone acetylation using histone acetyltransferase (HAT) inhibitors, (iii) the DHS1P-dependent increase in transcription using an RNA polymerase II inhibitor, block DHS-induced DNA damage in human cardiomyocytes. Importantly, an increase in DHS levels in the hearts of healthy young adult mice leads to an impairment in cardiac functionality indicated by a significant reduction in left ventricular fractional shortening and ejection fraction, mimicking the functional deterioration of aged hearts. These molecular and functional defects can be partially prevented in vivo using HAT inhibitors. Together, we report an evolutionarily conserved mechanism by which increased DHS levels drive the decline in cardiac health.
Keywords: DNA damage; dihydrosphingosine; genomic instability; histone modification; transcription.
© 2019 The Authors.
Conflict of interest statement
The authors declare that they have no conflict of interest.
Figures
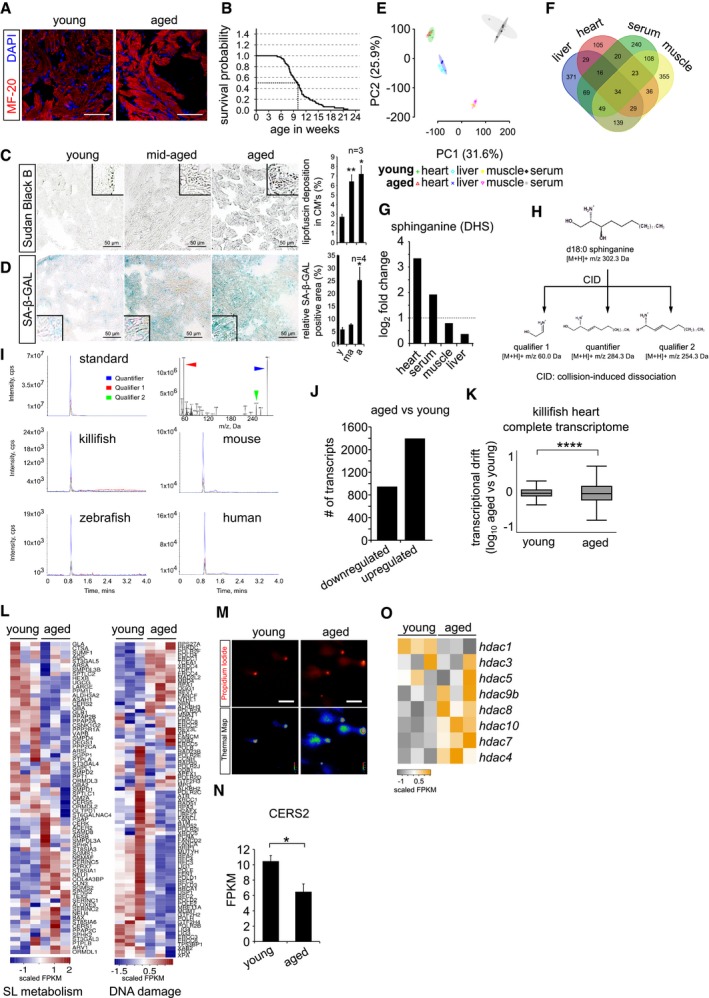
Immunohistochemistry on 10 μm cryosections of young (6 weeks) and aged (12 weeks) killifish ventricular tissue with cardiac marker MF‐20. Cardiomyocyte sarcomeres are labelled with MF‐20 (red).
Kaplan–Meier analysis representing the survival of GRZ‐AD killifish strain used in this study. The median lifespan of killifish in laboratory condition is ˜ 9.5 weeks, indicated as stripped line (n = 170).
Lipofuscin staining by Sudan Black B on 5 μm paraffin sections of different ages of killifish heart. Lipofuscin granules are labelled in grey‐black colour. The bar graph on right represents the percentage area of the ventricular region acquired by lipofuscin granule with respect to total tissue area. Quantification was performed on a total of 12 sections per condition, covering independent regions of the ventricle. Number of animals = 3 per condition. Insets represent magnified view of the ventricles.
Senescence detection based on SA‐beta‐galactosidase activity in ageing killifish hearts. Blue/cyan colour represents the positive regions in the ventricular sections. The bar graph on right represents percentage of SA‐β‐GAL‐stained area with respect to the total ventricle area. Quantification was performed on a total of 12 sections per condition, covering different regions of the ventricle. Number of animals = 4 per condition. Insets represent magnified view of the ventricle.
Principal component analysis of all the metabolites detected in various tissue samples. Number of animals = 4 per condition.
Venn diagram of all the detected metabolites by untargeted metabolomics. Number of animals = 4 per condition.
Bar graph depiction of the relative abundance of sphinganine levels in various killifish tissues obtained from untargeted metabolomics n = 4, each condition. Log2 fold enrichment represents the relative abundance of sphinganine in aged tissues in comparison with young ones.
Graphical illustration of collision‐induced dissociation of standard sphinganine d18:0, resulted in 2 qualifiers and 1 quantifier. Mass by charge ratios (m/z) of corresponding fragments are mentioned underneath.
Spectral peaks of both qualifiers (in red and green) and a quantifier (in blue) obtained from dissociation of standard sphinganine and of aged heart tissues from killifish, zebrafish, mouse and humans.
Bar graph depicting the number of up and downregulated genes in the killifish ventricles upon ageing (n = 3 animals per condition).
Transcriptional drift variance of all the detected transcripts in young and aged killifish hearts. Data are represented as box‐plot, and Levene's test was used for the estimation of the statistical significance. Error bars represent drift‐variance. Box plot whiskers show 1.5 IQR of highest and lowest quartile. Horizontal line within the bars represent median of the underlying population.
Heatmap representation of the hallmark genes of sphingolipid metabolism and DNA damage pathways shows differential expression in young and aged killifish hearts. Scale bar represents scaled FPKM (Fragments Per Kilobase of transcript per Million mapped reads), to graphically represent expression levels of the indicated genes, on a scale given scale.
Micrographs of comet assay on isolated killifish cardiomyocytes from young and old individuals n = 4, each condition.
Bar graph illustrating the absolute transcript expression of ceramide synthase 2 between young and aged killifish ventricles, n = 3 per condition. Expression levels are depicted in FPKM (Fragments Per Kilobase of transcript per Million mapped reads).
Heatmap with scaled FPKM values of all detected histone deacetylase genes, which are differentially expressed in the killifish transcriptome. Scale bar represents scaled FPKM, to graphically represent expression levels of the indicated genes on a scale given scale.
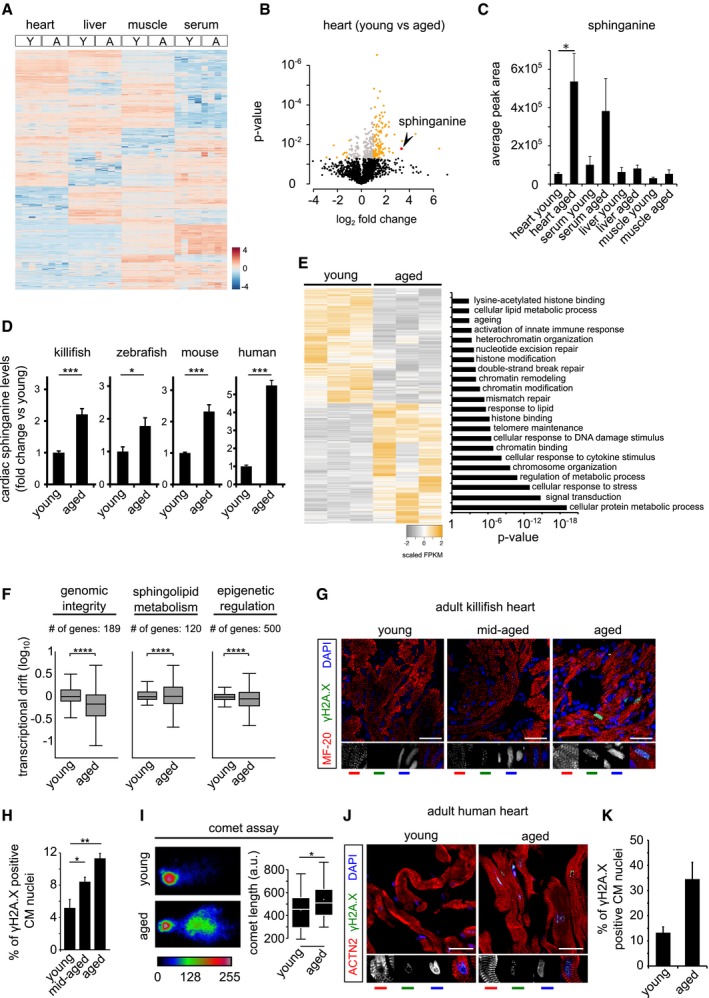
Heatmap of differentially enriched metabolites in heart, liver, skeletal muscle and serum of young (Y) and aged (A) killifish (n = 4). Color scale represents scaled enrichment values.
Ageing leads to significant cardiac‐specific accumulation of sphinganine. Volcano plot depicting the (de)enrichment profiles of all the identified metabolites in the heart, with sphinganine indicated by an arrowhead. Metabolites depicted in orange colour are the significantly altered metabolites with age in the heart (Log2 fold change ≥ 1 or ≤ −1; P‐value < 0.05); Student's t‐test was used to compute statistical significance.
Bar graph depicting the relative abundance of sphinganine in indicated tissue from young and aged killifish.
Targeted lipidomics confirm age‐dependent accumulation of sphinganine in killifish (n = 4; per condition, young = 6 weeks and aged = 12 weeks), zebrafish (n = 4, per condition, young = 7 months and aged = 26 months), mouse (n = 4 for young and n = 6 for aged samples, young = 21–23 weeks and aged = 131–143 weeks) and human hearts (n = 1 for young and 2 for aged, young = 30 years and aged = 61 and 64 years). In the case of human heart tissue, statistical significance was computed from technical replicates.
Heatmap of differentially expressed transcripts (Log2 fold change ± 1, P‐value cut‐off < 0.05) between young and aged killifish hearts (n = 3). Significantly enriched relevant GO categories depicted as bar graph.
Transcriptional drift variance of genes involved in genome integrity, epigenetic regulation and sphingolipid metabolism. Data are represented as box‐plot, and Levene's test was used for the estimation of the statistical significance. Error bars represent drift‐variance. Box plot whiskers show 1.5 IQR of highest and lowest quartile. Horizontal line within the bars represent median of the underlying population.
γH2A.X staining of young, mid‐aged and aged killifish hearts show signs of DNA damage, increasing with age (n = 4, no. of sections per animal = 10 alternate sections, 10 μm thickness).
Quantification of γH2A.X+ cardiomyocyte nuclei.
The aged killifish hearts show significant signs of genome instability shown here by neutral comet assays. Representative images of single nuclei from young and old hearts along with comet length on the right (n = 4).
γH2A.X staining of young and aged human ventricles shows signs of DNA damage accumulating with age (n = 2, no. of sections per sample = 5 alternate sections, 10 μm thickness).
Quantification of γH2A.X+ cardiomyocyte nuclei is on the right.
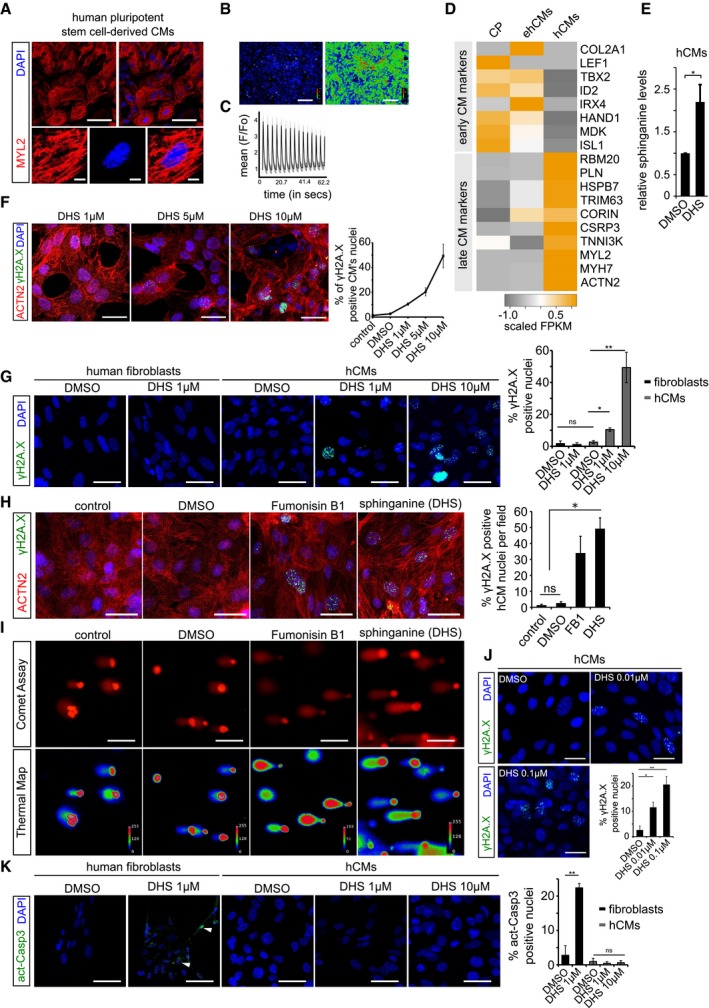
Human pluripotent stem cell‐derived cardiomyocytes (hCMs) express ventricle‐specific marker MYL2 (red); insets show a magnified single cardiomyocyte.
Calcium response in post‐mitotic hCMs. Left and right panel depicts basal and excitation states of hCMs, respectively.
Graphical depiction of ratiometric measurement of fluorescence from different ROI (region of interest). Fluorescence intensities from the indicated ROIs (faint red circles) were measured (F) and normalized to basal fluorescence levels (Fo). The normalized data points (F/Fo) were plotted over time.
Heatmap depicting expression profile of early and late cardiomyocytes markers during key time points of differentiation. CP (cardiac progenitors), ehCMs (early human cardiomyocytes) and hCMs (human cardiomyocytes). Scale bar represents scaled FPKM, to graphically represent expression levels of the indicated genes, on a scale of −1 to +1.
Exogenous treatment of hCMs with 10 μM DHS leads to significant increase in intracellular DHS levels in comparison with DMSO control. Experiment was performed in biological triplicate.
Dose‐dependent increase in γH2A.X+ nuclear foci in hCMs upon DHS exposure. hCMs were pre‐incubated for 3 days with either 1, 5 μM or 10 μM of DHS. The graph on the right represents quantifications from n = 3 experiments. ACTN2 is used to specifically label human cardiomyocytes (red).
Elevated DHS levels induce DNA damage in hCMs but not in human primary fibroblasts shown here by immunostaining for γH2A.X (green). Bar graph on the right represents percentage of γH2A.X+ positive nuclei per condition. These experiments were performed in biological triplicate, and a total of ˜ 170 cells were quantified.
Human cardiomyocytes were pre‐incubated for 3 days with either DMSO, 10 μM Fumonisin B1 or 10 μM sphinganine (DHS), and the induction of DNA damage was assayed by immunostaining for γH2A.X (green). Bar graph to the right depicts the percentage of γH2A.X positive nuclei in the indicated conditions. (n = 3 biological replicates; number of cells quantified per replicate = 150–200). ACTN2 is used to specifically label human cardiomyocytes (red).
Representative micrographs depicting the results of comet assay in the indicated conditions.
Chronic exposure of hCMs with lower concentrations of sphinganine (0.01 and 0.1 μM) for 7 days induces signs of DNA damage shown here by γH2A.X immunostaining. Bar graph represents percentage of positive nuclei per condition.
Elevated DHS levels cause apoptosis in human primary fibroblasts but not in hCMs shown here by immunostaining with active caspase‐3 (green). White arrowheads indicate the active caspase‐3‐stained regions. Bar graph on the right represents percentage of active caspase‐3‐positive cells in the indicated conditions. Experiment was performed in biological triplicate, and a total of ˜ 150 cells were quantified per condition.
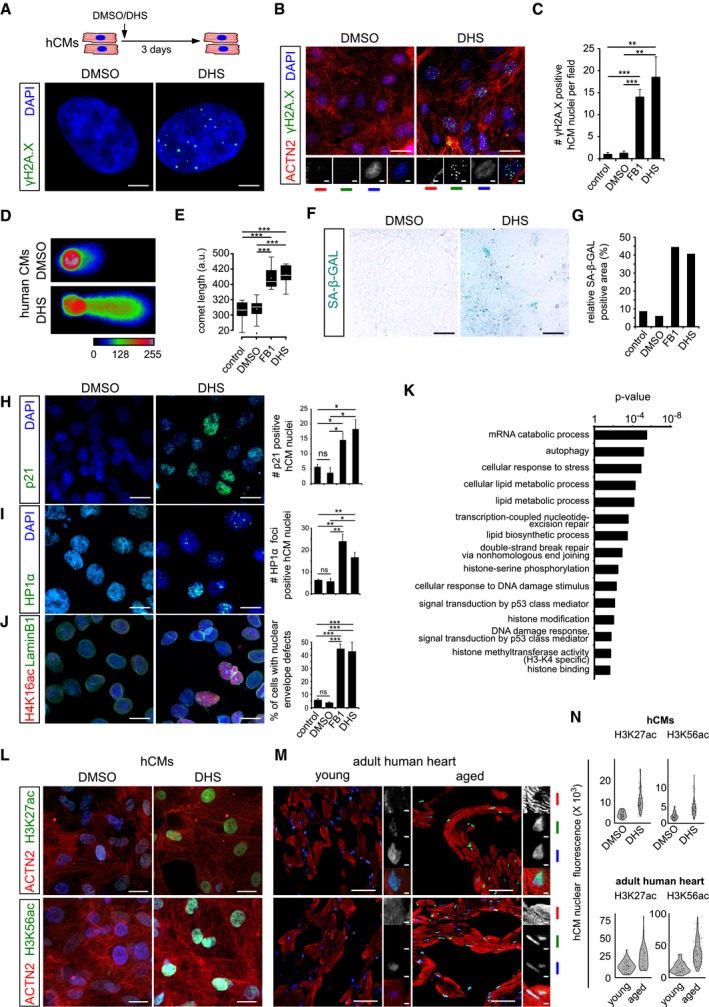
Schematic representation depicting experimental design and the incubation duration used in these experiments. Sphinganine induces DNA damage in human cardiomyocytes depicted here by γH2A.X+ single nuclei.
Micrographs depicting DHS‐induced DNA damage in human cardiomyocytes depicted here by γH2A.X+ nuclei in cardiac‐specific ACTN2+ cells (n = 3 biological replicates; no. of cells quantified = 147 per condition). ACTN2 is to specifically label human cardiomyocytes.
Bar graph depicting the number of γH2A.X+ nuclei in the indicated conditions.
Sphinganine induces DNA damage in human cardiomyocytes depicted here by neutral comet assay of DHS‐treated hCMs.
Quantification of comet length in the indicated conditions. Data are represented as box‐plot, and the extremes of the error bars represent non‐outlier range and their length represents the variability within the data. Horizontal line within the bars represents median of the underlying population. Box plot whiskers show 1.5 IQR of highest and lowest quartile, outliers are included (dots). Extremes of the error bars represent non‐outlier range and their length represents the variability within the data. Horizontal line and white dot within the bars represent median and mean of the underlying population, respectively.
Elevated DHS levels lead to ageing signatures in hCMs shown here by SA‐β‐GAL activity.
Quantification of SA‐β‐GAL activity assay in the indicated conditions. (n = 3 biological replicates). Data are represented as bar graph depicting percentage mean of the SA‐β‐GAL labelled area.
Elevated DHS levels lead to ageing signatures in hCMs shown here by p21 activation. Respective graphs depict the quantification of p21‐positive nuclei is on the right. (n = 3 biological replicates; number of cells quantified per replicate = 150–200).
Elevated DHS levels lead to ageing signatures in hCMs shown here by HP1‐α+ nuclear foci. Respective graphs depict the quantification of HP1‐α‐positive nuclei is on the right. (n = 3 biological replicates; number of cells quantified per replicate = 120–200).
Elevated DHS levels lead to ageing signatures in hCMs shown here by disruption of the nuclear envelope marked by Lamin B1 along with an increase in H4K16ac staining (n = 3 biological replicates; number of cells quantified per replicate = 100–150). Respective graphs depict the quantification of nuclear membrane defect is on the right.
Proteome analysis confirms sphinganine‐induced disruption of (epi)genomic integrity (n = 3). Noteworthy, comparison of the proteomic profiles was performed between hCMs pretreated with DMSO and DHS.
High sphinganine levels cause significant increase in H3K27ac and H3K56ac marks in hCMs. ACTN2 is used to specifically label human cardiomyocytes.
Ageing leads to significant increase in H3K27ac and H3K56ac marks in human hearts. Insets on the right depict magnified view of cardiomyocyte nuclei. ACTN2 is used to specifically label human cardiomyocytes.
Violin plot depicting the distributions of the greyscale nuclear intensity of the indicated markers. Quantification represents measurements of ˜ 150 single nuclei per condition, derived from three biological replicates.
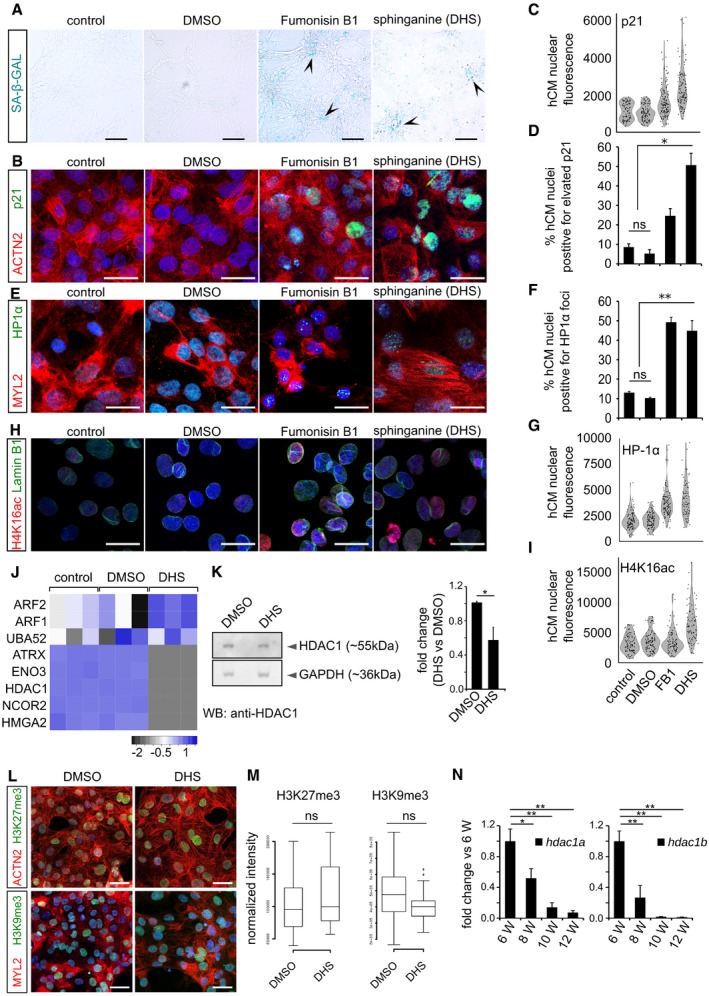
Elevated DHS levels in hCMs induce signature of cellular senescence indicated here by representative micrographs from SA‐beta‐galactosidase staining (blue/cyan colour represents the positive regions). Arrowheads in the representative panels indicate the SA‐beta‐galactosidase‐stained regions.
Elevated DHS levels in hCMs induce p21 expression indicated here by representative micrographs from p21 immunostaining (in green). ACTN2 is used to specifically label human cardiomyocytes.
Violin plot depicting the distributions of the greyscale nuclear intensity of the indicated markers. n = 3 biological replicates; number of fields evaluated per condition = 12; total number of cells quantified per replicate = 150–200).
Bar graph representing the percentage of hCMs nuclei harbouring elevated p21 levels. n = 3 biological replicates; number of fields evaluated per condition = 12; total number of cells quantified per replicate = 150–200).
Elevated DHS levels lead to HP1‐α+ nuclear loci in hCMs. MYL2 is used to specifically label cardiomyocytes (red).
Bar graph depicting the percentage positive nuclei HP1‐α foci in human cardiomyocytes (n = 3 biological replicates; number of fields evaluated per condition = 9; number of cells quantified per replicate = 120–200).
Violin plot depicting the distributions of the greyscale nuclear intensity of the indicated markers (n = 3 biological replicates; number of fields evaluated per condition = 9; number of cells quantified per replicate = 120–200).
DHS exposure leads to significant increase in H4K16ac (in red) levels accompanied by nuclear envelope defects (Lamin B1 immunostaining in green) of cardiomyocytes.
Violin plot depicting the distributions of the greyscale nuclear intensity of the indicated marker (n = 3 biological replicates; number of cells quantified per replicate = 100–150).
Heatmap depicting the relative enrichment/de‐enrichment of the indicated proteins as inferred from label‐free proteomics analysis.
Western blot analysis revealed decreased levels of HDAC1 protein in the DHS‐treated human cardiomyocytes. Quantifications are on the right.
DHS exposure of hCMs does not alter the levels of H3K27me3 and H3K9me3. ACTN2 or MYL2 is used to specifically label human cardiomyocytes.
Box‐plot representing the normalized nuclear intensities of H3K27me3 and H3K9me3. Extremes of the error bars represent non‐outlier range, and their length represents the variability within the data. Horizontal line within the bars represents median of the underlying population. Box plot whiskers show 1.5 IQR of highest and lowest quartile, outliers are included (dots). Extremes of the error bars represent non‐outlier range and their length represents the variability within the data. Horizontal line within the bars represent median of the underlying population.
Bar graphs representing the decline in the transcript levels of hdac1a (left) and hdac1b (right) in the killifish ventricles as inferred by RT–qPCR. X‐axis represents fish age in weeks (annotated as W).
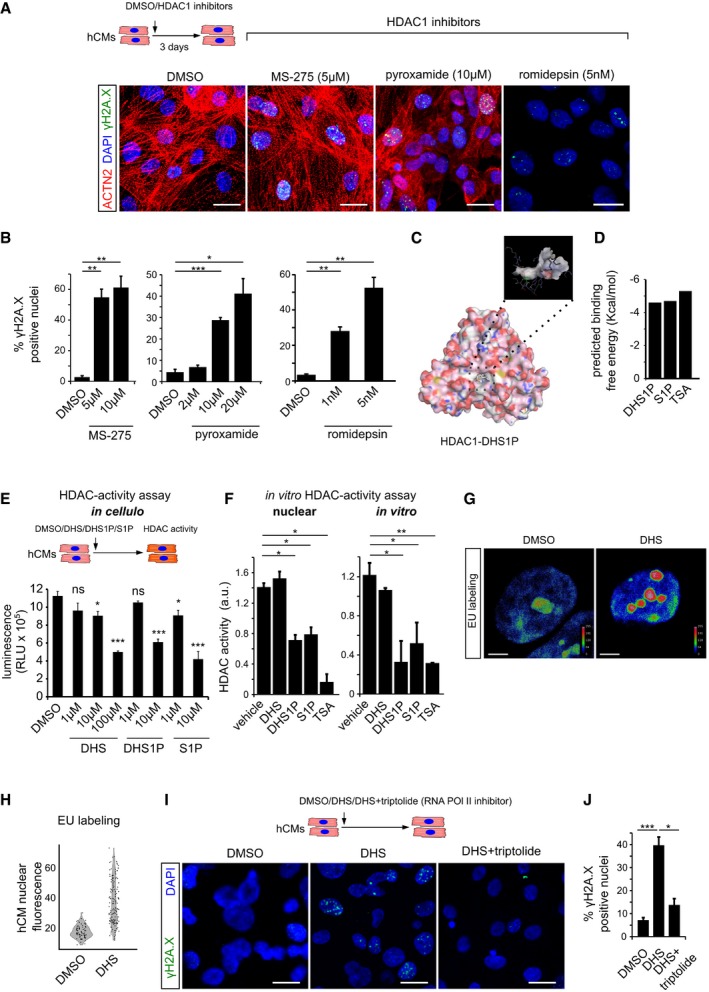
Pharmacological inhibition of HDAC1 using romidepsin, MS‐275 and pyroxamide in human cardiomyocytes causes extensive DNA damage, shown here by γH2A.X staining. ACTN2 is used to specifically label human cardiomyocytes.
Bar graphs depict quantification of γH2A.X+ hCM nuclei in the indicated conditions. Data represent measurements from ˜ 100 to 200 cells per condition, derived from three biological replicates.
In silico simulation showed docking of sphinganine‐analogue DHS1P in the tubular active site of human HDAC1.
Sphinganine derivatives DHS1P and S1P show comparable binding affinity to HDAC1, similar to the known HDAC inhibitor TSA.
Sphinganine and its derivative DHS1P inhibits class 1 HDACs in the human cardiomyocytes as inferred from the in cellulo HDAC activity assay, shown here as bar graph. Data represent measurements from four biological replicates.
In vitro HDAC activity assay revealed inhibition of nuclear HDACs and purified HDAC1 activity by DHS1P and S1P, shown here as bar graphs. Data represent measurements from three independent replicates.
Representative micrographs depicting the increase in nascent transcripts upon DHS treatment of hCMs, measured by EU labelling assay. Micrographs are depicted as a thermal map derived from greyscale images. Scale represents the relative EU labelling intensities within the nucleus, ranging from red colour (higher intensity) to blue colour (lower intensity).
Quantitative assessment of transcription levels measured by EU labelling assay upon treatment with DHS on hCMs. Quantification represents measurements of ˜ 80–120 single nuclei per condition, derived from three biological replicates.
Representative micrographs of hCMs indicating the rescue of the DHS‐induced DNA damage by co‐incubation with RNA Pol II inhibitor, triptolide.
Quantifications of γH2A.X+ CM nuclei represented as bar graph (n = 3 biological replicates).
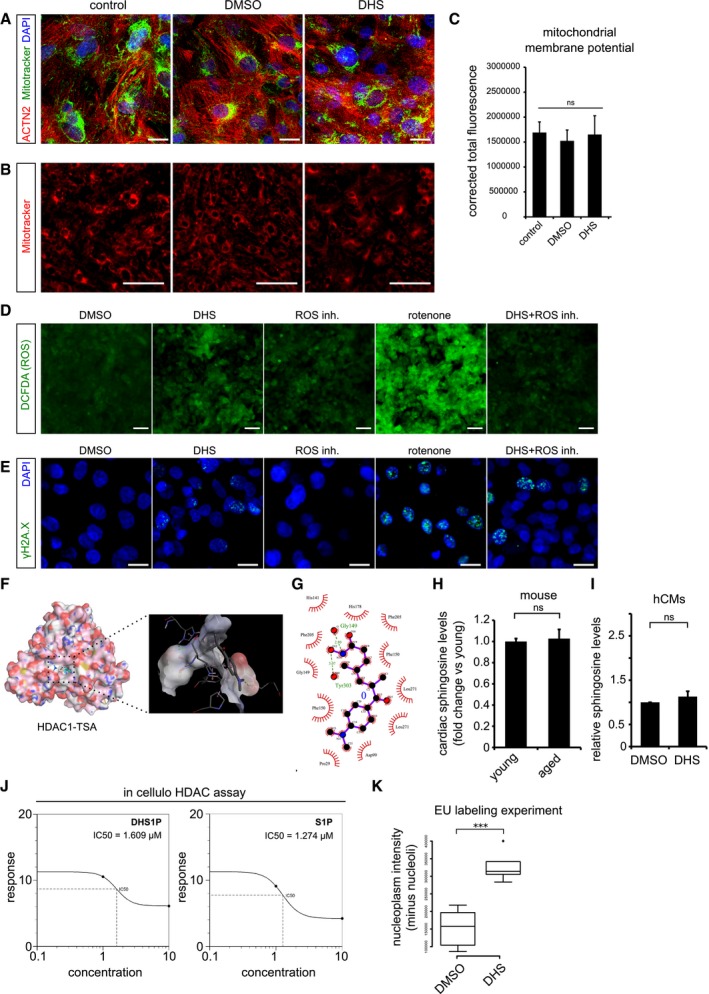
Elevated DHS levels in hCMs do not affect mitochondrial network and its membrane potential. Co‐staining of mitochondria by MitoTracker (in green) along with the cardiac‐specific marker ACTN2 (in red).
Micrographs of live cell imaging of hCMs stained with MitoTracker (in red).
Bar graph representing the corrected total fluorescence mean ± SEM, from live cardiomyocytes stained with MitoTracker n = 3, each condition.
Elevated DHS levels do not increase the ROS levels in human cardiomyocytes. Measurement of reactive oxygen species (ROS) in hCMs pre‐incubated for 72 h with DMSO, DHS, ROS inhibitors, rotenone and DHS + ROS inhibitors.
Elevated DHS levels induce ROS‐independent DNA damage as shown by immunostaining with γH2A.X (in green).
Molecular docking of human HDAC1 protein with Trichostatin TSA, a pan HDAC inhibitor, suggests potential binding within the known active site pocket (spotted square and the magnified view of the active site is to the right). TSA and HDAC1 are represented in ball & stick and spacefill models, respectively.
Ligplot representing the two‐dimensional interaction between the HDAC1 residues with TSA at the active site.
Cardiac sphingosine levels remain unchanged with age in vivo in mice. Bar graph depicting the relative sphingosine (Spo) levels in aged mouse hearts in comparison with the young ones.
Exogenous treatment of hCMs with 10 μM DHS did not alter sphingosine (Spo) levels, depicted as a bar graph in comparison with DMSO control. Experiment was performed in biological triplicate.
Concentration curves depicting the comparable IC50 values of DHS1P and S1P from in cellulo HDAC assay.
Box‐plot depicting the normalized nuclear (without nucleolus) intensities of nascent transcript, measured by EU labelling. Extremes of the error bars represent non‐outlier range, and their length represents the variability within the data. Horizontal line within the bars represents median of the underlying population. Box plot whiskers show 1.5 IQR of highest and lowest quartile, outliers are included (dots). Extremes of the error bars represent non‐outlier range and their length represents the variability within the data. Horizontal line within the bars represent median of the underlying population, respectively.
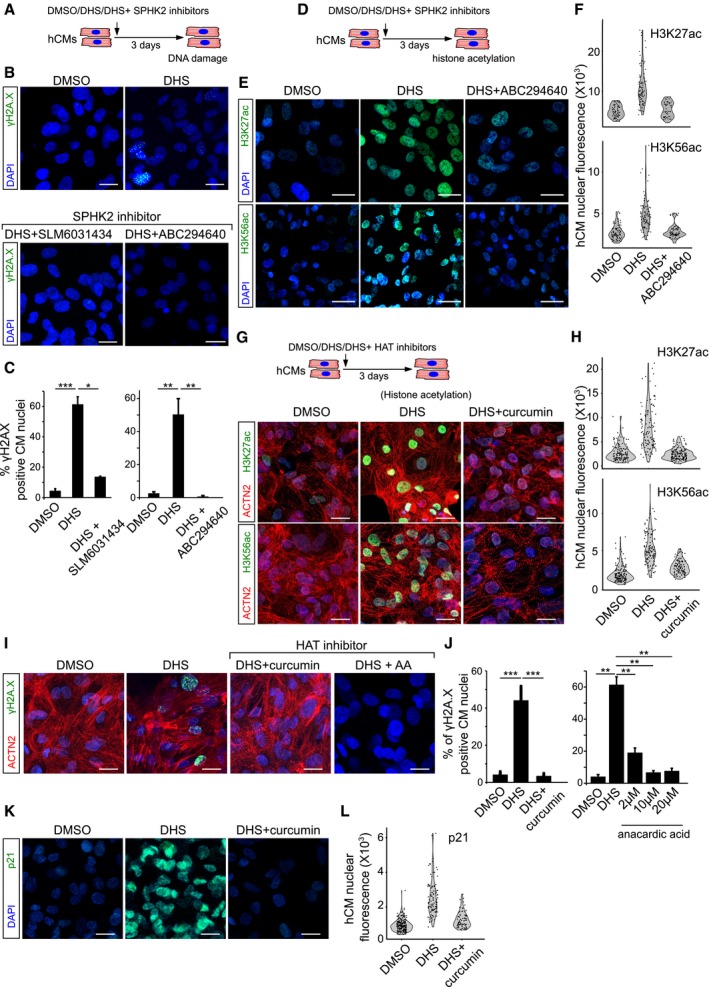
Schematic representation of the experimental set‐up.
SPHK2 inhibition using ABC294640 and SLM6031434 prevents DHS‐induced DNA damage as shown here by staining for γH2A.X (green) in hCMs.
Bar graphs representing the percentage of γH2A.X+ hCMs in the indicated conditions. Data represent measurements from ˜ 200 cells per condition, derived from three biological replicates.
Schematic representation of the experimental set‐up.
Treatment of hCMs with ABC294640, a specific SPHK2 inhibitor, prevents DHS‐induced epigenetic aberrations in hCMs visualized here by H3K56ac and H3K27ac staining (˜ 100 cells quantified/condition).
Violin plots depicting the distributions of the greyscale nuclear intensity of the indicated markers. Quantification represents measurements of ˜ 100–150 single nuclei per condition, derived from three biological replicates.
HAT inhibition by curcumin prevents the aberrant increase in H3K56ac and H3K27ac levels.
Violin plots depicting the distributions of the greyscale nuclear intensity of the indicated markers. Quantification represents measurements of ˜ 100–150 single nuclei per condition, derived from three biological replicates.
HAT inhibition prevents DHS‐induced DNA damage as shown here by staining for γH2A.X (green) on human cardiomyocytes.
Quantification of γH2A.X+ hCMs nuclei represented as percentage bar graph.
Curcumin‐mediated HAT inhibition abrogates the DHS‐induced upregulation of p21.
Violin plots depicting the distributions of the greyscale nuclear intensity of p21 stained nuclei. Quantification represents measurements of ˜ 100–150 single nuclei per condition, derived from three biological replicates.
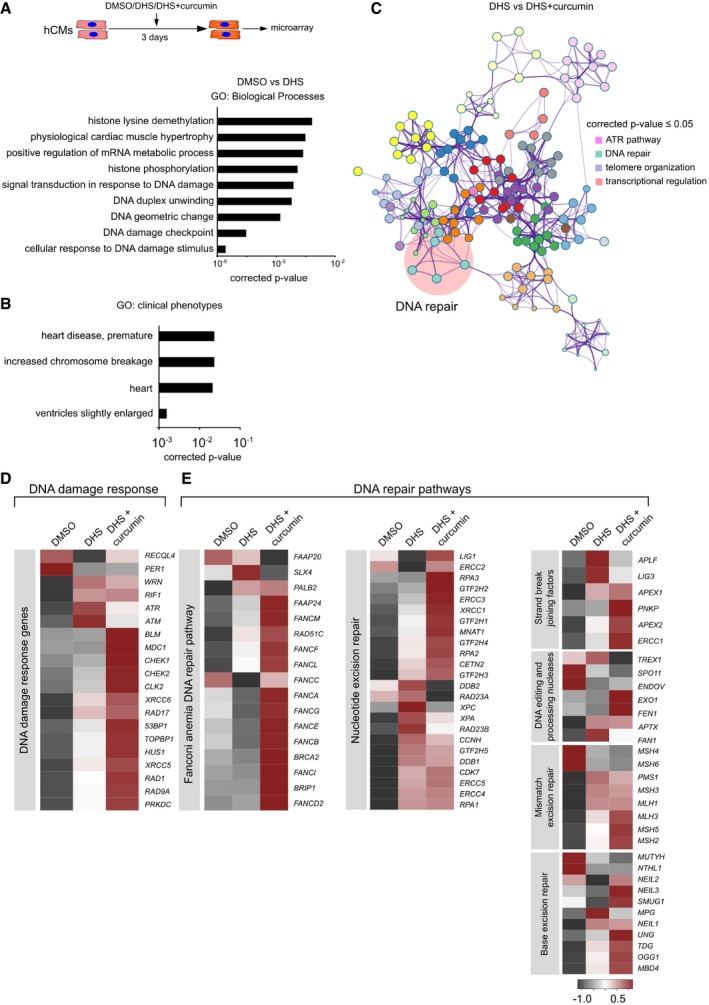
hCMs were treated for 3 days with DMSO, DHS and DHS + curcumin (co‐incubation), represented in the scheme. After incubation, cells were harvested for RNA isolation and differentially expressed genes were identified by microarray analysis. Bar graph depicting Gene Ontology (GO) enrichment status for the differentially expressed transcripts upon DHS treatment. Hypergeometric test was used for determining the P‐value. Experiment was performed in biological triplicate for DHS and DHS + Curcumin condition, whereas two biological replicates were used for DMSO condition.
Bar graph representing GO enrichment levels for clinical phenotypes. Hypergeometric test was used for determining the P‐value.
Co‐treatment of curcumin with DHS leads to the activation of DNA repair pathways as shown here by functional enrichment analysis on the differentially expressed transcripts using Metascape. Hypergeometric test was used for determining the P‐value.
Heatmap depicting the expression profile of the markers of DNA damage response in the indicated conditions.
Co‐treatment of curcumin activates DNA repair pathways as depicted here by heatmaps. Color scale represents scaled expression values.
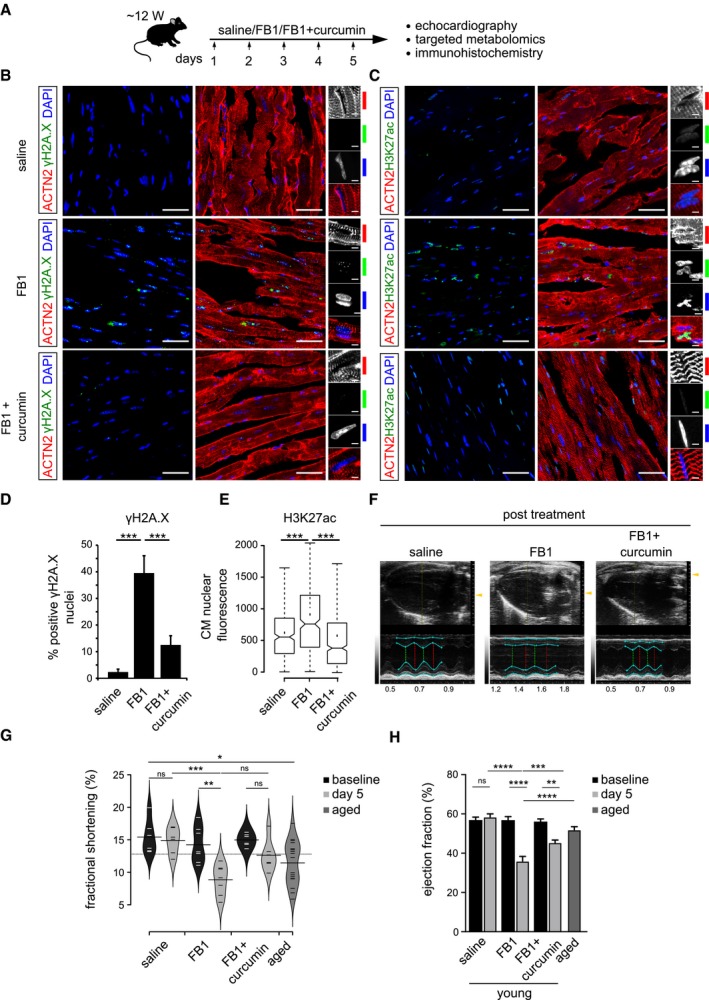
Schematic representation of the experimental set‐up employed in the in vivo mouse experiments (n = 6 animals per condition). 12‐week‐old C57BL/6J mice were injected i.p. once daily with PBS, FB1 (6.75 mg/kg) or FB1 and curcumin (6.75 and 50 mg/kg, respectively) for five consecutive days (n = 6 animals per condition).
Representative micrographs depicting γH2A.X staining on the ventricle sections for the indicated cohorts. Insets on the right depict magnified view of cardiomyocyte nuclei (n = 6 animals per condition). ACTN2 is used to label mouse cardiomyocytes.
Representative micrographs depicting H3K27ac staining on the ventricle sections for the indicated cohorts (n = 6 animals per condition). ACTN2 is used to label mouse cardiomyocytes.
Quantification of γH2A.X+ CMs nuclei represented as percentage bar graph. Data are represented as bar graph depicting percentage mean of the γH2A.X+ CMs population. For quantification, five randomized micrographs, representing independent regions of the ventricles from six different animals per condition, were used (n = 6 animals per condition).
Box‐plot depicting the distributions of the corrected total nuclear fluorescence of the indicated cohorts. Data depict corrected total nuclear fluorescence estimated from greyscaled immunostained micrographs of the ventricular region from the mice treated with the indicated compounds. Extremes of the error bars represent non‐outlier range, and their length represents the variability within the data. Horizontal line with the bar represents median of the underlying population (n = 6 animals per condition). Box plot whiskers show 1.5 IQR of highest and lowest quartile. Extremes of the error bars represent non‐outlier range and their length represents the variability within the data. Horizontal line and dot within the bars represent median and mean of the underlying population, respectively. Notch represents confidence interval around the median.
Representative images depicting ventricular view from the echocardiography of the indicated cohorts. Cyan lines indicate the margins of epicardium and endocardium, the green dashed lines indicate the minimum diameter and the red lines measures the maximum diameter during a heart cycle. The smaller the relative difference between red and green line, the worse is systolic heart function.
Bean‐plot depicting the quantification of fractional shortening in the indicated groups (n = 6 animals per condition). Horizontal lines depict the mean of the underlying distributions.
Bar graph depicting the quantification of ejection fraction (in percentage) in the indicated groups (n = 6 animals per condition).
Similar articles
-
Histone acetylation is essential for ANG-II-induced IGF-IIR gene expression in H9c2 cardiomyoblast cells and pathologically hypertensive rat heart.J Cell Physiol. 2012 Jan;227(1):259-68. doi: 10.1002/jcp.22728. J Cell Physiol. 2012. PMID: 21412773
-
Curcumin-induced histone hypoacetylation: the role of reactive oxygen species.Biochem Pharmacol. 2005 Apr 15;69(8):1205-13. doi: 10.1016/j.bcp.2005.01.014. Biochem Pharmacol. 2005. PMID: 15794941
-
HDAC inhibition attenuates cardiac hypertrophy by acetylation and deacetylation of target genes.Epigenetics. 2015;10(5):418-30. doi: 10.1080/15592294.2015.1024406. Epub 2015 May 5. Epigenetics. 2015. PMID: 25941940 Free PMC article.
-
The role dietary of bioactive compounds on the regulation of histone acetylases and deacetylases: a review.Gene. 2015 May 10;562(1):8-15. doi: 10.1016/j.gene.2015.02.045. Epub 2015 Feb 19. Gene. 2015. PMID: 25701602 Review.
-
KATching-Up on Small Molecule Modulators of Lysine Acetyltransferases.J Med Chem. 2016 Feb 25;59(4):1249-70. doi: 10.1021/acs.jmedchem.5b01502. Epub 2016 Jan 7. J Med Chem. 2016. PMID: 26701186 Review.
Cited by
-
Artificial intelligence uncovers carcinogenic human metabolites.Nat Chem Biol. 2022 Nov;18(11):1204-1213. doi: 10.1038/s41589-022-01110-7. Epub 2022 Aug 11. Nat Chem Biol. 2022. PMID: 35953549
-
Functional biodynamics of human-body system: A mathematical axiomatics with functional learning and aging in life cycle.Cogn Neurodyn. 2020 Oct;14(5):579-590. doi: 10.1007/s11571-020-09629-y. Epub 2020 Sep 5. Cogn Neurodyn. 2020. PMID: 33014174 Free PMC article.
-
Fasting confers stress resistance to skeletal muscle stem cells through non-metabolic actions of β-hydroxybutyrate: implications in cardioprotection and aging.J Cardiovasc Aging. 2022 Jul;2(3):34. doi: 10.20517/jca.2022.24. Epub 2022 Jul 4. J Cardiovasc Aging. 2022. PMID: 35891705 Free PMC article.
-
Intra-species differences in population size shape life history and genome evolution.Elife. 2020 Sep 1;9:e55794. doi: 10.7554/eLife.55794. Elife. 2020. PMID: 32869739 Free PMC article.
-
An automated feeding system for the African killifish reveals the impact of diet on lifespan and allows scalable assessment of associative learning.Elife. 2022 Nov 10;11:e69008. doi: 10.7554/eLife.69008. Elife. 2022. PMID: 36354233 Free PMC article.
References
-
- Aguirre A, Sancho‐Martinez I, Izpisua Belmonte JC (2013) Reprogramming toward heart regeneration: stem cells and beyond. Cell Stem Cell 12: 275–284 - PubMed
-
- Reichwald K, Petzold A, Koch P, Downie BR, Hartmann N, Pietsch S, Baumgart M, Chalopin D, Felder M, Bens M et al (2015) Insights into sex chromosome evolution and aging from the genome of a short‐lived fish. Cell 163: 1527–1538 - PubMed
Publication types
MeSH terms
Substances
Grants and funding
LinkOut - more resources
Full Text Sources
Medical
Research Materials
Miscellaneous
