. 2019 May 15;39(20):3882-3896.
doi: 10.1523/JNEUROSCI.2989-18.2019. Epub 2019 Mar 18.

Neural Maps of Interaural Time Difference in the American Alligator: A Stable Feature in Modern Archosaurs

Affiliations

Neural Maps of Interaural Time Difference in the American Alligator: A Stable Feature in Modern Archosaurs

Lutz Kettler et al. J Neurosci. .

Abstract

Detection of interaural time differences (ITDs) is crucial for sound localization in most vertebrates. The current view is that optimal computational strategies of ITD detection depend mainly on head size and available frequencies, although evolutionary history should also be taken into consideration. In archosaurs, which include birds and crocodiles, the brainstem nucleus laminaris (NL) developed into the critical structure for ITD detection. In birds, ITDs are mapped in an orderly array or place code, whereas in the mammalian medial superior olive, the analog of NL, maps are not found. As yet, in crocodilians, topographical representations have not been identified. However, nontopographic representations of ITD cannot be excluded due to different anatomical and ethological features of birds and crocodiles. Therefore, we measured ITD-dependent responses in the NL of anesthetized American alligators of either sex and identified the location of the recording sites by lesions made after recording. The measured extracellular field potentials, or neurophonics, were strongly ITD tuned, and their preferred ITDs correlated with the position in NL. As in birds, delay lines, which compensate for external time differences, formed maps of ITD. The broad distributions of best ITDs within narrow frequency bands were not consistent with an optimal coding model. We conclude that the available acoustic cues and the architecture of the acoustic system in early archosaurs led to a stable and similar organization in today's birds and crocodiles, although physical features, such as internally coupled ears, head size, or shape, and audible frequency range, vary among the two groups.SIGNIFICANCE STATEMENT Interaural time difference (ITD) is an important cue for sound localization, and the optimal strategies for encoding ITD in neuronal populations are the subject of ongoing debate. We show that alligators form maps of ITD very similar to birds, suggesting that their common archosaur ancestor reached a stable coding solution different from mammals. Mammals and diapsids evolved tympanic hearing independently, and local optima can be reached in evolution that are not considered by global optimal coding models. Thus, the presence of ITD maps in the brainstem may reflect a local optimum in evolutionary development. Our results underline the importance of comparative animal studies and show that optimal models must be viewed in the light of evolutionary processes.

Keywords: alligator; auditory; hearing; neurophonic; sensory; sound localization.


Figures

Figure 1.
Figure 1.
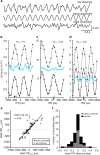
Basic characterization of neurophonic responses. a, A 10 ms segment of a recorded oscillating local field potential (neurophonic) with 1300 Hz stimulus frequency from recording site 56.4. b, Amplitude spectrum after Fourier transformation of the waveform in a. c, Average bandpass filtered responses in a. d, Amplitude spectrum of d. Filter was an eighth-order Butterworth filter with 1250 and 1350 Hz cutoff frequencies. a–d, Shaded areas represent ±1 SD over 5 stimulus repetitions. e, Binaural frequency tuning of recording site 56.4. Average variance of the filtered response waveforms plotted against stimulus frequency. Double-headed arrow indicates width at half-height (370 Hz). Single-headed arrow points at BF (1370 Hz). f, ITD tuning of site 56.4 with 1300 Hz stimulus frequency. Response variance varies cyclically with stimulus ITD. Arrow indicates best ITD (270 μs). Positive ITD indicates that contralateral sound was leading. Dashed line indicates variance of spontaneous activity. e, f, Error bars indicate ±1 SD. g, IPD selectivity of site 56.4 plotted in polar coordinates. A full cycle corresponds to the stimulus period. The direction of the arrow indicates best IPD (0.35 cycles), and the length corresponds to the VS (VS = 0.51) of IPD (and ITD) tuning.
Figure 2.
Figure 2.
Binaural and monaural frequency tuning. a, Frequency selectivity of recording site 67.9. Black represents binaural tuning. Red represents frequency tuning with ipsilateral (right) stimulation. Blue represents tuning with contralateral stimulation. Error bars indicate ±1 SD. Arrows indicate BF (binaural: 970 Hz; ipsilateral: 970 Hz; contralateral: 960 Hz). b, Frequency tuning of recording site 59.8 (BF binaural = 770 Hz; ipsilateral (left) = 770 Hz; contralateral = 720 Hz). c, Histograms of BF in the recorded population (n = 83). d, Contralateral BF versus ipsilateral BF.
Figure 3.
Figure 3.
Sensitivity to ITD and IPD. a, b, ITD tuning curves of recording sites 67.9 (a) and 59.8 (b). Response variance as a function of ITD. Negative ITDs denote ipsilateral leading sources; positive ITDs denote contralateral leading sounds. Dashed lines indicate variance of spontaneous activity. Arrows indicate best ITD (a: 142 μs; b: −201 μs). c, d, IPD tuning of a and b plotted in polar coordinates as normalized variance versus IPD in fractions of stimulus period. Direction of the arrows indicates best IPD (c: 0.14 cycles; d: −0.16 cycles), and the length of the arrow indicates VS of IPD tuning (c: VS = 0.5; d: VS = 0.47). e, Best IPD as a function of BF. f, Histogram of best IPDs (n = 83, bin width: 0.25 cycles). Average best IPD = −0.03 ± 0.20 cycles (circular mean ± circular SD).
Figure 4.
Figure 4.
ITD tuning in noise floor responses as proxy for NL output. a, The neurophonic response in NL can be separated into a signal component generated by phase-locked activity and a noise component. Voltage traces of one stimulus repetition at recording site 59.8 are shown (stimulus ITD = 200 μs, stimulus frequency = 800 Hz). b–d, Variance of response (dotted lines), signal (dashed lines), and noise (solid blue line) as a function of ITD. Black arrows indicate signal best ITD. Blue arrows indicate noise best ITD (b: recording site 56.4; c: 67.9; d: 59.8). e, Correlation between signal and noise best ITD. f, Histogram of best IPD offset (signal best IPD − noise best IPD). IPDs are wrapped into a single cycle (−0.5 to 0.5). Black bars represent all data. Gray bars represent only data from recording sites, which location was confirmed by lesion.
Figure 5.
Figure 5.
Click delays. a, Average response at recording site 67.9 to presentation of 128 monaural clicks. Red represents right/ipsilateral response. Blue represents left/contralateral response. b, The click delay was determined by cross-correlation of the monaural click responses (black line). For recording site 67.9, the click delay (cross-correlation lag with maximum correlation) was −205 μs (black arrow). Dashed purple line indicates corresponding ITD tuning curve of site 67.9. Dashed purple arrow indicates best ITD (142 μs). c, Correlation of click delays and best ITD. Black line indicates best fit with −0.933 × x − 29.642, r = − 0.95, and n = 52. d, Best ITD as a function of BF. Laterality was disambiguated by responses to monaural clicks if click delays were available. Circles represent unambiguous best ITDs. Triangles represent ambiguous best ITDs. Shaded areas represent sample mean ± 1 SD of physiological ITD range. Dashed lines indicate ITD range of the smallest (tympanal separation 2.3 cm) and largest alligator (3.6 cm) range derived from a model of internally coupled ears (Calford and Piddington, 1988). e, Distribution of best ITDs. Negative ITDs denote ipsilateral leading sounds. f, Differences in the ipsilateral and contralateral BF of 64 recording sites versus best ITD. The Pearson's correlation was not significant with the best fit −0.037 × x − 32.88 and r = 0.
Figure 6.
Figure 6.
Monaural phase delays. a, Filtered recordings of site 56.4 in response to monaurally presented 1300 Hz tones. Red represents right/ipsilateral. Blue represents left/contralateral. Shaded areas represent 1 SD with 5 repetitions. b, Phase spectra of the signals in a. Solid lines indicate circular mean. Shaded areas represent 1 circular SD. The monaural phase delay (Δphase = contralateral phase (−0.43 cycles) − ipsilateral phase (−0.04 cycles) = −0.39 cycles; best IPD = 0.35 cycles) was calculated from the mean monaural phases at 1300 Hz (double-headed arrow). c, Monaural phase delay versus best IPD of the cyclic component. A few IPDs extend beyond [−0.5, 0.5] because of disambiguation by click delays (see Fig. 4). Magenta triangles represent data for sites with BF < 800 Hz with best fit as dotted magenta line (r = −0.86). Empty magenta triangles represent data points with BF < 500 Hz and are included in fit for BF < 800 Hz. Black circles represent sites in mid frequency range with BF ≥ 800 Hz and ≤ 1300 Hz. Solid black line indicates best fit for mid-frequencies with r = −0.97. Blue triangles represent BFs > 1300 Hz with best fit as dashed blue line (r = −0.95).
Figure 7.
Figure 7.
Maps in NL. a, Coronal section of auditory brainstem of alligator 59. An electrolytic lesion in NL after recording from recording site 59.2 is indicated with an arrow. The image is left-right inverted; hence, the lesion was localized in the right hemisphere. b, Identified positions of 27 units. Coordinates are normalized in mediolateral and caudorostral dimension relative to the maximal extend of NL. 0 on the mediolateral axis corresponds to the brain midline and 1 to the maximum width of NL. Black lines indicate the boundaries of NL. c, d, Frequency and ITD tuning curves of the cyclic component at recording site 59.2. BF (420 Hz) and best ITD (−213 μs) are indicated by arrows. e, f, BF versus relative location of the recording site on the caudorostral and mediolateral axis, respectively. g, Frequency map in NL. 2D nearest neighbor interpolation of the data in e, f. Interpolated map is smoothed with a running average filter and squeezed into the boundaries of NL. Color code represents BF. h, i, Same as e, f, but for best ITD. j, ITD map in NL. Same method for interpolation used as for f. Color code represents best ITD. b, d–i, Black cross indicates recording site 59.2.
Figure 8.
Figure 8.
Optimal coding of IPD. Top row represents the predictions of an optimal coding model (Harper and McAlpine, 2004) of best IPD distributions in a neuronal population at different frequencies for small alligators (a), chicken (b), barn owl (c), and large alligators (d). The predictions depend on the physiological range of IPDs (red lines). Sizes of the 2D histograms bins were 0.25 cycles (horizontal) and 50 Hz (vertical). e, Experimental data for alligators from this study and Carr et al. (2009). Solid red lines indicate IPD range for small alligators with 3 cm tympanal separation. Dashed red lines indicate the IPD range for large alligators with 10 cm tympanal separation. Bin sizes are 0.05 cycles and 150 Hz. f, Experimental data for chicken (source: Palanca-Castan and Köppl, 2015a). Bin sizes are 0.05 cycles and 450 Hz. g, Experimental data from barn owls (source: Palanca-Castan and Köppl, 2015b). Bin sizes are 0.05 cycles and 500 Hz. h–k, Cumulative distributions of collapsed model data (dashed blue line) and experimental data (red line) within the frequency range indicated by white lines in a–d. Results of a two-sided Kolmogorov–Smirnov test are indicated in the respective figure panel.

References

    1. Aralla R, Ashida G, Köppl C (2018) Binaural responses in the auditory midbrain of chicken (Gallus gallus). Eur J Neurosci. Advance online publication. Retrieved Mar 26, 2018. doi: 10.1111/ejn.13891. 10.1111/ejn.13891 - DOI - DOI - PubMed
    1. Ashida G, Funabiki K, Carr CE (2013a) Biophysical basis of the sound analog membrane potential that underlies coincidence detection in the barn owl. Front Comput Neurosci 7:102. 10.3389/fncom.2013.00102 - DOI - PMC - PubMed
    1. Ashida G, Funabiki K, Carr CE (2013b) Theoretical foundations of the sound analog membrane potential that underlies coincidence detection in the barn owl. Front Comput Neurosci 7:151. 10.3389/fncom.2013.00151 - DOI - PMC - PubMed
    1. Beckert MV, Pavão R, Peña JL (2017) Distinct correlation structure supporting a rate-code for sound localization in the owl's auditory forebrain. eNeuro 4:ENEURO.0144–17.2017. 10.1523/ENEURO.0144-17.2017 - DOI - PMC - PubMed
    1. Bierman HS, Thornton JL, Jones HG, Koka K, Young BA, Brandt C, Christensen-Dalsgaard J, Carr CE, Tollin DJ (2014) Biophysics of directional hearing in the American alligator (Alligator mississippiensis). J Exp Biol 217:1094–1107. 10.1242/jeb.092866 - DOI - PMC - PubMed

Publication types