

A protein quality control pathway regulated by linear ubiquitination
- PMID: 30886048
- PMCID: PMC6484417
- DOI: 10.15252/embj.2018100730
A protein quality control pathway regulated by linear ubiquitination
Abstract
Neurodegenerative diseases are characterized by the accumulation of misfolded proteins in the brain. Insights into protein quality control mechanisms to prevent neuronal dysfunction and cell death are crucial in developing causal therapies. Here, we report that various disease-associated protein aggregates are modified by the linear ubiquitin chain assembly complex (LUBAC). HOIP, the catalytic component of LUBAC, is recruited to misfolded Huntingtin in a p97/VCP-dependent manner, resulting in the assembly of linear polyubiquitin. As a consequence, the interactive surface of misfolded Huntingtin species is shielded from unwanted interactions, for example with the low complexity sequence domain-containing transcription factor Sp1, and proteasomal degradation of misfolded Huntingtin is facilitated. Notably, all three core LUBAC components are transcriptionally regulated by Sp1, linking defective LUBAC expression to Huntington's disease. In support of a protective activity of linear ubiquitination, silencing of OTULIN, a deubiquitinase with unique specificity for linear polyubiquitin, decreases proteotoxicity, whereas silencing of HOIP has the opposite effect. These findings identify linear ubiquitination as a protein quality control mechanism and hence a novel target for disease-modifying strategies in proteinopathies.
Keywords: LUBAC; OTULIN; Huntingtin; p97; protein aggregation.
© 2019 The Authors.
Conflict of interest statement
The authors declare that they have no conflict of interest.
Figures
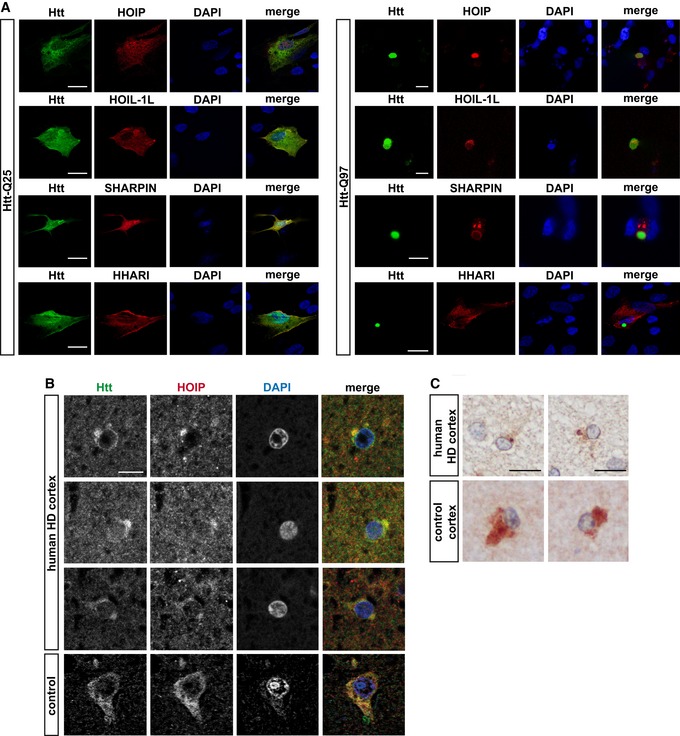
- A
HOIP, HOIL‐1L, and SHARPIN co‐localize with Htt‐Q97 aggregates. SH‐SY5Y cells co‐expressing Htt‐Q25‐GFP or Htt‐Q97‐GFP (green) and HOIP, HOIL‐1L, SHARPIN, or HHARI (red); DAPI (blue). Scale bar, 10 μm.
- B, C
HOIP co‐localizes with Htt inclusion bodies in human HD frontal cortex. Perinuclear Htt aggregates visualized by immunofluorescence (B) and DAB immunohistochemistry (C) in human HD frontal cortex. Scale bar, 10 μm (B), 15 μm (C).
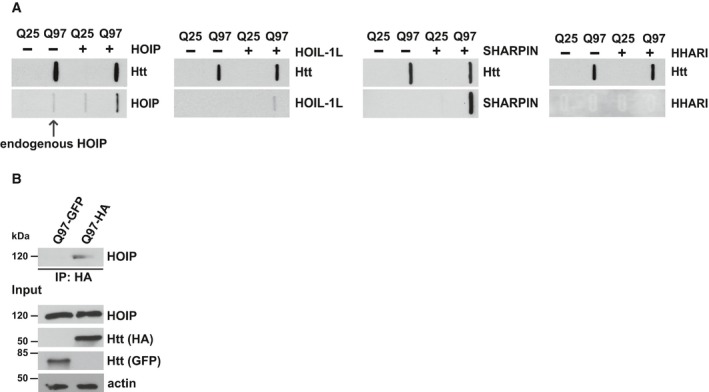
HEK293T cells transiently co‐expressing Htt‐Q25 or Htt‐Q97 and either HOIP, HOIL‐1L, SHARPIN, or HHARI were analyzed by the filter retardation assays. Aggregated proteins retained by cellulose acetate membranes were detected by Western blotting.
Endogenous HOIP interacts with soluble Htt‐Q97. HEK293T cells were transfected with Htt‐Q97‐HA or Htt‐Q97‐GFP (as a control for specific immunoprecipitation of HA‐tagged Htt‐Q97). Cells were lysed with 1% Triton X‐100, followed by an immunoprecipitation of Htt via the HA tag. Immunoprecipitated proteins were analyzed by Western blotting using an anti‐HOIP antibody.
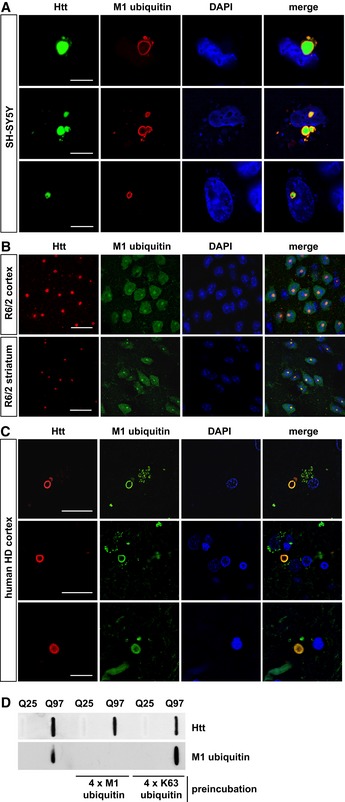
- A–C
M1‐linked ubiquitin co‐localizes with Htt‐polyQ aggregates in cultured SH‐SY5Y cells (A), R6/2 mouse cortex and striatum (B) and human HD frontal cortex (C). Autofluorescent lipofuscin appears in the green channel in human brain. Scale bar, 20 μm (A), 10 μm (B, C).
- D
Htt‐Q25‐ or Htt‐Q97‐expressing HEK293T were analyzed by filter retardation assays. As indicated, the M1 ubiquitin antibody was preincubated with recombinant tetra‐ubiquitin linked via M1 (4 × M1 ubiquitin) or K63 (4 × K63 ubiquitin).
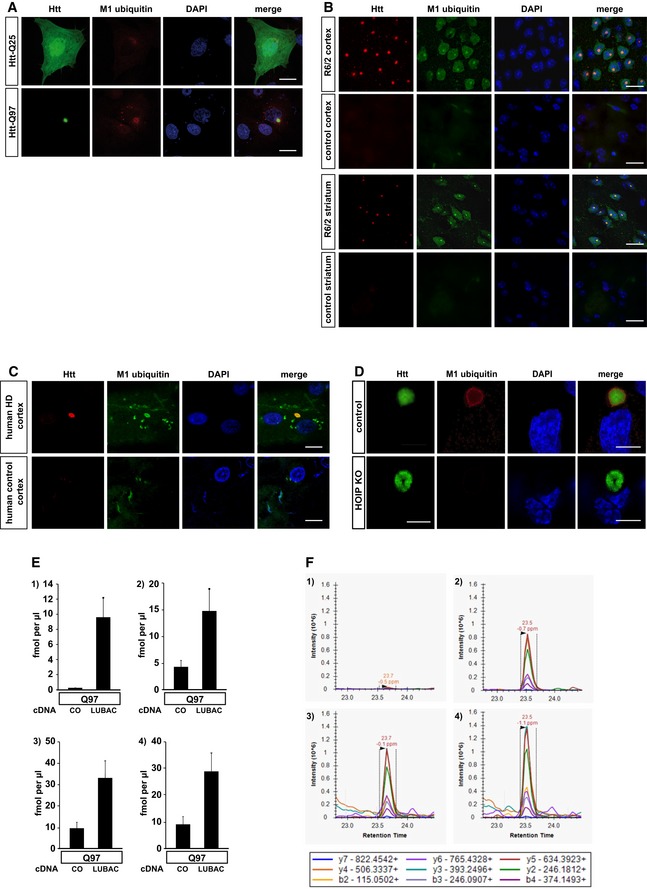
- A
SH‐SY5Y cells expressing Htt‐Q25‐GFP (upper panel) or Htt‐Q97‐GFP (lower panel) were stained for M1 ubiquitin (red) and DAPI (blue). Scale bar, 10 μm.
- B, C
M1‐linked ubiquitin co‐localizes with Htt‐polyQ aggregates in R6/2 mouse cortex and striatum (B) and human HD frontal cortex (C). Autofluorescent lipofuscin appears in the green channel in human brain. Scale bar, 20 μm (B), 10 μm (C).
- D
HAP1 WT (control) or HOIP KO HAP1 cells expressing Htt‐Q97‐GPF (green) were stained for M1 ubiquitin (red) and DAPI (blue). Scale bar, 10 μm.
- E
Quantification of ubiquitin chains associated with SDS‐insoluble Htt‐Q97 from HEK293T cells by mass spectrometry (1: M1, 2: K11, 3: K48, and 4: K63). The standard error is shown with error bars (n = 3).
- F
Extracted chromatograms from the M1 ubiquitin measurements. Upper panels show the quantification of the ubiquitin chain peptide, while the lower panels show the spiked in reference peptide used for quantification. Panels 1 and 3 show an example of Htt‐Q97, and panels 2 and 4 show an example of Htt‐Q97 + LUBAC. Above each peak, the retention time and mass error are shown. Below the panels a legend identifying the product ions observed and used for quantification is shown.
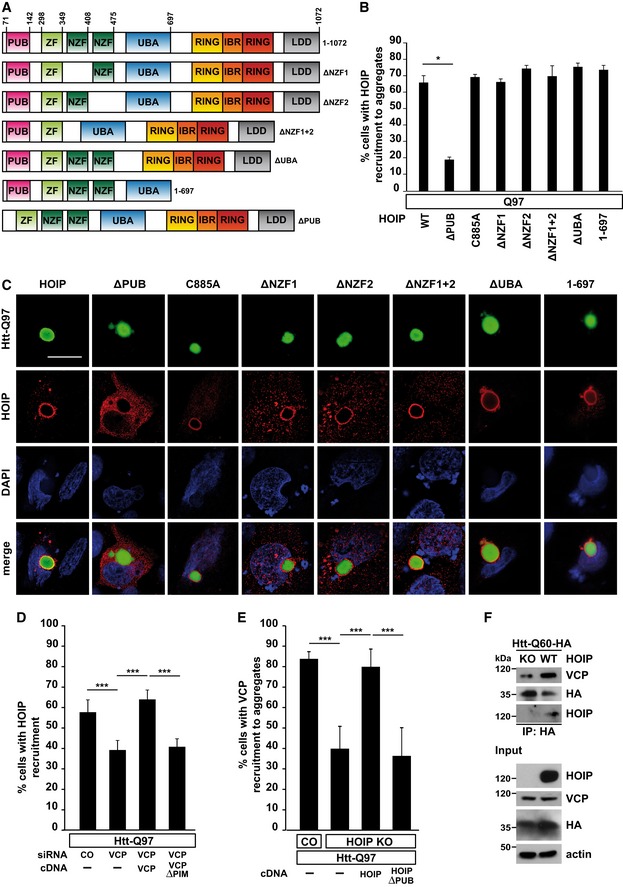
Scheme of WT HOIP and HOIP mutants.
Quantification of the co‐localization of WT HOIP or HOIP mutants and Htt‐Q97 aggregates. Data are displayed as mean ± SD and were analyzed by Mann–Whitney U‐test, n = 3.
Htt‐Q97‐GFP (green) was co‐expressed with HA‐tagged WT or HOIP mutants (red) in SH‐SY5Y cells and analyzed by immunocytochemistry using an antibody against HA. DAPI (blue). Scale bar, 10 μm.
Recruitment of HOIP to Htt‐Q97 is decreased in p97/VCP‐deficient cells. p97/VCP‐deficient SH‐SY5Y cells co‐expressing Htt‐Q97 and HA‐HOIP were reconstituted with either WT VCP or VCP∆PIM and analyzed by immunocytochemistry. Data are displayed as mean ± SD and were analyzed by one‐way ANOVA followed by Tukey's multiple comparison test, n = 9.
Recruitment of p97/VCP to Htt‐Q97 is decreased in HOIP KO cells. WT HAP1 cells (control) or HOIP KO HAP1 cells reconstituted with either WT HOIP or HOIP∆PUB were analyzed by immunocytochemistry. Data are displayed as mean ± SD and were analyzed by one‐way ANOVA followed by Bonferroni's multiple comparison test, n = 5.
The interaction of soluble Htt‐Q60 with p97/VCP is dependent on HOIP. WT HAP1 cells or HOIP KO HAP1 cells were transfected with Htt‐Q60‐HA. 48 h after transfection, cells were lysed with 1% Triton X‐100, followed by an immunoprecipitation of Htt‐Q60 via the HA tag. Immunopurified proteins were detected by Western blotting using an anti‐VCP and anti‐HOIP antibody.
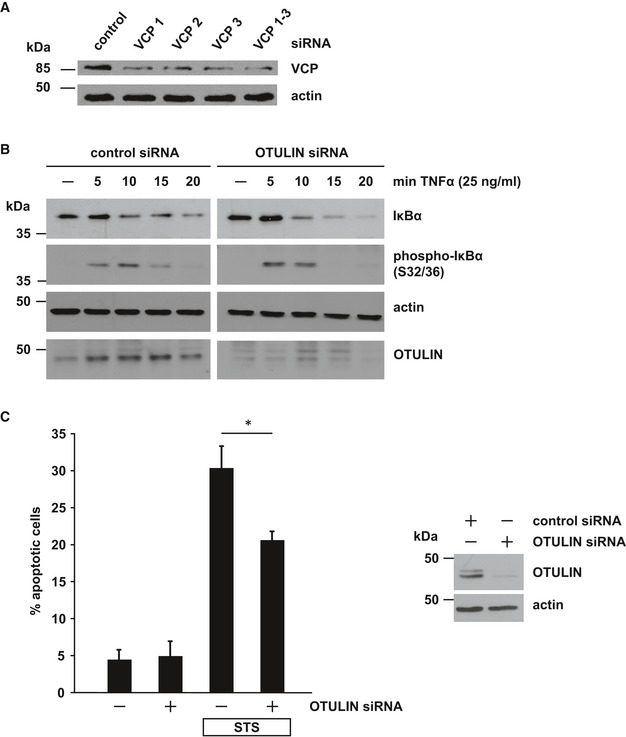
Partial silencing of VCP/p97 in SH‐SY5Y cells by three different siRNAs. Cells were harvested 48 h after transfection of control or VCP/p97‐specific siRNAs and analyzed by immunoblotting.
Decreased OTULIN expression promotes NF‐κB activation. Degradation of IκBα or phospho‐IκBα after TNF‐α treatment (25 ng/ml) of SH‐SY5Y cells transfected with control siRNA or OTULIN siRNA was visualized by immunoblotting using the indicated antibodies.
OTULIN RNA interference decreases staurosporine‐induced cell death. SH‐SY5Y cells were treated with staurosporine (STS, 1 μM, 3 h) 2 days after transfection with control siRNA or OTULIN siRNA. Apoptotic cell death was quantified by immunocytochemistry using an antibody against active caspase‐3. Data are displayed as mean ± SD and were analyzed by a Mann–Whitney U‐test (*P ≤ 0.05), n = 4.
- A
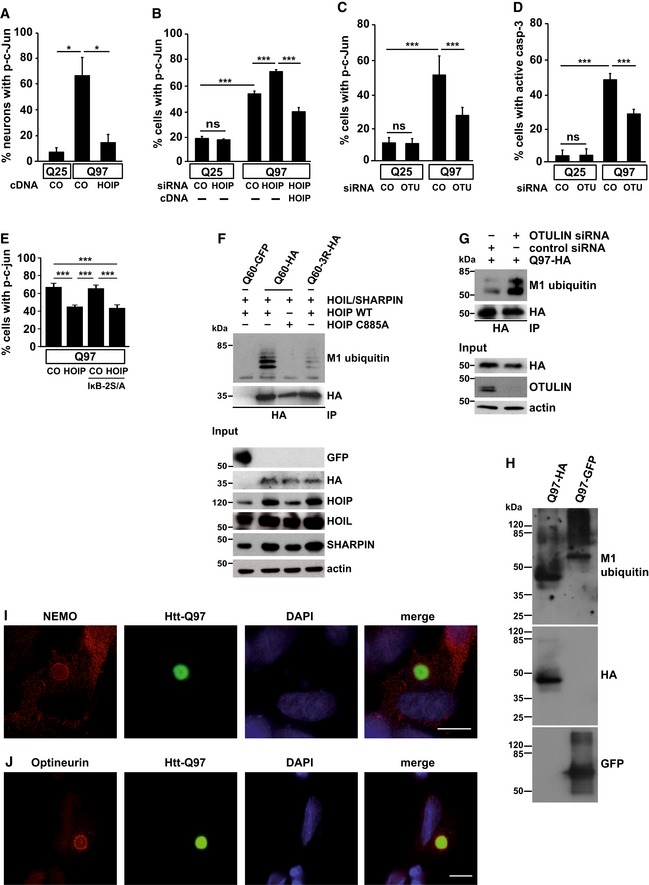
Increased expression of HOIP decreases nuclear phospho‐c‐Jun in primary neurons. Primary mouse hippocampal neurons expressing Htt‐Q25 or Htt‐Q97 ± HOIP were analyzed by immunocytochemistry using an antibody against phospho‐c‐Jun. Data are displayed as mean ± SD and were analyzed by two independent Mann–Whitney U‐tests, n = 3.
- B
Htt‐Q97‐induced toxicity is increased in cells silenced for HOIP. SH‐SY5Y cells transiently transfected with Htt‐Q25 or Htt‐Q97 and either control siRNA (CO) or HOIP siRNA were analyzed by immunocytochemistry using an antibody against phospho‐c‐Jun. For rescue experiments, HOIP was co‐expressed 24 h after silencing. Quantification of Htt‐expressing cells with nuclear phospho‐c‐Jun is based on Student's t‐test from three independent experiments. Data are displayed as mean ± SD unless otherwise stated.
- C, D
OTULIN silencing decreases the toxicity of Htt‐Q97. SH‐SY5Y cells transiently transfected with either control siRNA (CO) or OTULIN siRNA and Htt‐Q25 or Htt‐Q97 were analyzed by immunocytochemistry using antibodies against phospho‐c‐Jun (C) or cleaved caspase‐3 (D). Data are displayed as mean ± SD and were analyzed by one‐way ANOVA followed by Tukey's multiple comparison test, n = 9–11.
- E
The protective effect of HOIP is independent of NF‐κB signaling. SH‐SY5Y cells transiently transfected with Htt‐Q97‐GFP and either control vector (CO) or HOIP ± the NF‐κB super‐repressor IκB‐2S/A were analyzed by immunocytochemistry using an antibody against phospho‐c‐Jun. Data are displayed as mean ± SD and were analyzed by one‐way ANOVA followed by Tukey's multiple comparison test, n = 9.
- F
SDS‐soluble Htt‐polyQ species are modified by linear ubiquitin chains. HEK293T cells were co‐transfected with Htt‐Q60‐GFP (as a control for specific immunoprecipitation of HA‐tagged Htt‐Q60), Htt‐Q60‐HA, or Htt‐Q60‐3R‐HA (three lysine residues replaced by arginines) and the plasmids indicated. Cells were lysed under denaturing conditions (1% SDS), followed by immunoprecipitation of Htt via the HA tag (1% Triton X‐100, 0.1% SDS). Immunopurified proteins were detected by Western blotting using the M1 ubiquitin‐specific antibody 1E3 and anti‐HA.
- G
Silencing of OTULIN increases linear ubiquitination of Htt‐Q97. A linear ubiquitination assay was performed as described in (F) with HEK293T cells transfected with Htt‐Q97‐HA and control siRNA or OTULIN siRNA.
- H
SDS‐insoluble Htt‐polyQ species are modified by linear ubiquitin chains. HEK293T cells expressing Htt‐Q97‐HA or Htt‐Q97‐GFP were lysed under denaturing conditions in 1.5% SDS. After centrifugation, the pellets containing the SDS‐insoluble aggregates (SDS‐insoluble fraction) were dissolved in formic acid. Formic acid‐dissolved aggregates were analyzed by immunoblotting using the M1 ubiquitin‐specific 1F11/3F5/Y102L antibody.
- I
Endogenous NEMO co‐localizes with Htt‐Q97 aggregates. NEMO (red) and Htt‐Q97‐GFP (green) were analyzed by immunocytochemistry in SH‐SY5Y cells. DAPI (blue). Scale bar, 10 μm.
- J
Endogenous Optineurin co‐localizes with Htt‐Q97 aggregates. Optineurin (red) and Htt‐Q97‐GFP (green) were analyzed by immunocytochemistry in SH‐SY5Y cells. DAPI (blue). Scale bar, 10 μm.
- A, B
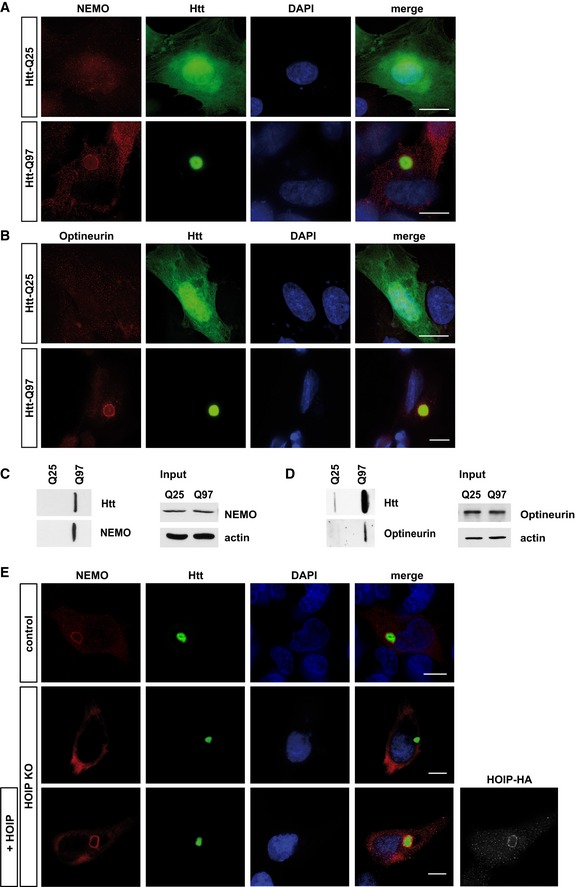
SH‐SY5Y cells expressing Htt‐Q25‐GFP (upper panel) or Htt‐Q97‐GFP (lower panel) were stained for (A) NEMO (red) or (B) Optineurin (red) and DAPI (blue). Scale bar, 10 μm.
- C, D
Htt‐Q25‐ or Htt‐Q97‐expressing HEK293T were analyzed by filter retardation assays. Both endogenous NEMO (C) and Optineurin (D) are retained on a cellulose acetate membrane together with SDS‐insoluble Htt‐Q97.
- E
HOIP is required to recruit NEMO to Htt‐Q97. NEMO (red) and Htt‐Q97‐GFP (green) were analyzed by immunocytochemistry in WT HAP1 cells (control), HOIP KO HAP1 cells, or HOIP KO HAP1 cells reconstituted with HOIP. DAPI (blue). Scale bar, 10 μm.
- A
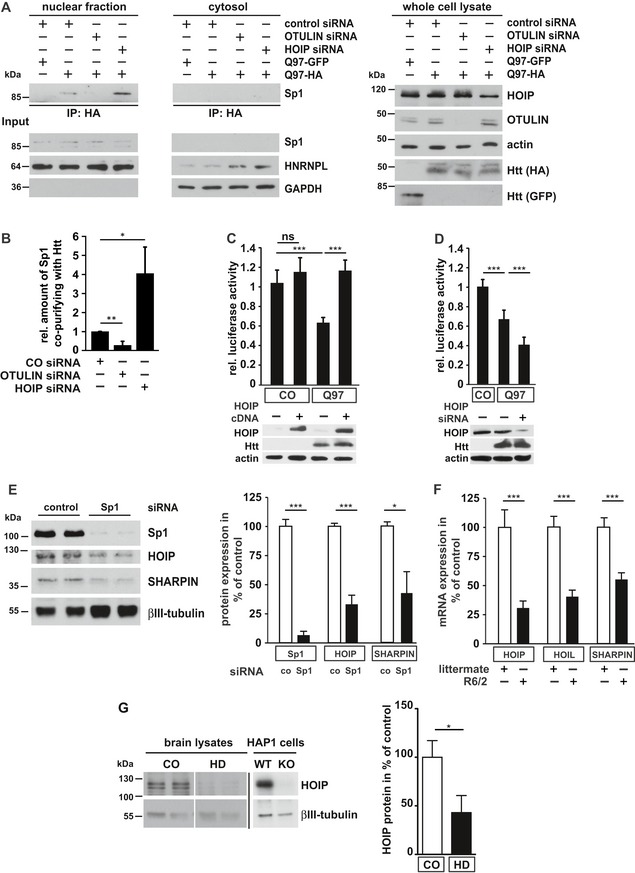
The interaction between Htt‐Q97 and Sp1 is decreased by linear ubiquitination. HEK293T cells were co‐transfected with Htt‐Q97‐HA and the siRNAs indicated. Htt‐Q97‐GFP was transfected as a control for specific immunoprecipitation of HA‐Htt‐Q97. Nuclear (left panel) and cytosolic fractions (middle panel) were subjected to an anti‐HA immunoprecipitation followed by Western blotting using an anti‐Sp1 antibody. Right panel: input controls (whole cell lysates).
- B
Quantification of the interaction between Htt‐Q97 and Sp1 in nuclear fractions. Shown is the relative amount of Sp1 co‐purifying with Htt‐Q97. Signal intensities were normalized to nuclear Sp1. Data are displayed as mean ± SD and were analyzed by two independent Mann–Whitney U‐tests, n = 4.
- C, D
Impairment of Sp1‐mediated transcription by Htt‐Q97 is modified by HOIP. (C) Shown is the relative luciferase activity in HEK293T cells expressing Htt‐Q97‐HA, a Sp1 luciferase reporter construct, and HOIP cDNA. Data are displayed as mean ± SD and were analyzed by Kruskal–Wallis test followed by Dunn's multiple comparison test, n = 9–11. (D) Shown is the relative luciferase activity in HEK293T cells expressing Htt‐Q97‐HA, a Sp1 luciferase reporter construct, and HOIP siRNA. Data are displayed as mean ± SD and were analyzed by one‐way ANOVA followed by Tukey's multiple comparison test, n = 9.
- E
Sp1 silencing decreases HOIP and SHARPIN protein expression. SH‐SY5Y cells were transfected with control or Sp1‐specific siRNAs and analyzed for protein expression 2 days after transfection by immunoblotting (left panel). Quantification of normalized Sp1, HOIP, and SHARPIN protein expression levels (right panel). Data are displayed as mean ± SEM with n = 5 from unpaired two‐tailed Student's t‐tests.
- F
HOIP‐, HOIL‐1L‐, and SHARPIN‐specific mRNAs are decreased in R6/2 striatum. Quantification of mRNA from the striatum of 9‐ to 12‐week‐old R6/2 mice and non‐transgenic littermates. Data are displayed as mean ± SD with n = 6–9 biological replicates from unpaired two‐tailed Student's t‐tests.
- G
HOIP protein levels are decreased in human HD brain. Total protein lysates from human brain (anterior cingulate cortex) were analyzed by immunoblotting using antibodies against HOIP and βIII‐tubulin. HOIP‐positive signals were normalized to βIII‐tubulin. To verify the specificity of the HOIP antibody, WT and HOIP KO HAP1 cells were analyzed in parallel on a different gel. Data are displayed as mean ± SEM with n = 5 for control and n = 7 for HD patients from unpaired two‐tailed Student's t‐tests.
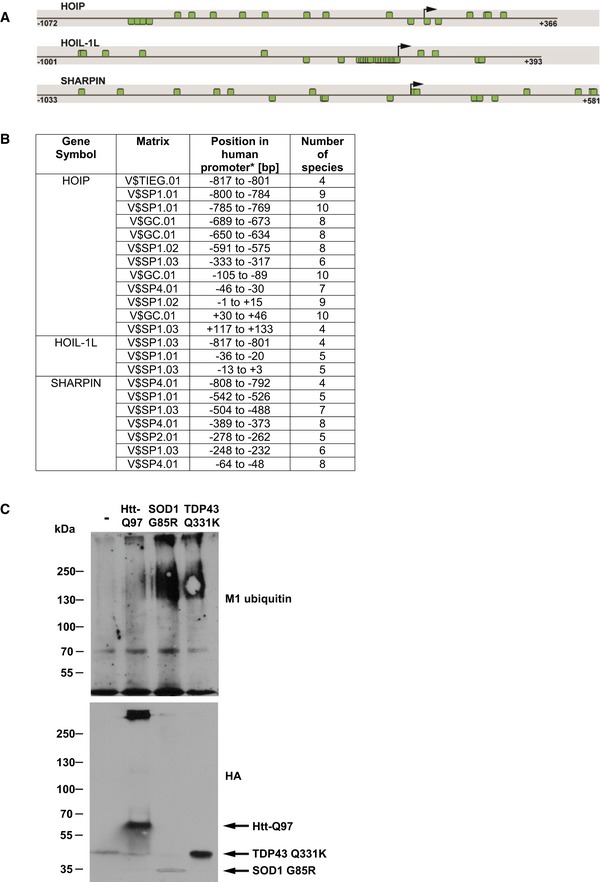
In silico promoter analysis of HOIP, HOIL‐1L, and SHARPIN. Promoter sequence of human HOIP, HOIL‐1L, and SHARPIN showing SP1 binding sites. The black arrow indicates the transcription start site (TSS), and the positions are denoted relative to the TSS. Predicted SP1 binding sites are highlighted by green boxes. Binding sites above each line are located on the plus strand, whereas binding sites below the line are on the minus strand.
Species conservation of V$SP1F binding sites in the promoter sequences of HOIL, HOIL‐1L, and SHARPIN (*relative to the transcriptional start site).
SDS‐insoluble SOD1‐G85R, TDP‐43‐Q331K, and Htt‐Q97‐HA are modified by linear ubiquitin chains. HEK293T cells expressing Htt‐Q97‐HA, SOD1‐G85R‐HA, or TDP‐43‐Q331K‐HA were lysed under denaturing conditions in 1.5% SDS. After centrifugation, the pellets containing the SDS‐insoluble aggregates (SDS‐insoluble fraction) were dissolved in formic acid. Formic acid‐dissolved aggregates were analyzed by immunoblotting using the M1 ubiquitin‐specific 1F11/3F5/Y102L antibody.
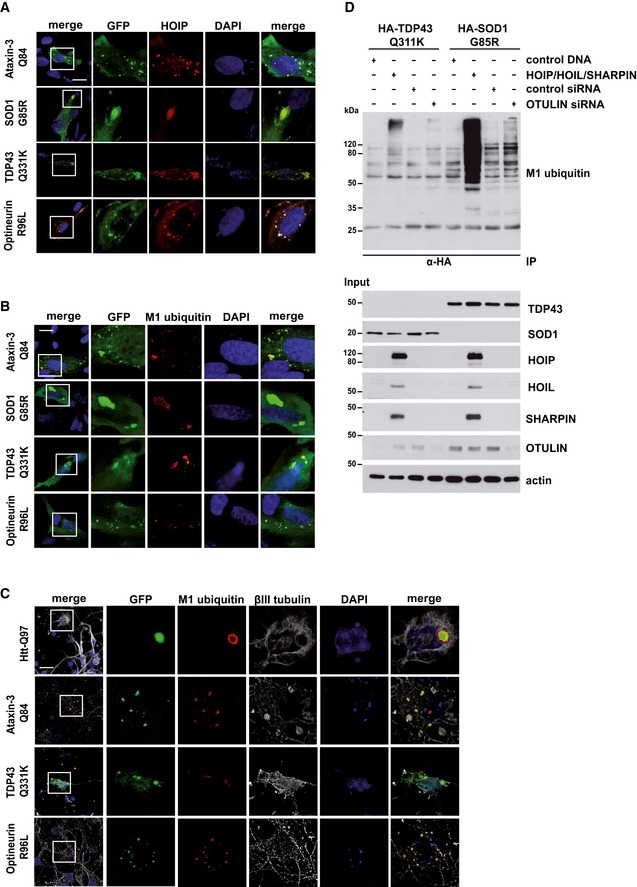
- A
HOIP is recruited to disease‐associated protein aggregates formed by Ataxin‐3‐Q84, SOD1 G85R, TDP‐43 Q331K, or Optineurin R96L. SH‐SY5Y cells co‐expressing disease‐associated proteins (green) and HOIP (red) were analyzed by immunocytochemistry; DAPI (blue). Scale bar, 20 μm.
- B, C
Linear ubiquitin accumulates at disease‐associated protein aggregates under endogenous LUBAC expression. M1‐linked ubiquitin (red) and disease‐associated proteins (green) were analyzed by immunocytochemistry in SH‐SY5Y cells using the 1E3 antibody (Millipore) (B) or primary striatal neurons using the 1F11/3F5/Y102L antibody (Genentech) (C). DAPI (blue). Scale bar, 20 μm.
- D
SDS‐soluble SOD G85R and TDP‐43 Q331K species are modified by linear ubiquitin chains. HEK293T cells were co‐transfected with disease‐associated proteins and either with the plasmids indicated or with control siRNA or OTULIN siRNA. Forty‐eight hours after transfection, cells were lysed under denaturing conditions (1% SDS), followed by immunoprecipitation of SOD G85R and TDP‐43 Q331K via the HA tag (1% Triton X‐100, 0.1% SDS). Immunopurified proteins were detected by Western blotting using the M1 ubiquitin‐specific antibody 1E3.
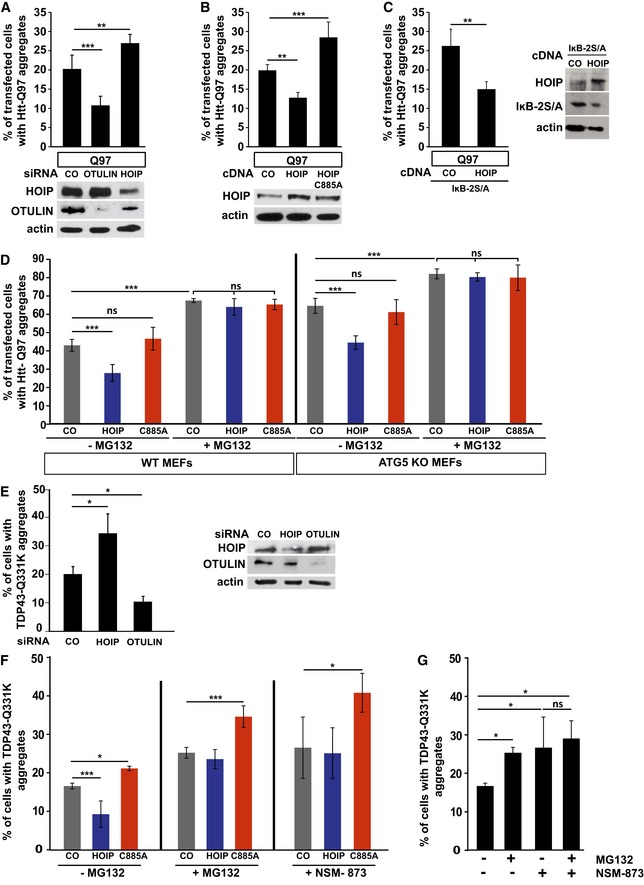
Linear ubiquitination reduces the fraction of cells with Htt‐Q97 aggregates. SH‐SY5Y cells were transfected with Htt‐Q97 and either control siRNA, HOIP siRNA, or OTULIN siRNA. Data are displayed as mean ± SD and were analyzed by one‐way ANOVA followed by Tukey's multiple comparison test, n = 9. Expression levels of HOIP and OTULIN were analyzed by Western blotting.
Linear ubiquitination reduces the fraction of cells with Htt‐Q97 aggregates. SH‐SY5Y cells were transfected with Htt‐Q97 and either WT HOIP or the catalytically inactive HOIP mutant C885A. Data are displayed as mean ± SD and were analyzed by one‐way ANOVA followed by Tukey's multiple comparison test, n = 5. Expression levels of WT and mutant HOIP and OTULIN were analyzed by Western blotting.
The effect of HOIP on Htt‐Q97 aggregation is independent of NF‐κB signaling. SH‐SY5Y cells transiently transfected with Htt‐Q97 and either control vector (CO) or WT HOIP plus the NF‐κB super‐repressor IκB‐2S/A were analyzed by immunocytochemistry. Data are mean ± SD with n = 5 from an unpaired two‐tailed Student's t‐test. Expression levels of WT HOIP and IκB‐2S/A were analyzed by Western blotting.
Catalytically active HOIP decreases the number of cells with Htt‐Q97 aggregates independently of autophagy. WT and ATG5 KO MEFs were transiently transfected with Htt‐Q97‐GFP and either control vector (CO), HOIP, or HOIP C885A. Cells were treated 24 h after transfection with the proteasomal inhibitor MG132 (1 μM, 16 h). Data are displayed as mean ± SD and were analyzed by one‐way ANOVA followed by Tukey's multiple comparison test, n = 7.
Linear ubiquitination reduces the fraction of cells with TDP‐43 Q331K aggregates. SH‐SY5Y cells were transfected with TDP‐43 Q331K and either control siRNA, HOIP siRNA, or OTULIN siRNA. Data are displayed as mean ± SD and were analyzed by Kruskal–Wallis test, followed by Dunn's multiple comparison test, n = 7. Expression levels of HOIP and OTULIN were analyzed by Western blotting.
Catalytically active HOIP decreases the number of cells with TDP‐43 aggregates dependent on proteasomal degradation. SH‐SY5Y cells were transfected with TDP‐43 Q331K and either control vector (CO), HOIP, or HOIP C885A. Cells were treated 48 h after transfection with the proteasomal inhibitor MG132 (1 μM) or the p97/VCP inhibitor NSM‐873 (1 μM) for 3 h. Data are displayed as mean ± SD and were analyzed by one‐way ANOVA followed by Dunnett's multiple comparison test, n = 5.
Inhibition of the proteasome and p97/VCP does not have additive effects on the degradation of misfolded TDP‐43 species. SH‐SY5Y cells expressing TDP‐43 Q331K were treated 48 h after transfection with MG132 (1 μM) and/or NSM‐873 (1 μM) for 3 h. All data are displayed as mean ± SD, and were analyzed by one‐way ANOVA followed by Bonferroni's multiple comparison test, n = 5.
Comment in
-
Lining up for quality control: linear ubiquitin and proteotoxicity.EMBO J. 2019 May 2;38(9):e101985. doi: 10.15252/embj.2019101985. Epub 2019 Apr 11. EMBO J. 2019. PMID: 30975687 Free PMC article.
References
-
- Bennett EJ, Shaler TA, Woodman B, Ryu KY, Zaitseva TS, Becker CH, Bates GP, Schulman H, Kopito RR (2007) Global changes to the ubiquitin system in Huntington's disease. Nature 448: 704–708 - PubMed
-
- van den Boom J, Meyer H (2018) VCP/p97‐mediated unfolding as a principle in protein homeostasis and signaling. Mol Cell 69: 182–194 - PubMed
-
- Cartharius K, Frech K, Grote K, Klocke B, Haltmeier M, Klingenhoff A, Frisch M, Bayerlein M, Werner T (2005) MatInspector and beyond: promoter analysis based on transcription factor binding sites. Bioinformatics 21: 2933–2942 - PubMed
Publication types
MeSH terms
Substances
LinkOut - more resources
Full Text Sources
Medical
Molecular Biology Databases
Research Materials
Miscellaneous
