

Evidence that the human cell cycle is a series of uncoupled, memoryless phases
- PMID: 30886052
- PMCID: PMC6423720
- DOI: 10.15252/msb.20188604
Evidence that the human cell cycle is a series of uncoupled, memoryless phases
Abstract
The cell cycle is canonically described as a series of four consecutive phases: G1, S, G2, and M. In single cells, the duration of each phase varies, but the quantitative laws that govern phase durations are not well understood. Using time-lapse microscopy, we found that each phase duration follows an Erlang distribution and is statistically independent from other phases. We challenged this observation by perturbing phase durations through oncogene activation, inhibition of DNA synthesis, reduced temperature, and DNA damage. Despite large changes in durations in cell populations, phase durations remained uncoupled in individual cells. These results suggested that the independence of phase durations may arise from a large number of molecular factors that each exerts a minor influence on the rate of cell cycle progression. We tested this model by experimentally forcing phase coupling through inhibition of cyclin-dependent kinase 2 (CDK2) or overexpression of cyclin D. Our work provides an explanation for the historical observation that phase durations are both inherited and independent and suggests how cell cycle progression may be altered in disease states.
Keywords: Erlang model; cell cycle; cell‐to‐cell variability; computational systems biology; single‐cell dynamics.
© 2019 The Authors. Published under the terms of the CC BY 4.0 license.
Conflict of interest statement
The authors declare that they have no conflict of interest.
Figures
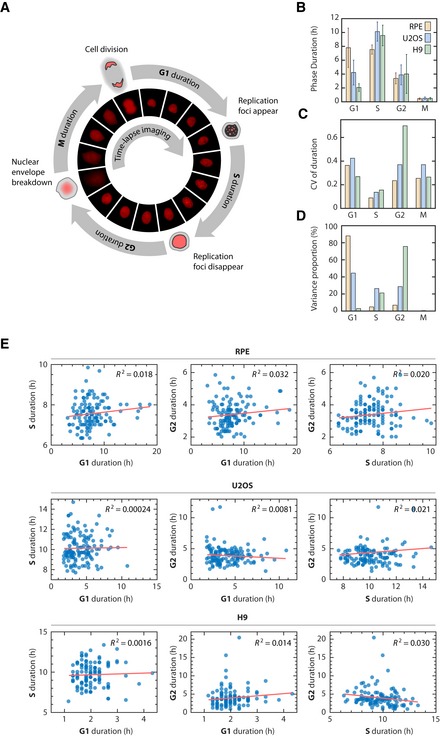
Diagram of the cell cycle composed of G1, S, G2, and M phases (not to scale). Phase durations were quantified by time‐lapse fluorescence microscopy using a PCNA‐mCherry reporter to identify four discrete events during the lifetime of an individual cell (see main text and Materials and Methods). Images were acquired every 10 min.
Mean phase durations in RPE, U2OS, and H9 cell lines. Error bars represent standard deviations.
Coefficient of variation (CV) of phase durations.
Percentage of the total variation in cell cycle duration contributed by individual phases.
Correlations between individual cell cycle phase durations.
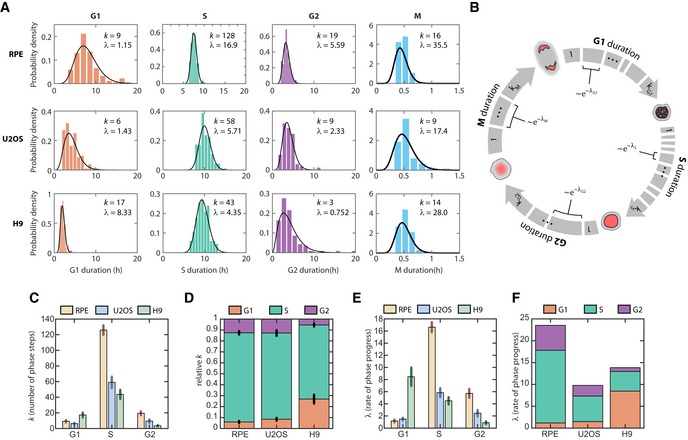
Distributions of cell cycle phase durations for RPE, U2OS, and H9 cells using single‐cell measurements of phase duration reported in Fig 1. Black curves represent fits to Erlang distribution.
Erlang model of cell cycle progression. Each phase consists of a distinct number of steps, k. Each step is a Poisson process with rate parameter, λ. After fitting each phase to the Erlang distribution, we were able to accurately simulate all phase durations except for M phase (2‐sided Kolmogorov–Smirnov test for difference between measured and simulated distributions, Appendix Fig S7B and C).
Fitted shape parameter, k, representing the number of steps for each phase. Error bars represent std from 1,000 bootstraps.
Normalized shape parameter, k, for G1, S, and G2 phases in RPE, U2OS, and H9 cells. Bar height represents the fraction of total cell cycle steps spent in each phase. Error bars represent std from 1,000 bootstraps.
Fitted rate parameter, λ, representing the progression rate of each step within a cell cycle phase. Error bars represent std from 1,000 bootstraps.
Rate parameter λ for each phase, shown by cell type.
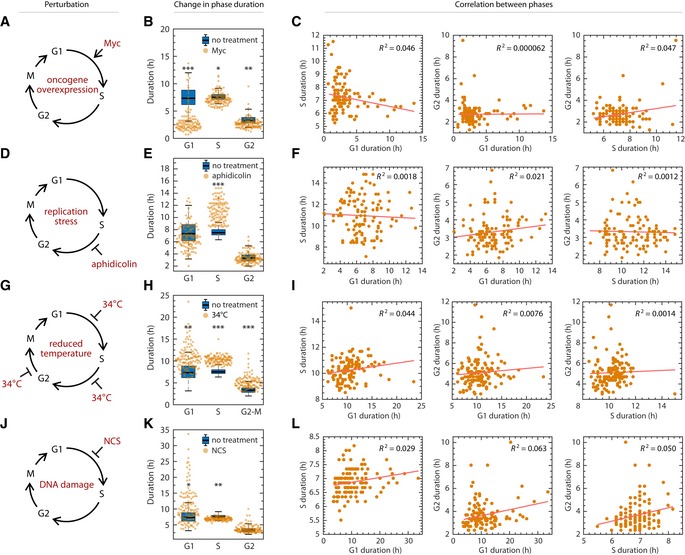
Schematic of shortening G1 by myc overexpression. RPE cells infected with retrovirus harboring a tamoxifen‐inducible myc overexpression construct.
Shift in phase durations of RPE cells overexpressing Myc.
Pairwise correlation between cell cycle phase durations of RPE cells overexpressing Myc.
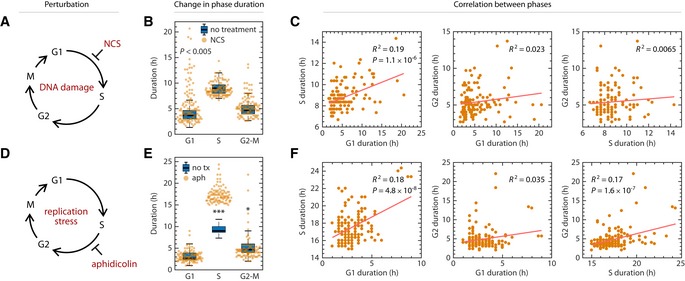
Schematic of prolonging S phase by replication stress using aphidicolin. Asynchronously proliferating RPE cells were treated with 50 ng/ml aphidicolin for 8 h, washed with PBS, and then replenished with fresh media. Only cells whose S phase overlapped with the 8‐h treatment window for at least 1.8 h were analyzed.
Shift in phase durations of RPE cells treated with 50 ng/ml aphidicolin.
Pairwise correlation between cell cycle phase durations under aphidicolin treatment.
Schematic of prolonging all phases by incubating cells at 34°C.
Shift in phase durations of RPE cells incubated at 34°C.
Pairwise correlation between phase durations for cells incubated at 34°C.
Schematic of prolonging G1 by DNA damage using NCS. Asynchronously proliferating RPE mother cells were treated with 25 ng/ml NCS, and their daughter cells were analyzed for a full cell cycle.
Shift in phase durations of RPE cells treated with NCS.
Pairwise correlation between phase durations for cells treated with NCS.
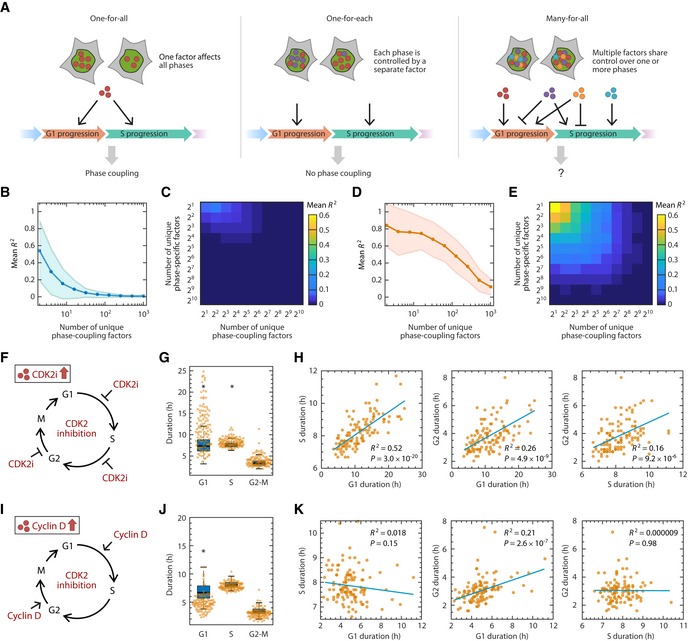
Alternative models for inheritance of molecular factors governing the durations of cell cycle phases.
Simulation of the “strength of coupling” as a function of the number of unique phase‐coupling molecule types under the many‐for‐all model. Each simulation generated 200 cells for which an R 2 value was calculated. R 2 values were averaged across 200 simulations. The shaded area represents the standard deviation of R 2 across the simulations.
Simulation of coupling strength as a function of the number of unique phase‐coupling and phase‐specific factors. Phase‐coupling factors have shared control over a pair of cell cycle phases, whereas phase‐specific factors affect only one cell cycle phase. Strength of coupling is represented by mean R 2 value as in panel (B).
Same as in (B), but simulating the effect of perturbing a single phase‐coupling factor by significantly increasing its abundance or activity. Perturbation was simulated by increasing the abundance of a phase‐coupling factor by 10‐fold.
Same as in (C), but simulating the effect of increasing a phase‐coupling factor by 10‐fold (see Materials and Methods).
Schematic of prolonging all phases by adding CDK2 inhibitor. RPE cells were treated with 2 μM CVT‐313 and the durations of each phase were quantified for a full cell cycle.
Shifts in phase durations for RPE cells treated with 2 μM CVT‐313. A boxplot representing the distributions of durations in untreated cells is underlaid for comparison. Horizontal lines: median; box ranges: 25th to 75th percentiles; error bars: 1.5 interquartile away from the box range. *P < 1 × 10⁻⁵, 2‐sided Kolmogorov–Smirnov test. (n = 117 cells).
Pairwise correlation between cell cycle phase durations upon treatment with CVT‐313. P indicates P‐value from Student's t‐test for Pearson correlation coefficient.
Schematic of shortening phases by overexpression of cyclin D. Cyclin D was overexpressed in RPE cells and the durations of each phase were quantified for a full cell cycle.
Shifts in phase durations for RPE cells overexpressing cyclin D. A boxplot representing the distributions of durations in untreated cells is underlaid for comparison. Horizontal lines: median; box ranges: 25th to 75th percentiles; error bars: 1.5 interquartile away from the box range. *P < 1 × 10⁻⁵, 2‐sided Kolmogorov–Smirnov test. (n = 113 cells).
Pairwise correlation between cell cycle phase durations upon overexpression of cyclin D. P indicates P‐value from Student's t‐test for Pearson correlation coefficient.
Schematic of prolonging G1 by DNA damage using NCS. Asynchronously proliferating U2OS mother cells were treated with 100 ng/ml NCS, and their daughter cells were analyzed for a full cell cycle.
Shift in phase durations of U2OS cells treated with NCS.
Pairwise correlation between phase durations for U2OS cells treated with NCS. P indicates P‐value from Student's t‐test for Pearson correlation coefficient.
Schematic of prolonging S phase by replication stress using aphidicolin. Asynchronously proliferating U2OS cells were treated with 50 ng/ml aphidicolin for 8 h, washed with PBS, and then replenished with fresh media. Only cells whose S phase overlapped with the 8‐h treatment window were analyzed.
Shift in phase durations of U2OS cells treated with 50 ng/ml aphidicolin.
Pairwise correlation between cell cycle phase durations under aphidicolin treatment. P indicates P‐value from Student's t‐test for Pearson correlation coefficient.
Comment in
-
Eternal sunshine of the spotless cycle.Mol Syst Biol. 2019 Apr 5;15(4):e8864. doi: 10.15252/msb.20198864. Mol Syst Biol. 2019. PMID: 30952682 Free PMC article.
Similar articles
-
Caenorhabditis elegans cyclin D/CDK4 and cyclin E/CDK2 induce distinct cell cycle re-entry programs in differentiated muscle cells.PLoS Genet. 2011 Nov;7(11):e1002362. doi: 10.1371/journal.pgen.1002362. Epub 2011 Nov 10. PLoS Genet. 2011. PMID: 22102824 Free PMC article.
-
Cdk2 inhibition prolongs G1 phase progression in mouse embryonic stem cells.Stem Cells Dev. 2010 Feb;19(2):181-94. doi: 10.1089/scd.2009.0065. Stem Cells Dev. 2010. PMID: 19737069
-
Cyclin E-cdk2 activation is associated with cell cycle arrest and inhibition of DNA replication induced by the thymidylate synthase inhibitor Tomudex.Exp Cell Res. 1999 Feb 25;247(1):189-99. doi: 10.1006/excr.1998.4346. Exp Cell Res. 1999. PMID: 10047461
-
[Molecular mechanisms controlling the cell cycle: fundamental aspects and implications for oncology].Cancer Radiother. 2001 Apr;5(2):109-29. doi: 10.1016/s1278-3218(01)00087-7. Cancer Radiother. 2001. PMID: 11355576 Review. French.
-
Cell cycle progression without cyclin E/CDK2: breaking down the walls of dogma.Cancer Cell. 2003 Sep;4(3):160-2. doi: 10.1016/s1535-6108(03)00217-4. Cancer Cell. 2003. PMID: 14522248 Review.
Cited by
-
Mind the replication gap.R Soc Open Sci. 2021 Jun 9;8(6):201932. doi: 10.1098/rsos.201932. R Soc Open Sci. 2021. PMID: 34113447 Free PMC article. Review.
-
Mathematical Modeling Identifies Optimum Palbociclib-fulvestrant Dose Administration Schedules for the Treatment of Patients with Estrogen Receptor-positive Breast Cancer.Cancer Res Commun. 2023 Nov 16;3(11):2331-2344. doi: 10.1158/2767-9764.CRC-23-0257. Cancer Res Commun. 2023. PMID: 37921419 Free PMC article.
-
Impact of variability in cell cycle periodicity on cell population dynamics.PLoS Comput Biol. 2023 Jun 20;19(6):e1011080. doi: 10.1371/journal.pcbi.1011080. eCollection 2023 Jun. PLoS Comput Biol. 2023. PMID: 37339124 Free PMC article.
-
A modular approach for modeling the cell cycle based on functional response curves.PLoS Comput Biol. 2021 Aug 11;17(8):e1009008. doi: 10.1371/journal.pcbi.1009008. eCollection 2021 Aug. PLoS Comput Biol. 2021. PMID: 34379640 Free PMC article.
-
Analysis and modeling of cancer drug responses using cell cycle phase-specific rate effects.Nat Commun. 2023 Jun 10;14(1):3450. doi: 10.1038/s41467-023-39122-z. Nat Commun. 2023. PMID: 37301933 Free PMC article.
References
-
- Absher M, Cristofalo VJ (1984) Analysis of cell division by time‐lapse cinematographic studies of hydrocortisone‐treated embryonic lung fibroblasts. J Cell Physiol 119: 315–319 - PubMed
Publication types
MeSH terms
Substances
Grants and funding
LinkOut - more resources
Full Text Sources
Research Materials
