. 2019 Apr 2;116(14):6938-6943.
doi: 10.1073/pnas.1814700116. Epub 2019 Mar 18.

Gene activation precedes DNA demethylation in response to infection in human dendritic cells

Affiliations

Gene activation precedes DNA demethylation in response to infection in human dendritic cells

Alain Pacis et al. Proc Natl Acad Sci U S A. .

Abstract

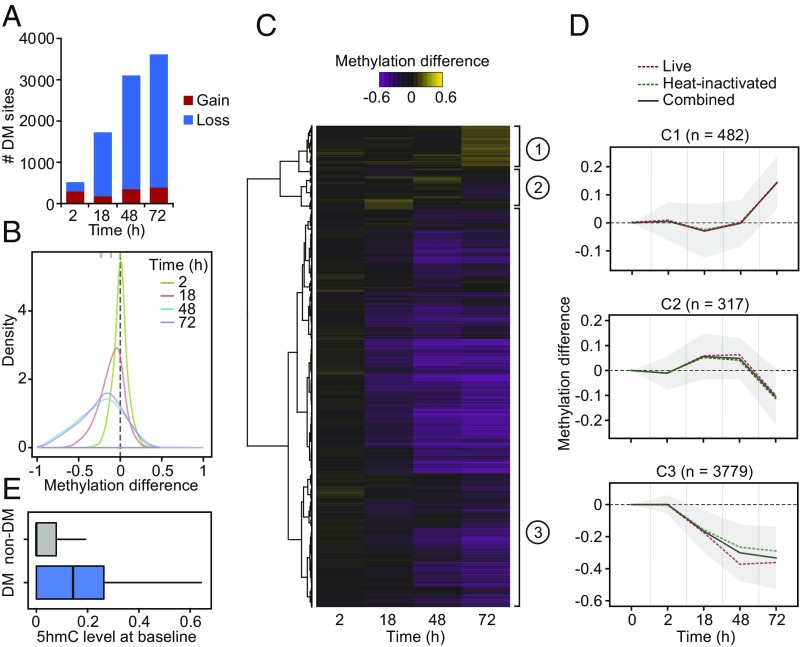
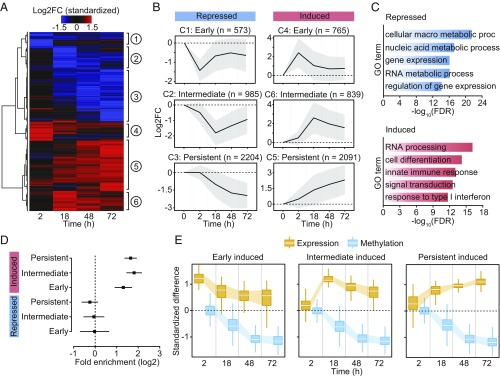
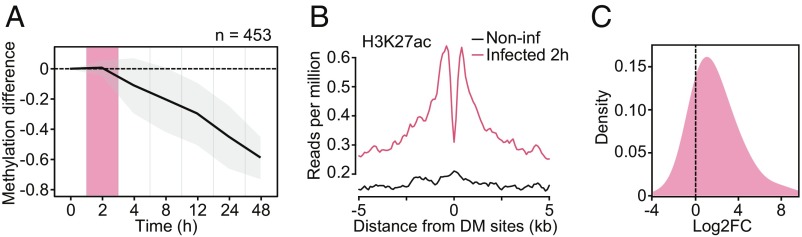
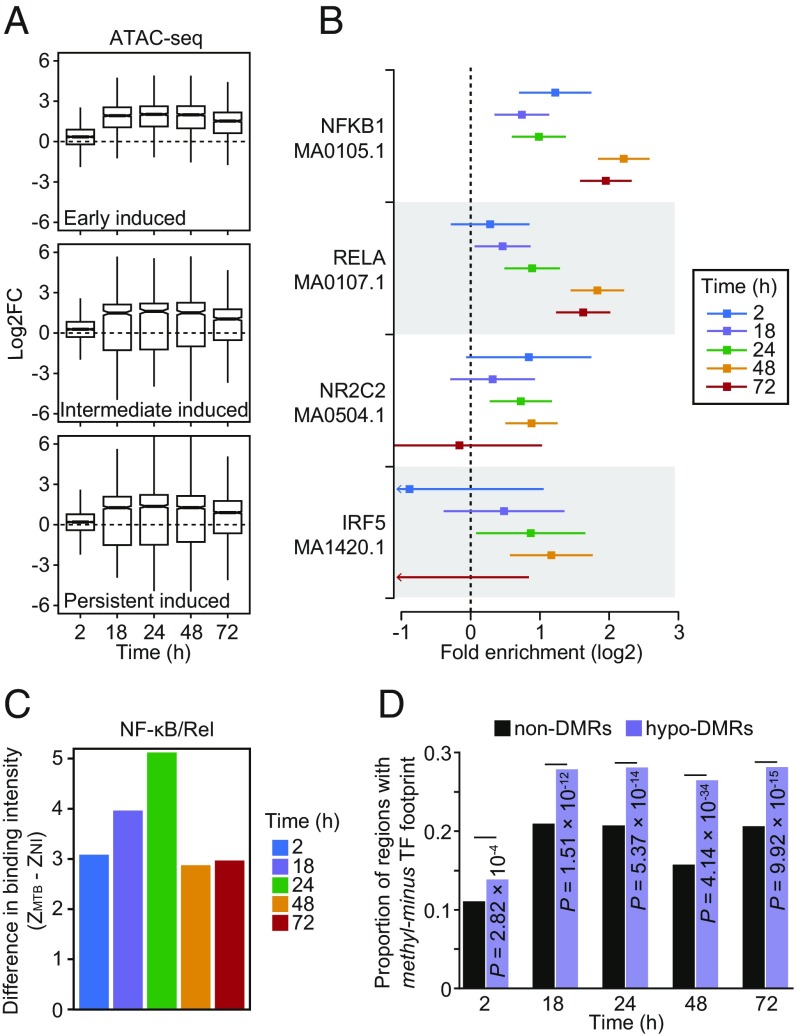
DNA methylation is considered to be a relatively stable epigenetic mark. However, a growing body of evidence indicates that DNA methylation levels can change rapidly; for example, in innate immune cells facing an infectious agent. Nevertheless, the causal relationship between changes in DNA methylation and gene expression during infection remains to be elucidated. Here, we generated time-course data on DNA methylation, gene expression, and chromatin accessibility patterns during infection of human dendritic cells with Mycobacterium tuberculosis We found that the immune response to infection is accompanied by active demethylation of thousands of CpG sites overlapping distal enhancer elements. However, virtually all changes in gene expression in response to infection occur before detectable changes in DNA methylation, indicating that the observed losses in methylation are a downstream consequence of transcriptional activation. Footprinting analysis revealed that immune-related transcription factors (TFs), such as NF-κB/Rel, are recruited to enhancer elements before the observed losses in methylation, suggesting that DNA demethylation is mediated by TF binding to cis-acting elements. Collectively, our results show that DNA demethylation plays a limited role to the establishment of the core regulatory program engaged upon infection.

Keywords: DNA methylation; dendritic cells; epigenetic; immune responses; tuberculosis.


Conflict of interest statement

The authors declare no conflict of interest.

Figures

Fig. 1.
Fig. 1.
(A) Barplots showing the number of differentially methylated (DM) CpG sites identified at a |methylation difference| > 10% and FDR < 0.01 (y-axis) at each time point after MTB infection (2, 18, 48, and 72 h [h]) (x-axis). (B) Distribution of differences in methylation between infected and noninfected cells at DM sites, at each time point. (C) Heatmap of differences in methylation constructed using unsupervised hierarchical clustering of the 4,578 DM sites (identified at any time point using live and heat-inactivated MTB-infected samples combined; y-axis) across four time points after infection, which shows three distinct patterns of changes in methylation. (D) Mean differences in methylation of CpG sites in each cluster across all time points; shading denotes ±1 SD. For visualization purposes, we also show the 0h time point, where we expect no changes in methylation. (E) Boxplots comparing the distribution of 5hmC levels in noninfected DCs between non-DM and DM sites (Cluster 3).
Fig. 2.
Fig. 2.
(A) Heatmap of differences in expression (standardized logtwofold changes) constructed using unsupervised hierarchical clustering of the 7,457 differentially expressed genes (identified at any time point) across four time points after MTB infection. (B) Mean logtwofold expression changes of genes in each cluster across all time points; shading denotes ±1 SD. For visualization purposes, we also show the 0 h time point, where we expect no changes in expression. (C) Gene ontology enrichment analyses among genes that are repressed or induced in response to MTB infection. (D) Enrichment (in log2; x-axis) of differentially expressed genes associated with differentially methylated CpG sites (Cluster 3). Error bars show 95% confidence intervals for the enrichment estimates. (E) Boxplots showing the distribution of standardized differences in methylation of DM sites in Cluster 3 (blue) along with the corresponding standardized differences in expression of the associated genes (orange), across all time points.
Fig. 3.
Fig. 3.
(A) Mean differences in methylation (y-axis) in CpG sites that show stable losses of methylation (similar to Cluster 3 DM sites in Fig. 1 C and D; n = 453) in Salmonella-infected macrophages, across six time points after infection (2, 4, 8, 12, 24, and 48 h [h]; x-axis). Shading denotes ±1 SD. For visualization purposes, we also show the 0 h time point, where we expect no changes in methylation. (B) Composite plots of patterns of H3K27ac ChIP-seq signals ±5 kb around the midpoints of hypomethylated sites (x-axis) in macrophages at 2 h postinfection with Salmonella. (C) Distribution of logtwofold expression changes (between noninfected and Salmonella-infected macrophages at 2 h) for genes associated with DM sites in A (n = 269).
Fig. 4.
Fig. 4.
(A) Boxplots showing the distribution of logtwofold changes in chromatin accessibility between noninfected and MTB-infected DCs across the five time points of infection (2, 4, 18, 24, 48, and 72 h) for open chromatin regions associated with the three classes of induced genes described in Fig. 2 A and B. (B) TF binding motifs for which the number of well-supported footprints (posterior probability > 0.99) within hypomethylated regions (i.e., the combined set of DM sites for all four time-points) were enriched (FDR < 0.01) relative to non-DMRs (with 250 bp flanking the start and end) in MTB-infected DCs. The enrichment factors (x-axis) are shown in a log2 scale and error bars reflect the 95% confidence intervals. A complete list of all TF binding motifs for which footprints are enriched within hypomethylated regions can be found in Dataset S5. (C) Barplots showing significant differences in TF occupancy score predictions for NF-κB/Rel motifs between MTB-infected and noninfected DCs (ZMTB − ZNI; y-axis; see Materials and Methods) across all time points (x-axis). A positive Z-score difference indicates increased TF binding in hypomethylated regions after MTB infection. (D) Proportion of regions that overlap a methylation-sensitive (“methyl-minus”; reported in Yin et al. [33]) TF footprint (y-axis) observed among non-DMRs and hypomethylated regions (or hypo-DMRs; see Materials and Methods).

References

    1. Medzhitov R, Horng T. Transcriptional control of the inflammatory response. Nat Rev Immunol. 2009;9:692–703. - PubMed
    1. Smale ST. Selective transcription in response to an inflammatory stimulus. Cell. 2010;140:833–844. - PMC - PubMed
    1. Smale ST, Tarakhovsky A, Natoli G. Chromatin contributions to the regulation of innate immunity. Annu Rev Immunol. 2014;32:489–511. - PubMed
    1. Bierne H, Hamon M, Cossart P. Epigenetics and bacterial infections. Cold Spring Harb Perspect Med. 2012;2:a010272. - PMC - PubMed
    1. Pacis A, et al. Bacterial infection remodels the DNA methylation landscape of human dendritic cells. Genome Res. 2015;25:1801–1811. - PMC - PubMed

Publication types