

Breast cancer cells exhibits specific dielectric signature in vitro using the open-ended coaxial probe technique from 200 MHz to 13.6 GHz
- PMID: 30886170
- PMCID: PMC6423298
- DOI: 10.1038/s41598-019-41124-1
Breast cancer cells exhibits specific dielectric signature in vitro using the open-ended coaxial probe technique from 200 MHz to 13.6 GHz
Abstract
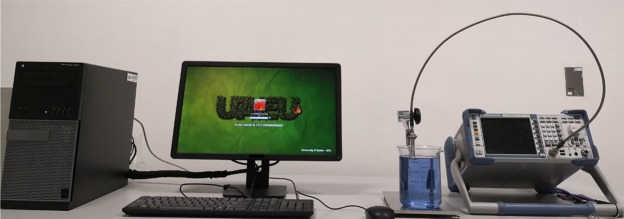
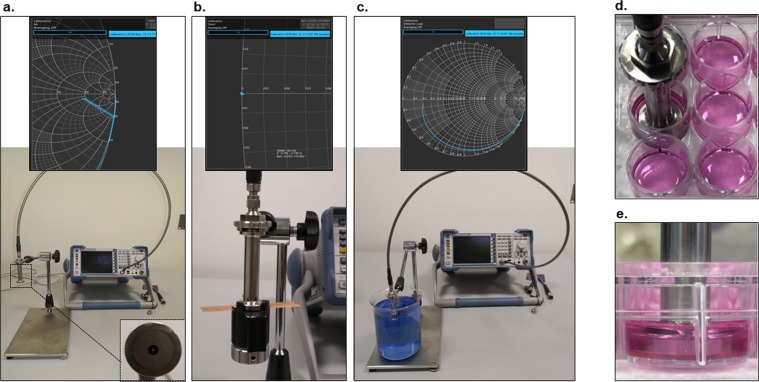
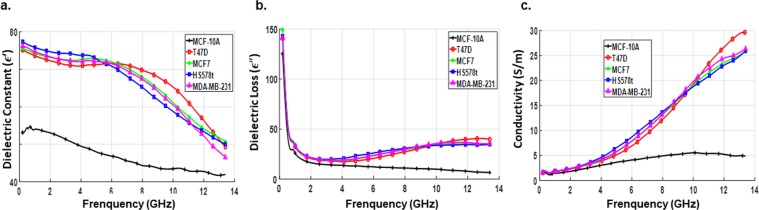
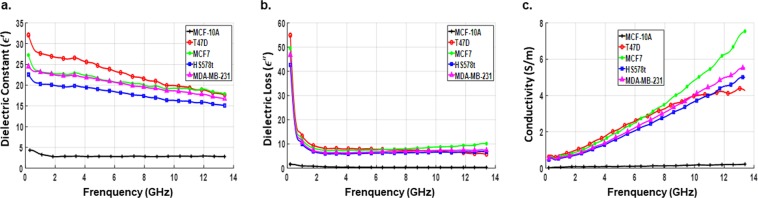
Here we investigated the feasibility of using microwave spectroscopy for characterization of normal and breast cancer cell lines cultured in vitro. Healthy non-tumorigenic, MCF-10A and breast cancer, MDA-MB-231, Hs578T, T47D and MCF-7 cell lines were electrically characterized using the open-ended coaxial probe technique from 200 MHz to 13.6 GHz. The dielectric constant, dielectric loss and conductivity between breast non-tumorigenic and breast cancer cells lines were analyzed and their differences determined. Our results showed that the four breast cancer cell lines analyzed exhibited higher dielectric properties when compared to healthy cells. Interestingly, we found that breast and colon cancer cells have different dielectric properties as well, thus suggesting that each type of cancer has a unique microwave signature. This study shows that microwave characterization of breast cancer cell lines is reliable with potential in biomedical applications such as designing electromagnetic models for detection of tumorous cells in healthy tissues.
Conflict of interest statement
The authors declare no competing interests.
Figures


Similar articles
-
Dielectric properties for non-invasive detection of normal, benign, and malignant breast tissues using microwave theories.Thorac Cancer. 2018 Apr;9(4):459-465. doi: 10.1111/1759-7714.12605. Epub 2018 Feb 21. Thorac Cancer. 2018. PMID: 29465782 Free PMC article.
-
In Vivo Dielectric Properties of Healthy and Benign Rat Mammary Tissues from 500 MHz to 18 GHz.Sensors (Basel). 2020 Apr 14;20(8):2214. doi: 10.3390/s20082214. Sensors (Basel). 2020. PMID: 32295215 Free PMC article.
-
A large-scale study of the ultrawideband microwave dielectric properties of normal, benign and malignant breast tissues obtained from cancer surgeries.Phys Med Biol. 2007 Oct 21;52(20):6093-115. doi: 10.1088/0031-9155/52/20/002. Epub 2007 Oct 1. Phys Med Biol. 2007. PMID: 17921574
-
Machine learning aided diagnosis of hepatic malignancies through in vivo dielectric measurements with microwaves.Phys Med Biol. 2016 Jul 7;61(13):5089-5102. doi: 10.1088/0031-9155/61/13/5089. Epub 2016 Jun 20. Phys Med Biol. 2016. PMID: 27321132
-
Ultra-Wideband (UWB) Antenna Sensor Based Microwave Breast Imaging: A Review.Sensors (Basel). 2018 Sep 5;18(9):2951. doi: 10.3390/s18092951. Sensors (Basel). 2018. PMID: 30189633 Free PMC article. Review.
Cited by
-
Water Dynamics in Cancer Cells: Lessons from Quasielastic Neutron Scattering.Medicina (Kaunas). 2022 May 12;58(5):654. doi: 10.3390/medicina58050654. Medicina (Kaunas). 2022. PMID: 35630072 Free PMC article. Review.
-
Metamaterial-based Artificial magnetic conductor for efficient breast cancer diagnosis using a low-cost antenna array.Sci Rep. 2024 Nov 16;14(1):28262. doi: 10.1038/s41598-024-79666-8. Sci Rep. 2024. PMID: 39550412 Free PMC article.
-
Machine Learning-Based Classification of Abnormal Liver Tissues Using Relative Permittivity.Sensors (Basel). 2022 Dec 16;22(24):9919. doi: 10.3390/s22249919. Sensors (Basel). 2022. PMID: 36560303 Free PMC article.
-
Real-Time Differentiation Between Benign and Malignant Breast Tumors and Other Tissues Using Dielectric Properties.Med Sci Monit. 2025 Jun 17;31:e947531. doi: 10.12659/MSM.947531. Med Sci Monit. 2025. PMID: 40526582 Free PMC article.
-
Low-Cost Antenna-Array-Based Metamaterials for Non-Invasive Early-Stage Breast Tumor Detection in the Human Body.Biosensors (Basel). 2022 Oct 5;12(10):828. doi: 10.3390/bios12100828. Biosensors (Basel). 2022. PMID: 36290965 Free PMC article.
References
-
- Foster KR, Schwan HP. Dielectric properties of tissues and biological materials: a critical review. Crit. Rev. Biomed. Eng. 1989;17:25–104. - PubMed
-
- Stuchly M, Athey T, Samaras G, Taylor G. Measurement of Radio Frequency Permittivity of Biological Tissues with an Open-Ended Coaxial Line: Part II - Experimental Results. IEEE Trans. Microw. Theory Tech. 1982;30:87–92. doi: 10.1109/TMTT.1982.1131022. - DOI
Publication types
MeSH terms
Substances
LinkOut - more resources
Full Text Sources
Medical
Miscellaneous
