

Tracing recombinant bovine somatotropin ab(use) through transcriptomics: the potential of bovine somatic cells in a multi-dose longitudinal study
- PMID: 30886250
- PMCID: PMC6423037
- DOI: 10.1038/s41598-019-41343-6
Tracing recombinant bovine somatotropin ab(use) through transcriptomics: the potential of bovine somatic cells in a multi-dose longitudinal study
Abstract
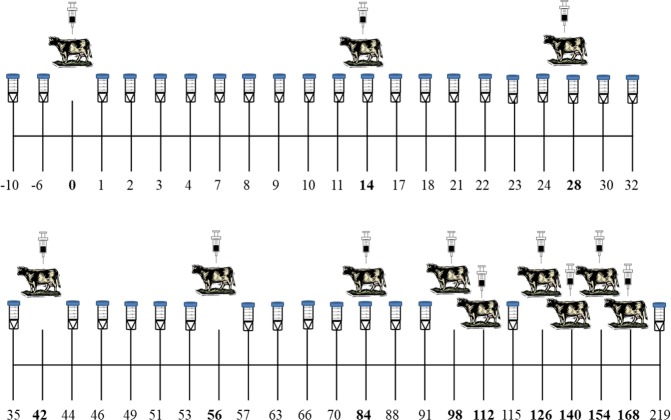
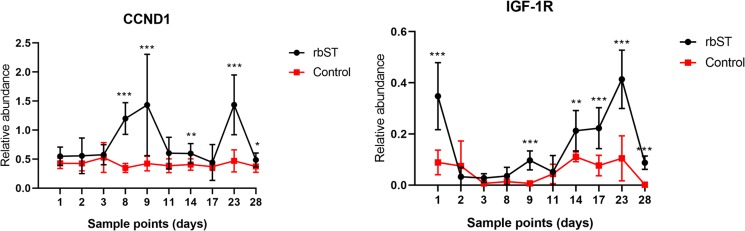
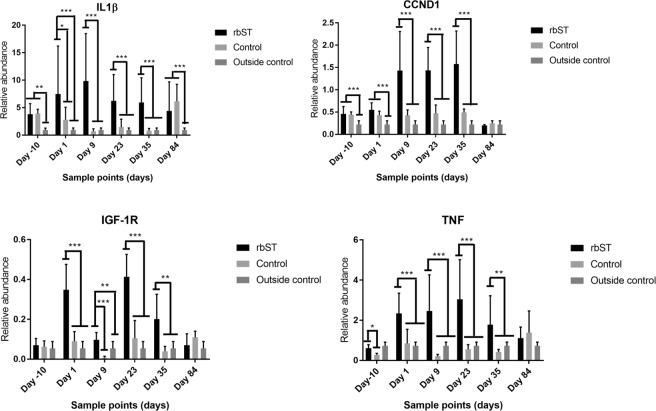
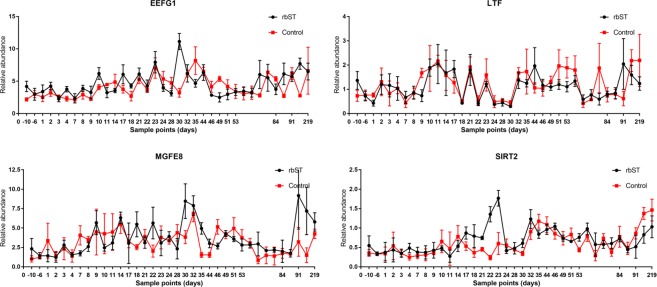
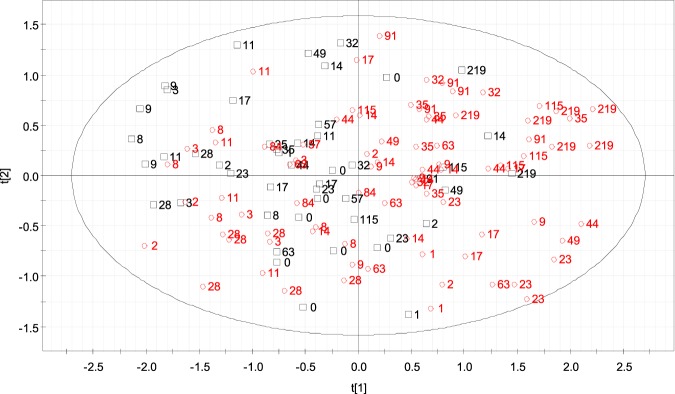
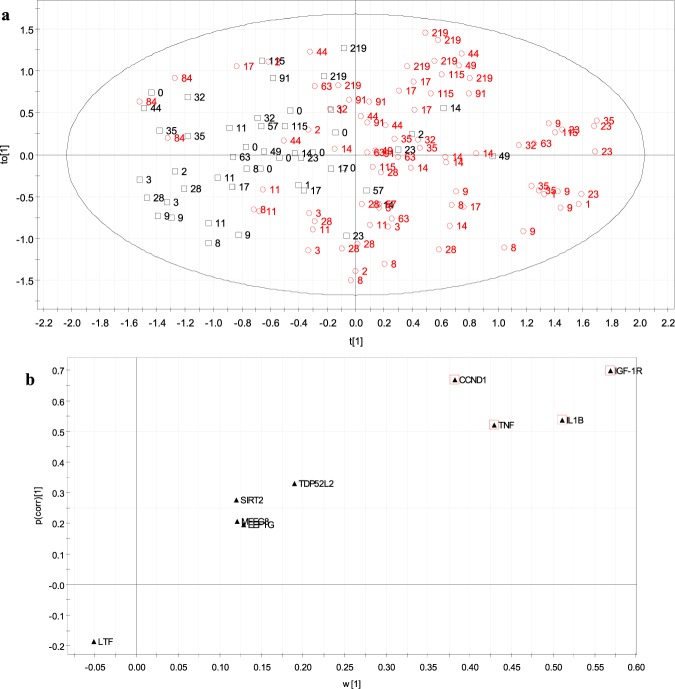
In the European Union, the use of recombinant bovine somatotropin (rbST) in dairy cattle is forbidden. Monitoring rbST (ab)use by its direct detection in animal matrices still remains a challenging task. New monitoring methods based on indirect detection of the substance are necessary. A new transcriptomic system based on the use of high-throughput real-time PCR in combination with somatic cells was developed to control rbST administration in dairy animals. A total of nine cows, separated into control and rbST-treated groups, were included in the study. A subcutaneous injection containing 500 mg of rbST was administered to the treated group every 14 days, up to a total of 12 doses. Milk somatic cells (MSCs) were sampled from each animal at different time points throughout 8 months of study. It was possible to obtain the transcriptomic profile of 18 genes in MSCs of rbST-treated and control groups, and using univariate and multivariate statistical analysis control and treated animals were discriminated. The transcription of CCND1, IGF-1R, TNF and IL-1β genes resulted strongly influenced by rbST treatment. The combination of MSCs, transcriptomic tools and statistical analysis has allowed the selection of four genes as potential biomarkers that could be used in a transcriptomic panel for monitoring rbST administration in cows.
Conflict of interest statement
The authors declare no competing interests.
Figures
References
-
- Asimov G, Krouze N. The lactogenic preparations from the anterior pituitary and the increase of milk yield in cows. J. Dairy Sci. 1937;20:289–306. doi: 10.3168/jds.S0022-0302(37)95698-4. - DOI
-
- Folley S, Young F. The effect of anterior pituitary extracts on established lactation in the cow. Proc. R. Soc. Lond., B, Biol. Sci. 1938;126:45–76. doi: 10.1098/rspb.1938.0046. - DOI
-
- Young F. Experiemental stimulation (galactopoiesis) of lactation. Br. Med. Bull. 1947;5:155–160. doi: 10.1093/oxfordjournals.bmb.a073125. - DOI
-
- Burton JL, McBride BW, Block E, Glimm DR, Kennelly JJ. A review of bovine growth hormone. Can. J. Anim. Sci. 1994;74:167–201. doi: 10.4141/cjas94-027. - DOI
Publication types
MeSH terms
Substances
LinkOut - more resources
Full Text Sources
Research Materials
