. 2019 Apr;3(4):668-678.
doi: 10.1038/s41559-019-0834-1. Epub 2019 Mar 18.

Megaphylogeny resolves global patterns of mushroom evolution

Torda Varga  1 Krisztina Krizsán  1 Csenge Földi  1 Bálint Dima  2 Marisol Sánchez-García  3 Santiago Sánchez-Ramírez  4 Gergely J Szöllősi  5 János G Szarkándi  6 Viktor Papp  7 László Albert  8 William Andreopoulos  9 Claudio Angelini  10   11 Vladimír Antonín  12 Kerrie W Barry  9 Neale L Bougher  13 Peter Buchanan  14 Bart Buyck  15 Viktória Bense  1 Pam Catcheside  16 Mansi Chovatia  9 Jerry Cooper  17 Wolfgang Dämon  18 Dennis Desjardin  19 Péter Finy  20 József Geml  21 Sajeet Haridas  9 Karen Hughes  22 Alfredo Justo  3 Dariusz Karasiński  23 Ivona Kautmanova  24 Brigitta Kiss  1 Sándor Kocsubé  6 Heikki Kotiranta  25 Kurt M LaButti  9 Bernardo E Lechner  26 Kare Liimatainen  27 Anna Lipzen  9 Zoltán Lukács  28 Sirma Mihaltcheva  9 Louis N Morgado  21   29 Tuula Niskanen  27 Machiel E Noordeloos  21 Robin A Ohm  30 Beatriz Ortiz-Santana  31 Clark Ovrebo  32 Nikolett Rácz  6 Robert Riley  9 Anton Savchenko  33   34 Anton Shiryaev  35 Karl Soop  36 Viacheslav Spirin  33 Csilla Szebenyi  6   37 Michal Tomšovský  38 Rodham E Tulloss  39   40 Jessie Uehling  41 Igor V Grigoriev  9   42 Csaba Vágvölgyi  6 Tamás Papp  6   37 Francis M Martin  43 Otto Miettinen  33 David S Hibbett  3 László G Nagy  44
Affiliations

Megaphylogeny resolves global patterns of mushroom evolution

Torda Varga et al. Nat Ecol Evol. 2019 Apr.

Abstract

Mushroom-forming fungi (Agaricomycetes) have the greatest morphological diversity and complexity of any group of fungi. They have radiated into most niches and fulfil diverse roles in the ecosystem, including wood decomposers, pathogens or mycorrhizal mutualists. Despite the importance of mushroom-forming fungi, large-scale patterns of their evolutionary history are poorly known, in part due to the lack of a comprehensive and dated molecular phylogeny. Here, using multigene and genome-based data, we assemble a 5,284-species phylogenetic tree and infer ages and broad patterns of speciation/extinction and morphological innovation in mushroom-forming fungi. Agaricomycetes started a rapid class-wide radiation in the Jurassic, coinciding with the spread of (sub)tropical coniferous forests and a warming climate. A possible mass extinction, several clade-specific adaptive radiations and morphological diversification of fruiting bodies followed during the Cretaceous and the Paleogene, convergently giving rise to the classic toadstool morphology, with a cap, stalk and gills (pileate-stipitate morphology). This morphology is associated with increased rates of lineage diversification, suggesting it represents a key innovation in the evolution of mushroom-forming fungi. The increase in mushroom diversity started during the Mesozoic-Cenozoic radiation event, an era of humid climate when terrestrial communities dominated by gymnosperms and reptiles were also expanding.


Conflict of interest statement

Competing interests: Authors declare no competing interests.

Figures

Figure 1
Figure 1
Phylogenetic relationships and diversification across 5,284 mushroom-forming fungi. One of the 245 analyzed maximum likelihood trees was randomly chosen and visualized. Trees were inferred from nrLSU, rpb2, ef1-a sequences with a phylogenomic backbone constraint of deep nodes. Branches are colored by net diversification (speciation minus extinction) rate inferred in BAMM. Warmer colors denote a higher rate of diversification. Significant shifts in diversification rate are shown by triangles at nodes. Only shifts present on >50% of 10 analyzed trees, with a Bayesian posterior probability >0.5 and a posterior odds ratio >5 are shown. See Data 6 for detailed discussion of shifts. Reconstructed probabilities of ancestral plant hosts for order-level clades are shown as pie charts partitioned by the inferred ancestral probability for gymnosperm (green) and angiosperm host (black). Pie charts are given for the most recent common ancestors of each order plus backbone nodes within the Agaricales – for small orders see Supplementary Data 3. Inner and outer bars around the tree denote extant substrate preference (black – angiosperm, green – gymnosperm, grey – generalist) and the placement of species used for inferring the 650-gene phylogenomic backbone phylogeny. Geological time scale is indicated with gray/white concentric rings.
Figure 2
Figure 2
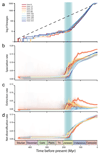
Patterns of diversification of mushroom-forming fungi through time. (a) lineages through time plot, showing the log number of lineages through time, (b) speciation rate, (c) extinction rate and (d) net diversification rate through geologic time estimated using BAMM on ten chronograms comprising 5,284-species. 95% confidence intervals of rate estimates are shown by shaded areas. The Jurassic period is shaded in green.
Figure 3
Figure 3
The evolution of morphological and nutritional traits of mushrooms through time. (a) the evolution of substrate association through geologic time (top) and the evolution of vascular plant diversity and O2/CO2 levels (bottom, adapted from Niklas and Berner. Plot created the as in Fig3/a. (b) the evolution of fruiting body types through time and the radiation of the agaricoid morphology since the Jurassic. Inferred ancestral probabilities of fruiting body types were summarized across the 10 phylogenies, by splitting the time scale of each tree into 100 bins and summing probabilities across the tree. For details of character coding and ancestral state reconstructions and detailed results, see Supplementary Note 5. (c) schematic model of the evolution of pileate-stipitate morphologies. The posterior distribution of transition rates from non-pileate (left) towards pileate-stipitate forms (right) and vice versa are shown above the arrows. Rates were estimated by MCMC in BayesTraits. (d) posterior distribution of trait-dependent speciation and extinction rates estimated under the binary state speciation and extinction model for non-pileate vs pileate-stipitate fruiting body morphologies.

References

    1. Jetz W, Pyron RA. The interplay of past diversification and evolutionary isolation with present imperilment across the amphibian tree of life. Nat Ecol Evol. 2018;2:850–858. - PubMed
    1. Jetz W, Thomas GH, Joy JB, Hartmann K, Mooers AO. The global diversity of birds in space and time. Nature. 2012;491:444–448. - PubMed
    1. Rabosky DL, et al. Rates of speciation and morphological evolution are correlated across the largest vertebrate radiation. Nat Commun. 2013;4 1958. - PubMed
    1. Alfaro ME, et al. Explosive diversification of marine fishes at the Cretaceous–Palaeogene boundary. Nat Ecol Evol. 2018;2:688–696. - PubMed
    1. Alfaro ME, et al. Nine exceptional radiations plus high turnover explain species diversity in jawed vertebrates. Proc Natl Acad Sci U S A. 2009;106:13410–4. - PMC - PubMed

Publication types