. 2019 Apr;22(4):669-679.
doi: 10.1038/s41593-019-0350-2. Epub 2019 Mar 18.

Cerebral organoids at the air-liquid interface generate diverse nerve tracts with functional output

Affiliations

Cerebral organoids at the air-liquid interface generate diverse nerve tracts with functional output

Stefano L Giandomenico et al. Nat Neurosci. 2019 Apr.

Abstract

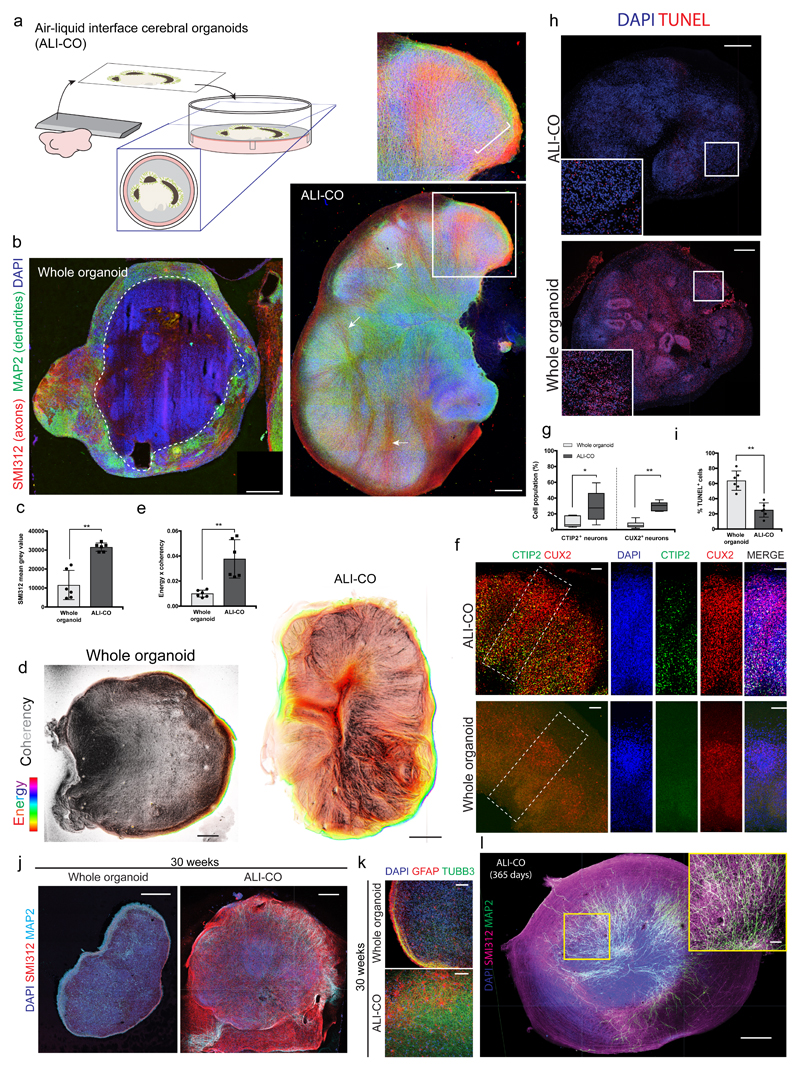
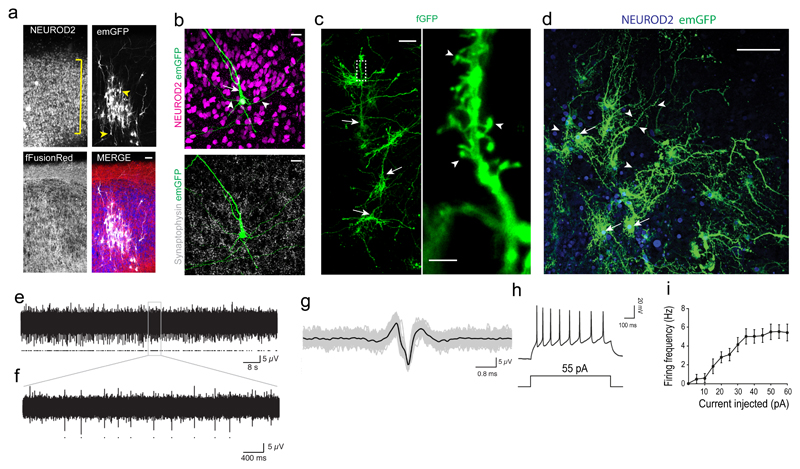
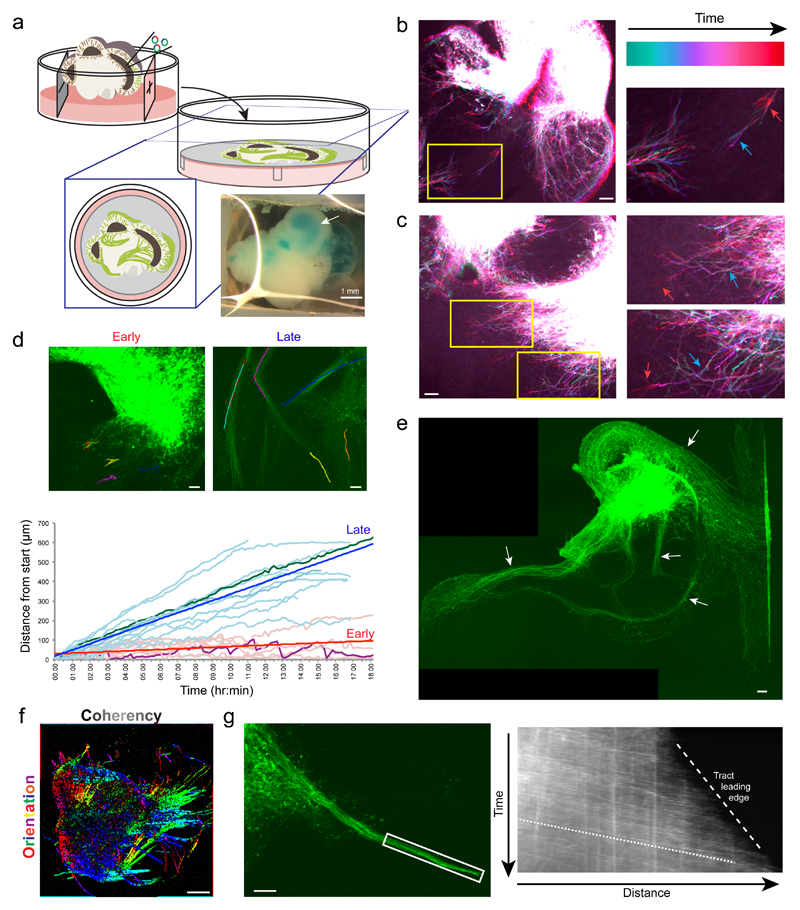
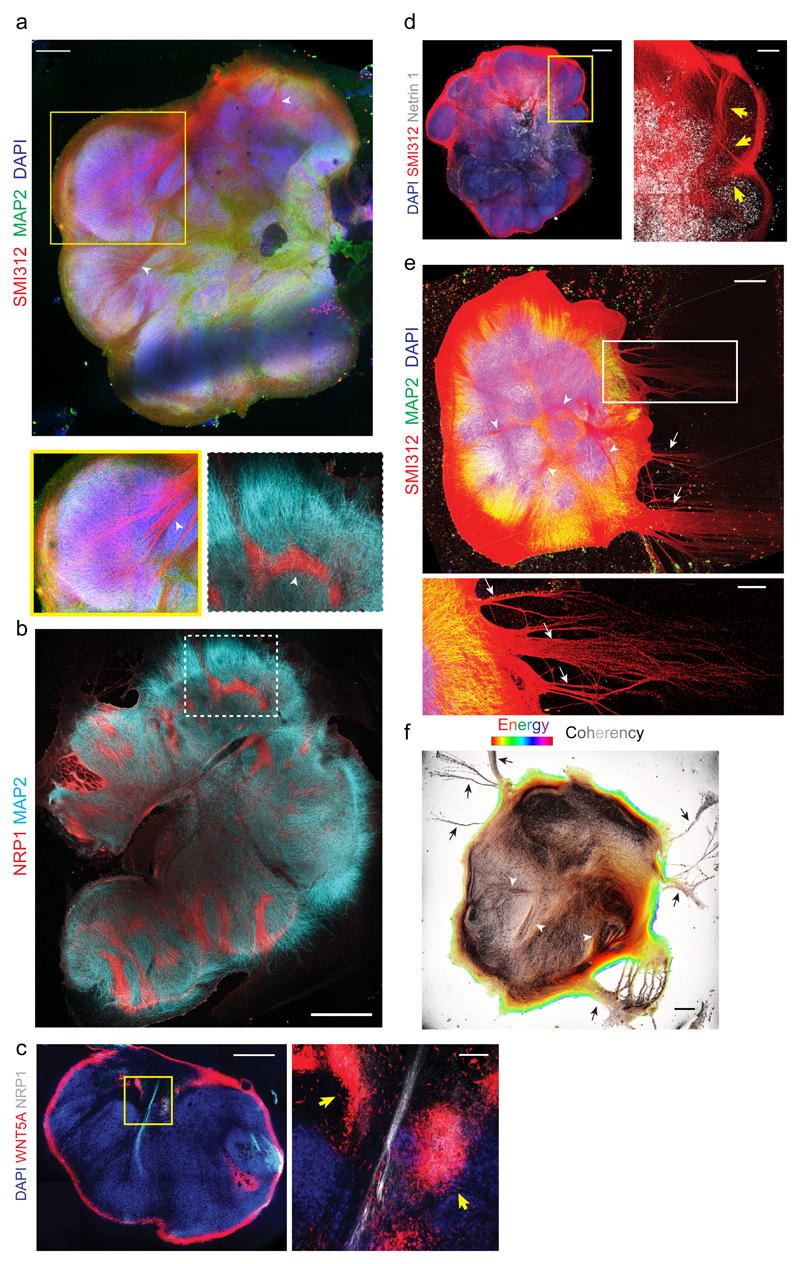
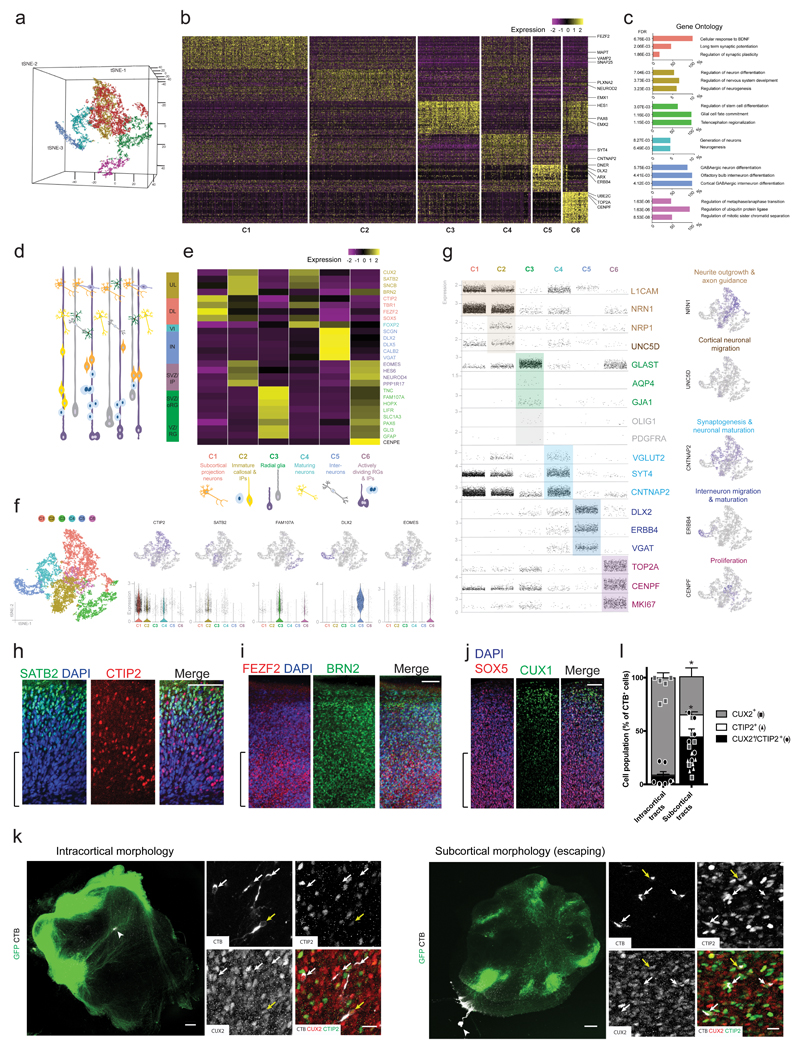
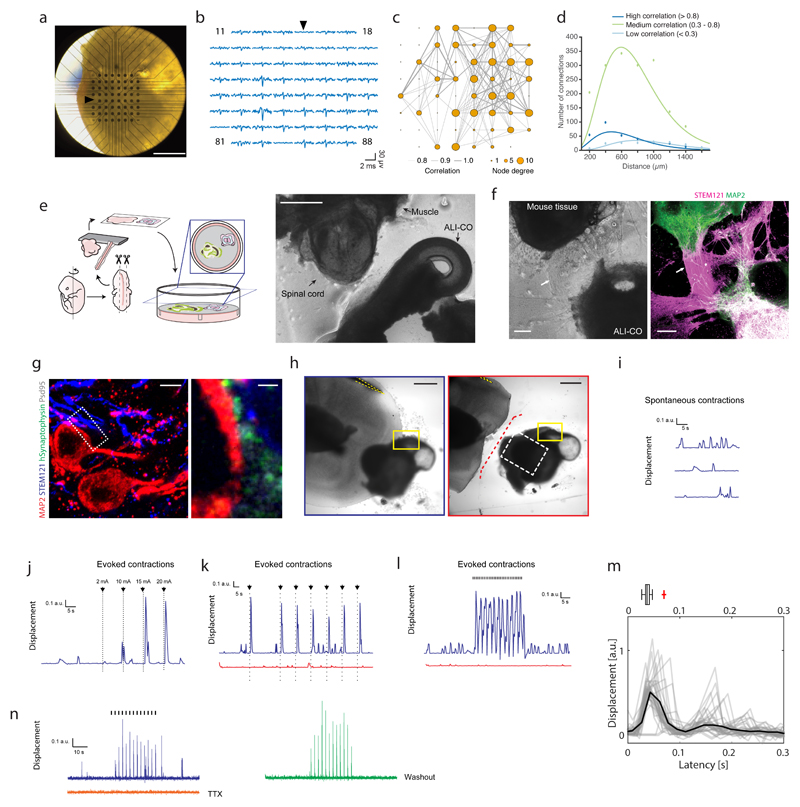
Neural organoids have the potential to improve our understanding of human brain development and neurological disorders. However, it remains to be seen whether these tissues can model circuit formation with functional neuronal output. Here we have adapted air-liquid interface culture to cerebral organoids, leading to improved neuronal survival and axon outgrowth. The resulting thick axon tracts display various morphologies, including long-range projection within and away from the organoid, growth-cone turning, and decussation. Single-cell RNA sequencing reveals various cortical neuronal identities, and retrograde tracing demonstrates tract morphologies that match proper molecular identities. These cultures exhibit active neuronal networks, and subcortical projecting tracts can innervate mouse spinal cord explants and evoke contractions of adjacent muscle in a manner dependent on intact organoid-derived innervating tracts. Overall, these results reveal a remarkable self-organization of corticofugal and callosal tracts with a functional output, providing new opportunities to examine relevant aspects of human CNS development and disease.


Conflict of interest statement

Declaration of competing financial interests

The authors declare no competing financial interests.

Figures

Figure 1
Figure 1. Culture at the air-liquid interface leads to improved neuronal survival and morphology
a. Schematic of the culture paradigm as detailed in methods. b. Immunohistochemistry for the marker SMI312 (red) to stain axons, and MAP2 (green) for dendrites, on representative sections of whole versus ALI cerebral organoid cultures. ALI-CO age is 82 days total (sliced at 61 days plus 21 days at ALI). Whole organoid age is 90 days. Dashed line indicates the border of healthy neurons along the organoid surface. Inset shows a higher magnification of a lobule containing radially aligned neurons of the cortical plate (bracket) and arrows indicate SMI312 positive inward projecting tracts. c. Quantification of overall SMI312 levels reveals increased axon staining in ALI-COs **P=0.0022 Two-tailed Mann-Whitney test, n = 6 whole organoids from 2 independent batches (ages: 90-105d) and 6 ALI-COs from 2 independent batches (ages: 85-92d), error bars are S.D. d. Whole organoids exhibit less aligned axon staining as demonstrated by OrientationJ analysis (detailed in methods) of SMI312 staining (Supplementary Fig. 1a), while axons in ALI-COs are more aligned. Pixel brightness corresponds to coherency of aligned structures while hue corresponds to energy, where pixels with higher energy report less isotropic and more oriented structures. Shown are representative images out of six samples from two independent batches each. e. The product of OrientationJ coherency and energy output levels was quantified in whole organoids compared with ALI-COs, demonstrating more aligned structures. **P<0.0022 Two-tailed Mann-Whitney test, n = 6 for each (same samples quantified as in c.), error bars are S.D. f. Staining for deep layer (CTIP2+) and upper layer (CUX2+) neurons reveals increased numbers of both populations in ALI-COs with a particularly strong effect on deep layer neurons where most of the staining for CTIP2 is unspecific in whole organoids at this stage (whole organoid age: 116 days, ALI-CO age: 120 days, of which 36 days ALI). g. ALI-COs display significantly higher numbers of CTIP2+ and CUX2+ neurons than whole organoids. Statistical analysis was carried out on a total of 6 whole organoids from three independent batches and 6 ALI-COs from two independent batches each with ages ranging between 98-105 days total in culture. *P=0.0411 and **P=0.0022 Two-tailed Mann-Whitney test, whiskers are min and max values, center line is median and limits are upper and lower quartiles. h. Representative TUNEL staining (red) in cryosections of whole organoids compared with ALI-COs used for quantifications in i. reveals increased cell death in whole organoids. Inset is higher magnification of outlined region. i. Quantification TUNEL+ cells in 6 whole organoids from three independent batches and 6 ALI-COs from two independent batches with ages ranging between 98-105 days total in culture show that whole organoids display significantly higher levels of cell death compared to ALI-COs. **P=0.0022 Two-tailed Mann-Whitney test, error bars are S.D. j. 30-week whole organoid compared with age-matched ALI-CO (142 days at the ALI, 210 days total) stained for axons (SMI312) and dendrites (MAP2) demonstrates continued survival and improved morphology in organoids kept at the ALI. Representative image of one of three ALI-COs stained compared with one whole organoid. k. Higher magnification of 30-week age matched whole and ALI-CO stained for glia (GFAP) and neurons (TUBB3) showing increased neurons and healthier astrocyte morphology in the ALI-CO. Representative image of one of three ALI-COs stained compared with one whole organoid. l. 1-year ALI-CO (275 days ALI) stained for axons (SMI312) and dendrites (MAP2) continues to display abundant healthy neurons with evident axon tracts. Three ALI-COs from one organoid were stained with similar morphologies. Scale bars: 500 μm in b, d, h, j, l; 100 μm in f, k, and l inset.
Figure 2
Figure 2. ALI-CO cultures exhibit mature neuronal morphology and function
a. Sparse labeling in an ALI-CO at 37 days at the ALI (80 days total) by Sendai-virus encoding emGFP (white) reveals radially aligned neurons (NEUROD2, blue) with complex dendritic architectures and pyramidal morphologies (arrowheads) within the aligned cortical plate (bracket). All cells contain fFusionRed (red) to visualize the overall tissue morphology. b. Higher magnification of a maximum intensity projection of a single emGFP (green) labeled neuron (NEUROD2+, magenta) displaying typical pyramidal morphology with primary dendrite (arrow) and basal dendrites (arrowheads). Synaptophysin (white) reveals extensive synaptic staining throughout. c. Electroporation of membrane targeted farnesylated GFP (fGFP, green) reveals complex dendritic architecture of radially aligned pyramidal neurons (arrows) in a maximum intensity projection with evident dendritic spines (arrowheads, inset) in an ALI-CO at 51 days at the ALI (143 days total) d. Sparse labeling of a 1-year ALI-CO (90 + 275 days ALI) with Sendai-emGFP labels several individual neurons (arrows) with highly complex dendritic architectures and abundant dendritic spines (arrowheads). Sparse labeling with emGFP and fGFP in a-d were performed on three ALI-COs from three organoids with similar results. e. Two minutes of spontaneous activity recorded from a single electrode of a multi-electrode array (MEA) in an ALI-CO at 54 days at the ALI (117 days total); detected action potentials marked with dots. f. Five-seconds from the same recording (expanded from grey box). g. Overlay of all detected spikes (grey, marked by dots in f) with mean waveform in black. h. Whole-cell patch clamp recordings of action potentials evoked by a 55pA current injection. i. Frequency-current (F-I) curve showing average action potential firing rate with increasing amplitude of current injection (error bars are S.E.M., n=13 cells from 7 ALI-COs of 3 independent organoid batches). Scale bars: 50 μm in a, c; 20 μm in b, 5 μm in c inset, 100 μm in d.
Figure 3
Figure 3. Neurons of ALI-COs exhibit dynamic axon guidance behaviors
a. Schematic of electroporation and preparation of ALI-COs for live imaging. Inset image shows an organoid after plasmid injection along with a blue dye (FastGreen) to visualize the injected ventricle (arrow). b. Temporal projection image pseudocolored by time (Supplementary Video 2) of an electroporated ALI-CO 5 days after placement at the ALI (69 days total age) showing dynamic axon outgrowth with growth cone retraction (blue arrow to red arrow in the higher magnification inset). Representative image shown out of 5 similarly staged and live imaged ALI-COs. c. Temporal projection image (Supplementary Video 3) after 9 days at the ALI (73 days total age) showing more directed axon outgrowth with progressive extension (blue arrow to red arrow in higher magnification insets). Representative image shown out of 3 similarly staged and live imaged ALI-COs. d. Tracing of individual growth cones over time from ALI-COs at the ALI for 2-5 days (early) and 14-24 days (late) reveals disparate behaviors and velocities (see Supplementary Videos 1, 4). Growth cones in later, established tracts exhibit a higher velocity (bold blue and red lines are average linear regression for each set of data), while earlier growth cones exhibit dynamic retractions (visible in a highlighted trace in purple compared with later highlighted in green). An example image of each is shown above with superimposed traces. Tracing was done on 9 growth cones (early) and 12 growth cones (late) from four organoids generated from two independent batches. e. Axon tracts after 18 days ALI culture (88 days total) demonstrating numerous dense bundles (arrows) with nonrandom projection pattern. Note the same overall pattern but with reinforced bundles compared with Supplementary Fig. 3d, which was taken 4 days earlier. Shown is a representative ALI-CO out of 7 similarly staged and imaged ALI-COs. f. Directional image analysis for the orientation (hue) and coherency (brightness) of aligned axon tracts (original image Supplementary Fig. 3e). Representative image shown out of 5 such directional analyses performed with similar results. g. Still image (left) and kymograph (right) of an extending tract (boxed region) (Supplementary Video 8). Note the higher velocity (shallow slope, dotted line) of incoming growth cones while the leading edge of the tract as a whole progresses more slowly (steep slope, dashed line). Representative results out of three experiments performed. Scale bars: 1 mm in a, 100 μm in b, c, d, e, g; 500 μm in f
Figure 4
Figure 4. ALI-COs exhibit diverse axon tract morphologies
a. Staining for all axons (SMI312) and dendrites (MAP2) on an ALI-CO after 36 days at the ALI (85 days total) reveals thick bundles (arrowheads) that can be seen projecting within the organoid and merging to form large tracts (inset below, arrowhead). Representative image of seven ALI-COs stained with similar results. b. Staining for the marker of corpus callosum, NRP1, reveals several internal tracts that are positive and even appear to turn. MAP2 stains dendrites. Age: 49 days at the ALI, 120 days total. Representative image of four ALI-COs stained with similar results. c. Costaining for NRP1 and the callosal guidance factor WNT5A reveals discrete foci (yellow arrows) surrounding an NRP1+ internally projecting tract in an ALI-CO at 54 days at the ALI, 117 days total. Image at right is magnification of boxed region. Representative image of two ALI-COs stained. d. Staining for the axon attractant Netrin 1 reveals large areas of positivity with evident tracts (SMI312+, arrows) projecting inward and toward the Netrin 1 signal. Age: 32 days at the ALI, 81 days total. Representative image of two ALI-COs stained. e. Axon (SMI312) and dendrite (MAP2) staining of an ALI-CO with tract “escaping” from the main mass (arrows) after 34 days at the ALI (89 days total), in addition to internal projections (arrowheads). Representative image of seven ALI-COs stained with similar results. f. Analysis of axon alignment and coherency by OrientationJ analysis (detailed in methods) of SMI312 staining in a whole ALI-CO at 41 days at the ALI (89 days total). Pixel brightness corresponds to coherency while hue corresponds to energy, where pixels with higher energy report less isotropic and more oriented structures. Representative analysis shown out of six ALI-COs analyzed with similar results. Scale bars: 500 μm in a, c, d, e, f, 1 mm in b, 100 μm in c inset, 200 μm in d inset and e inset.
Figure 5
Figure 5. ALI-COs contain diverse neuron identities that exhibit specific projection patterns.
a. Unbiased tSNE separation of clusters based on single-cell RNA-sequencing data of 13,280 cells from 6 ALI-COs of 3 organoids (sample and data acquisition detailed in methods) visualized on a 3D space, showing six main populations. b. Heatmap demonstrating scaled levels of the top 50 differentially expressed genes in the main clusters (C1-6) with example genes (shown at right). c. Histograms of the three top gene ontology (GO) biological process annotations that were defined on the basis of the highest fold-enrichment amongst the most significant terms (Fisher’s exact test with FDR multiple test correction above 0.1% by http://geneontology.org, p < 0.001, n = 50 top differentially expressed genes per cluster).). Colour coding of bars represent cluster identities. d. Schematic representation of cells residing in the different layers of the fetal human cortex: ventricular zone (VZ) containing radial glia (RG), subventricular zone (SVZ) containing outer/basal radial glia (oRG) and intermediate progenitors (IP), deep (DL) and upper cortical plate layers (UL) as well as interneurons (IN) and layer 6 neurons (VI). e. Heatmap showing the scaled mean expression levels of layer- and cell-type specific genes within the six unbiased clusters, identifying the major cell populations. The colour coding of layers, marker genes (right side) and cell types (bottom) corresponds with cluster identities (C1-C6, bottom). f. 2D tSNE plots of clusters (left side) and the distribution of cells expressing layer or cell-type marker genes across the main populations (upper row). Scatter plots below show the distribution of corresponding normalized gene expression values per cell within each cluster, and the violin plot is displayed where the proportion of cells expressing a given gene is the highest. Tails of the plot have been trimmed to represent the maxima and minima values of expression levels. The central hinge represents the median value for each cluster. The distribution in each cluster is based on the filtered and merged datasets deriving from the six organoid slice samples (n = 4191 cells for C1, 3565 cells for C2, 2068 cells for C3, 1658 cells for C4, 952 cells for C5, 846 cells for C6). g. Scatter plots demonstrating the normalized gene expression levels of genes per cell across the six main clusters with a focus on relevant neuronal, progenitor and glial functions. Feature plots (right hand column) demonstrate example genes expressed by populations confined to a particular cluster or by multiple cell populations. Colour coding represents functional gene associations. h. Staining for SATB2 reveals the presence of this upper layer marker and its distribution in a more superficial region, compared with CTIP2. Age: 20 days at the ALI, 90 days total. i. FEZF2+ deep-layer cells and BRN2+ superficial-layer cells are also present and exhibit appropriate distributions in an ALI-CO generated from another organoid. Age: 20 days at the ALI, 90 days total. j. Superficial CUX1+ cells are present in more superficial regions with SOX5+ cells in deeper locations. Age: 20 days at the ALI, 84 days total. Brackets in h-j denote the deeper regions of the ALI-CO cortical plate. h-j are representative images of a region of a single ALI-CO stained for each. k. Representative images of samples used for retrograde labeling by CTB microinjection (arrowheads indicate injection site) and quantification in l. reveals disparate identities contributing to distinct tract morphologies. Inset images are maximum intensity projections of Z-stacks used for quantifications. Individual channels and merge are shown. Yellow arrows indicate CTIP2+/CUX2+ cells and white arrows indicate CUX2 single positive (intracortical morphology, left) or CTIP2 single positive (subcortical escaping morphology, right) cells. l. Quantification of CTB+ cells indicate that tracts with internal projection morphology (left) traced back primarily to CUX2+ callosal projection identity cells while escaping subcortical morphology tracts traced back primarily to CTIP2+ identity cells, as well as CTIP2/CUX2 double positive cells. Six ALI-COs for each condition (intracortical and escaping) from four different organoids were labeled and all CTB-labeled cells across the entire depth of antibody penetration in whole ALI-CO slices were counted for CUX2 or CTIP2 staining. Statistics were performed only on comparisons of single positive cells because double-positive cells are of indeterminate identity. **P=0.0022 Two-tailed Mann-Whitney test, n = 6, error bars are S.E.M. Age: 33 days at the ALI, 97 days total. Scale bars: 100 μm in h, I, j; 300 μm in k, 20 μm in k inset.
Figure 6
Figure 6. Functional connectivity in intracortical and extracortical projecting axon tracts.
a. Image of a 130 day ALI-CO (39 days ALI) upon transfer to the 3D microelectrode array. b. 3.4-millisecond-long traces of spontaneous activity in the 59 recording electrodes at the time of a network burst. Reference electrode location and trace are indicated by arrows in a. and b. c. Network plot showing functional connectivity between specific sites within the ALI-CO shown in a. Line thickness represents strength of correlation in the spontaneous activity recorded between connected nodes (59 recording electrodes of the MEA) in the network, while size of the node indicates the number of connections. Correlated activity was determined using the spike time tiling coefficient as detailed in methods. d. Distribution of distances between functionally connected nodes in c. shows short-, medium- and long-range connections within the ALI-CO. Peak of highest correlated connection distances occurs at approx. 400 μm, medium correlated at approx. 600 μm and lowly correlated at approx. 800 μm. e. Schematic diagram of the ALI-CO-mouse spinal cord co-culture with a representative image (right panel) taken just after sectioning (at 62 days of organoid culture). f. Example of innervation of mouse spinal cord by human ALI-CO derived tracts at 68 days after initiation of co-culture (total organoid age = 123 days). Brightfield image (left panel) shows overall positioning of the tissues, with evident axon tracts (arrows) projecting from the ALI-CO (lower right) to the mouse spinal cord (upper left). Staining (right panel) with the human specific marker STEM121 reveals these are ALI-CO derived, and MAP2 staining reveals mouse neurons within the spinal cord and also stains neurons of the human tissue, which is double positive. Images in e and f are representative of six such co-culture experiments performed. g. Immunofluorescence using a human specific antibody against the presynaptic marker Synaptophysin (SYP), STEM121, MAP2 and the post-synaptic marker Psd95 and high magnification imaging in the mouse spinal cord region of a mouse spinal cord-ALI-CO co-culture after 32 days (total organoid age = 84 days) reveals mature human-mouse synapses with human SYP juxtaposed to Psd95 along the surface of mouse Map2+ and STEM121+ neurons. Lower magnification image is a maximum intensity projection. Staining was performed on one sample out of six co-culture experiments. h. Brightfield images of 32-day (84 day total organoid age) human-mouse co-culture used for panels i-l. Images show pre- (outlined in blue) and post- (outlined in red) axotomy with a stimulation electrode (yellow dashed outline) placed on axon tracts leading from the organoid. Yellow box: region imaged for muscle contraction traces in i-l, white dashed box: region shown in Supplementary Fig. 6g, red dashed line: site of axotomy. Shown is a representative image of six co-culture experiments used for stimulation paradigms as shown in i-l, two of which included axotomy as shown, with similar results in all. i. Spontaneous muscle contractions recorded as displacement (see Methods) of the co-culture shown in h. Recording was made before stimulation of the tissue. j. Muscle displacement (contraction) amplitude in response to increasing amplitude of single current pulses (black arrows, 2 mA to 20 mA, 120 μs-long) at 30, 40, 50 and 60 s of the recording (Supplementary Video 11). k. Evoked muscle contractions (Supplementary Video 12) pre- (blue) and post- (red) axotomy in response to single current pulses (black arrows, 15 mA, 120 μs-long) applied at 30, 60, 75, 90, 105, 120, 135s during the recording (150 s total duration). l. Evoked muscle contractions (Supplementary Video 13) pre- (blue) and post-axotomy (red) in response to 30 s of 1 Hz TTL stimulation with 15 mA current pulses (black hash marks, 120 μs-long). Both spontaneous and evoked contractions were abolished by axotomy (Supplementary Video 14) in k and l, while only a few very low amplitude contractions are seen. m. Overlay of evoked muscle contraction waveforms elicited by repeated current pulses (15 mA, 160 μs-long, 0.6 Hz), and waveform average (black), showing the first peak at ~ 37 ms after stimulation. Reported above is a box-and-whiskers plot capturing the spread of the individual contraction events. n= 35 contraction events, center line is median, limits are quartiles, whiskers are min and max. Red cross is an outlier with another outlier recorded at 1 sec (not shown). Organoid age: 42 days at the ALI, 104 days total. n. Evoked muscle contractions to 30 s of repeated current pulses (blue trace, 0.4 Hz, 25 mA, 180 μs-long) in a 21-day human-mouse co-culture (89 days total organoid age) (Supplementary Fig. 6j) were abolished by application of 2 μM TTX (orange trace) and restored (green trace) following wash-out with warm media (8x) and 30-minute incubation at 37 °C. Scale bars: 1 mm in a; 500 μm in e, h; 200 μm in f; 5 μm in g; 1 μm in g inset.

References

    1. Lancaster MA, et al. Cerebral organoids model human brain development and microcephaly. Nature. 2013;501:373–379. - PMC - PubMed
    1. Kadoshima T, et al. Self-organization of axial polarity, inside-out layer pattern, and species-specific progenitor dynamics in human ES cell-derived neocortex. Proc Natl Acad Sci U S A. 2013;110:20284–20289. - PMC - PubMed
    1. Birey F, et al. Assembly of functionally integrated human forebrain spheroids. Nature. 2017;545:54–59. - PMC - PubMed
    1. Lancaster MA, et al. Guided self-organization and cortical plate formation in human brain organoids. Nat Biotechnol. 2017;35:659–666. - PMC - PubMed
    1. Quadrato G, et al. Cell diversity and network dynamics in photosensitive human brain organoids. Nature. 2017;545:48–53. - PMC - PubMed

Publication types