. 2019 May;20(5):602-612.
doi: 10.1038/s41590-019-0342-0. Epub 2019 Mar 18.

Lymph node conduits transport virions for rapid T cell activation

Affiliations

Lymph node conduits transport virions for rapid T cell activation

Glennys V Reynoso et al. Nat Immunol. 2019 May.

Abstract

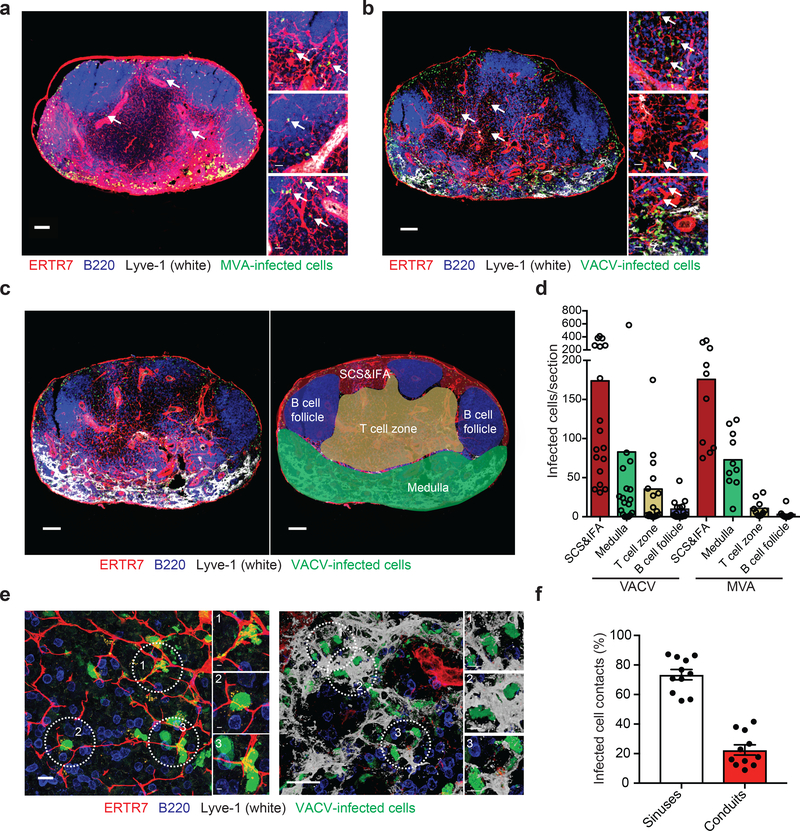
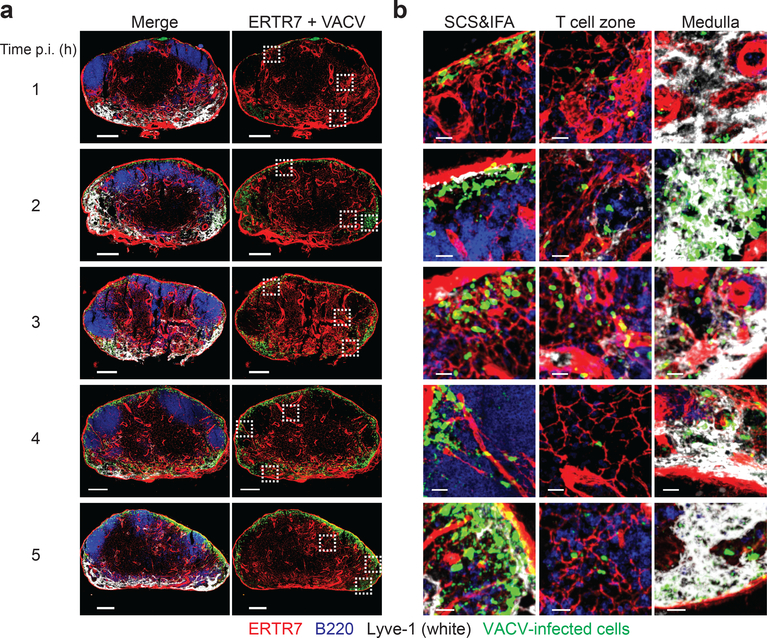
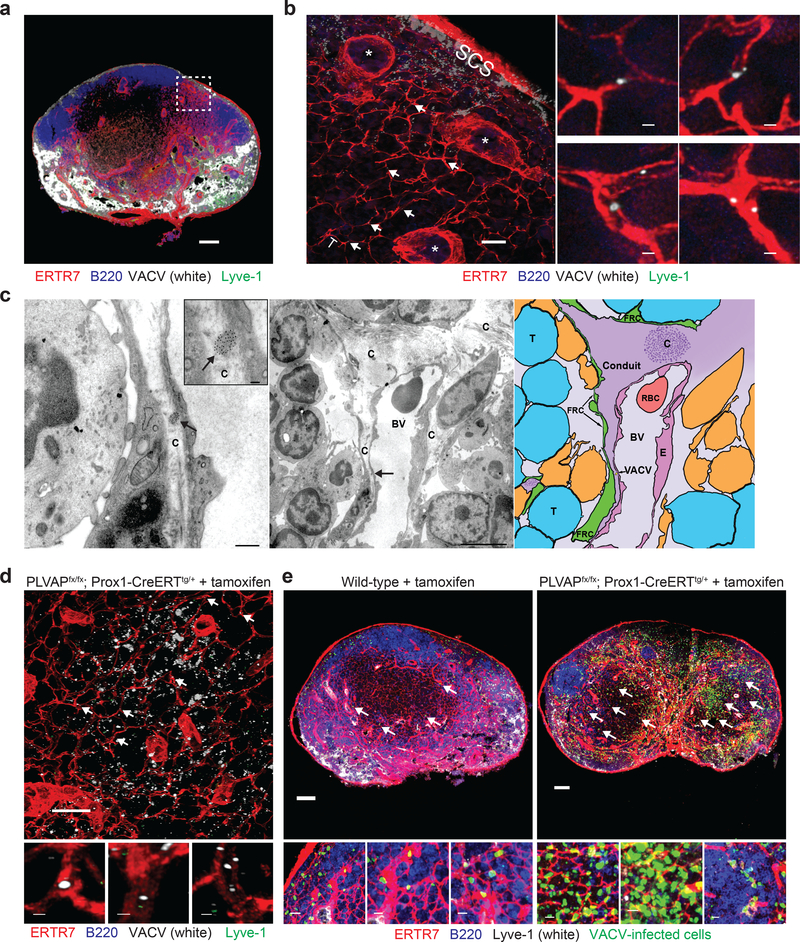
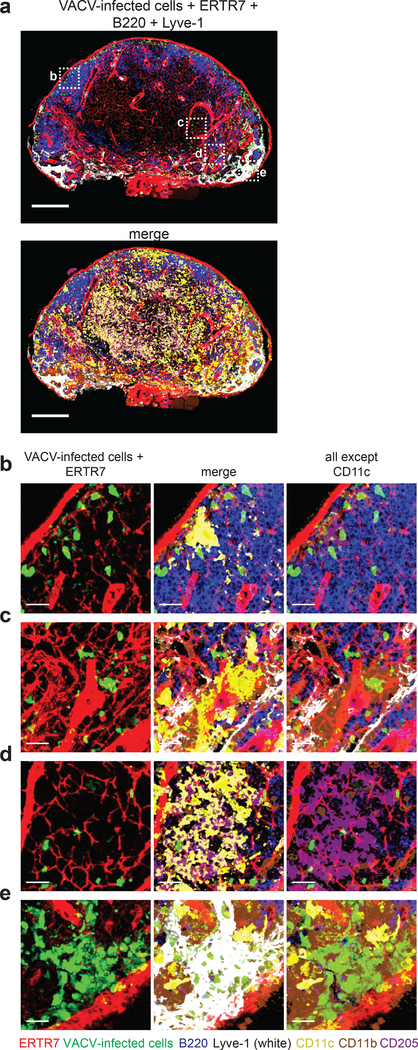
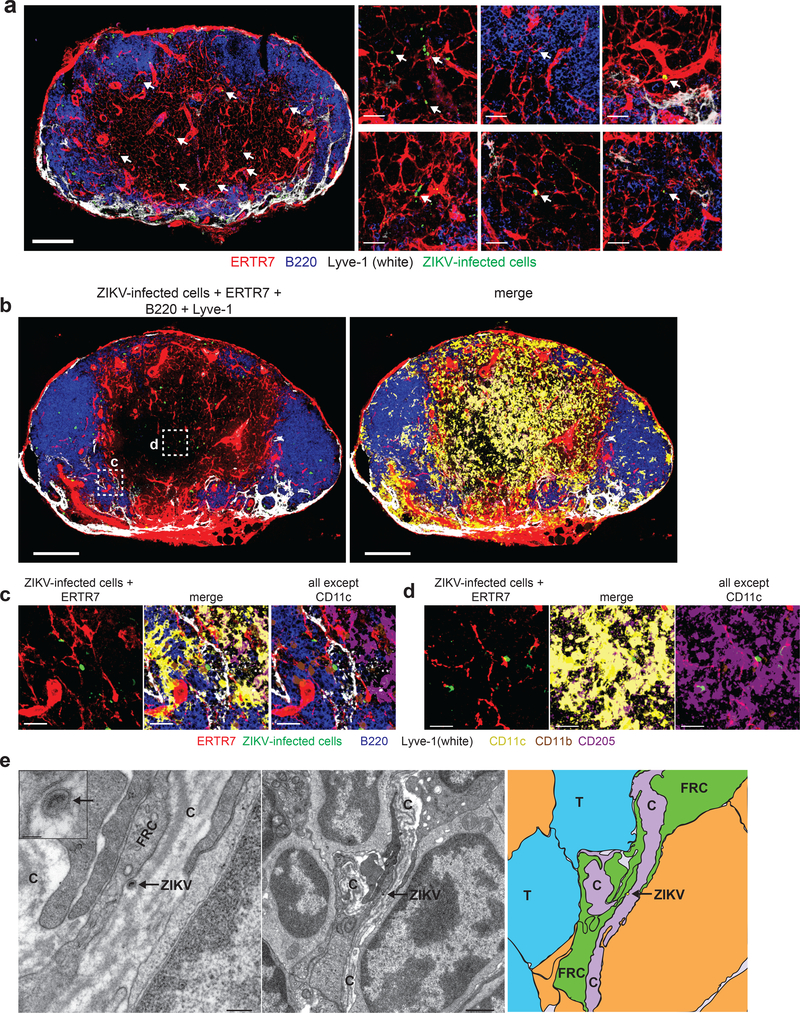
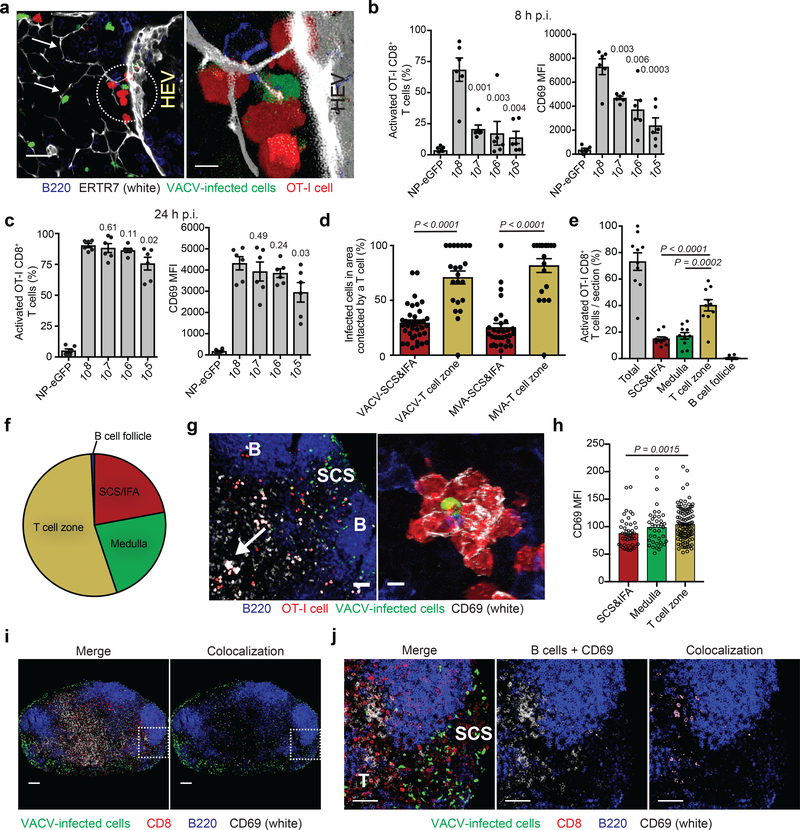
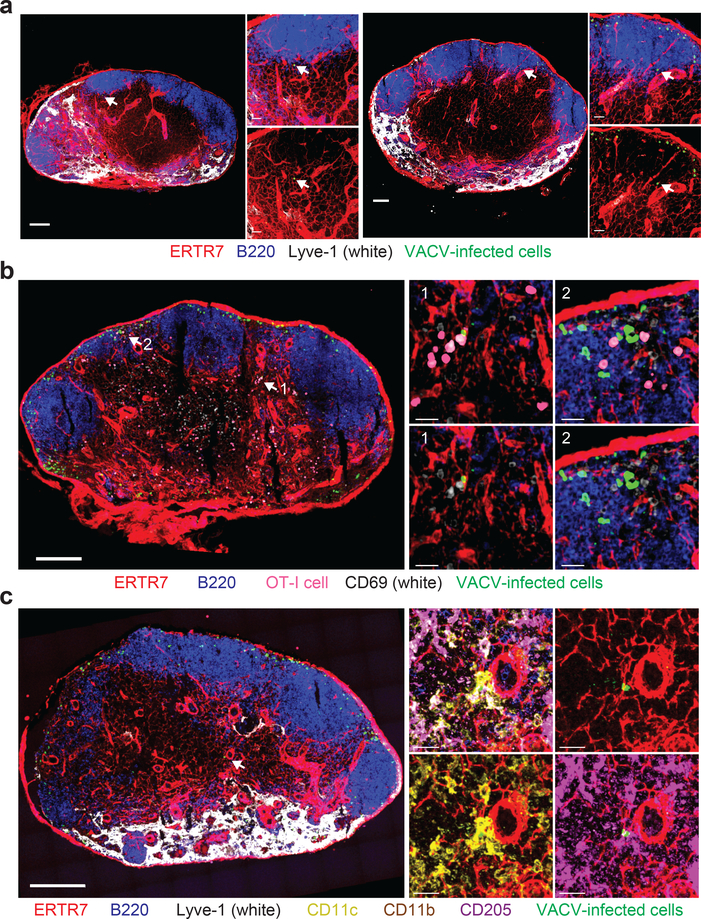
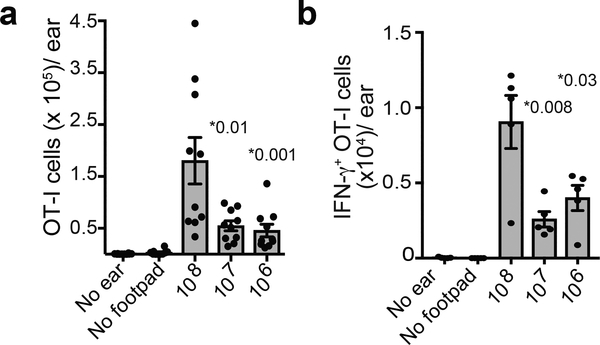
Despite intense interest in antiviral T cell priming, the routes by which virions move in lymph nodes (LNs) are imperfectly understood. Current models fail to explain how virus-infected cells rapidly appear within the LN interior after viral infection. To better understand virion trafficking in the LN, we determined the locations of virions and infected cells after administration to mice of vaccinia virus or Zika virus. Notably, many rapidly infected cells in the LN interior were adjacent to LN conduits. Through the use of confocal and electron microscopy, we clearly visualized virions within conduits. Functionally, CD8+ T cells rapidly and preferentially associated with vaccinia virus-infected cells in the LN paracortex, which led to T cell activation in the LN interior. These results reveal that it is possible for even large virions to flow through LN conduits and infect dendritic cells within the T cell zone to prime CD8+ T cells.


Conflict of interest statement

COMPETING INTERESTS

The authors declare declare no competing interests as defined by Nature Research, or other interests that might be perceived to influence the results and/or discussion reported in this paper.

Figures

Figure 1.
Figure 1.. VACV and MVA rapidly infect T cell-zone cells associated with conduits.
a-b) Maximum intensity projections (MIP) of sections of popliteal LNs harvested 8 h after footpad injection 108 pfu of MVA (a) or VACV (b). ERTR7 = red (labeling conduits and blood vessels), Lyve-1 (labeling non-conduit lymphatic sinuses) = white, MVA or VACV-infected cells = green nuclear signal, B220 (labeling B cells) = blue. Arrows point to some of the virus-infected cells associated with conduits. Scalebar = 100 μm. Higher magnification images are shown to the right. Scalebars = 20 μm. (n =18 LN sections for VACV; 10 LN sections for MVA taken over 4–6 independent experiments) c) Schematic for assignment of LN regions into subcapsular sinus and interfollicular area region (SCS&IFA), B cell follicles, T cell zone, and medulla. Left = LN as stained in (a) and (b), right with areas overlaid. Scalebars = 100 μm. d) Quantitation of infected cells (either MVA or VACV) per LN section 8 h post-infection from sections in (a-b). Dots represent individual sections. Bars = mean. e) High magnification images showing the association of T cell-zone infected cells (green, nuclear) with conduits (red, left); or medullary infected cells associated with lymphatic sinuses (white, right). Scalebars = 20 μm. Individual infected cells that are highlighted in circles are shown in higher magnification on the right for each image. Scalebars = 3 μm (right insets) and 5 μm (left insets). f) Quantitation of the percentage of infected cells contacting either lymphatic endothelial cells (of LN sinuses) or conduits in the VACV sections (n=11, 3 independent experiments). Bars show mean. Scalebars = SEM.
Figure 2.
Figure 2.. Conduit-associated VACV-infected cells can be visualized in the LN within an h of infection.
a) Maximum intensity projections (MIP) of sections of popliteal LNs harvested at the indicated h post infection with 108 pfu of VACV (time indicated on the left). ERTR7 = red (labeling conduits and blood vessels), Lyve-1 (labeling non-conduit lymphatic sinuses) = white, VACV-infected cells = green nuclear signal, B220 (labeling B cells) = blue. Dashed boxes indicate areas of the LN section with magnified views shown in (b). Scalebars = 200 μm. Results are representative of 6 LNs from 3 different experiments. b) Higher magnification images of LN sections in (a) showing VACV-infected cells in the SCS and IFA region, T cell zone and medulla at the indicated time post-infection (far left). Scalebars = 20 μm.
Figure 3.
Figure 3.. VACV virions can be transported in LN conduits.
a) Maximum intensity projection (MIP) of a popliteal LN section harvested 3 m after footpad injection of purified Alexa 647-labeled VACV (white) showing labeled virus in subcapsular and medullary sinuses (green). ERTR7 = red (labeling conduits and blood vessels), Lyve-1 (labeling non-conduit lymphatic sinuses) = green, Alexa 647-labeled VACV = white, B220 (B cells) = blue. The area shown in the dashed box is magnified in b). Scalebar = 100 μm. b) Blended projection of the boxed area of (a). Arrows point to some examples of labeled virions in conduits. Scalebar = 50 μm. * denote blood vessels. T = T cell zone. SCS = subcapsular sinus. Right panels show magnified images. Scalebar = 1 μm. Images in (a,b) are representative of 10 LNs taken in 4 separate experiments. c) Electron micrographs of popliteal LN harvested 5 m after footpad injection of 10 nm-gold-particle-conjugated VACV. Left panel) VACV virion in a conduit (labeled with a C) is indicated by an arrow. Scalebar = 500 nm. Inset shows a higher magnification of virion. Scalebar = 100 nm. Middle panel) Lower magnification of area in right panel showing typical down-spout like conduit (C) in the node. An arrow indicates the location of the virion. BV= blood vessel. Scalebar = 5 μm. Right panel) schematic of the image in the middle panel showing the VACV virion (gold) in the conduit (purple). Arrow indicates the location of the virion. The conduit is labeled “conduit”, T = T cell, FRC = fibroblastic reticular cell, RBC = red blood cell, E = endothelial cell, BV = blood vessel. An area of the conduit with collagen fibers running transverse to the LN section is indicated with a “C”. Results are indicative of 14 grids from 2 separate experiments. d) Alexa 647-labeled virus was injected footpad into tamoxifen-treated PLVAPiLECKO (genotype PLVAPfx/fx; Prox1-CreERT2tg/+) mice (depleting PLVAP on lymphatic endothelial cells (LECs)). ERTR7 = red (labeling conduits and blood vessels), Lyve-1 (labeling non-conduit lymphatic sinuses) = green, Alexa 647-labeled VACV = white, B220 (B cells) = blue. Arrows indicate some examples of labeled virus in conduits. Scalebar = 100 μm. Higher magnification images are shown in the insets below the image. Scalebar = 1 μm. Results are representative of 6 mice and 3 experiments. e) MIPs of sections of popliteal LN harvested 8 h post-footpad infection of wild-type mice treated with tamoxifen (left), or of transgenic animals with Plvap conditionally ablated in LECs (right). Arrows indicate some examples of virus-infected cells (green) in the T cell zone. Scalebars = 100 μm. Higher magnification images are shown below each node. Scalebars = 10 μm. ERTR7 = red (labeling conduits and blood vessels), Lyve-1 (labeling non-conduit lymphatic sinuses) = white, VACV-infected cells = green nuclear signal, B220 (labeling B cells) = blue. Results are representative of 9 mice and 3 experiments.
Figure 4.
Figure 4.. VACV infects conduit-associated dendritic cells.
a) Maximum intensity projection (MIP) of a section of a popliteal LN harvested 8 h after footpad injection of 108 pfu of VACV. Top panel) staining as in previous figures showing ERTR7 = red (labeling conduits and blood vessels), Lyve-1 (labeling non-conduit lymphatic sinuses) = white, VACV-infected cells = green nuclear signal, B220 (labeling B cells) = blue. Bottom panel) same image as the top adding staining for CD11c = yellow, CD205 = purple, and CD11b = brown. Scalebars = 200 μm. b-e) High magnification images of dashed boxes in (a) showing b) an infected CD205+ DC in the SCS, c) an infected CD11b+ DC near a lymphoid sinus, d) infected CD205+ DCs associated with conduits in the T cell zone, e) infected CD11b+ macrophages in the medullary sinus. Scalebars = 20 μm. Results are representative of 10 LNs and 4 experiments.
Figure 5.
Figure 5.. Zika virions are also transported by conduits.
a) Maximum intensity projection (MIP) of a section of a popliteal LN harvested 24 h after footpad injection of 104 FFU ZIKV. Arrows indicate ZIKV-infected cells (green, stained for ZIKV NS2B protein) associated with conduits. ERTR7 = red (labeling conduits and blood vessels), Lyve-1 (labeling non-conduit lymphatic sinuses) = white, B220 (labeling B cells) = blue. Scalebar = 200 μm. Smaller panels to the left show higher magnification images. Scalebars = 20 μm. Images are representative of 20 LNs from 5 experiments. b) Maximum intensity projection (MIP) of a section of a popliteal LN harvested 24 h after footpad injection of 104 FFU ZIKV. Left panel is stained as in (a). Right panel adds on staining for CD11c = yellow, CD205 = purple, and CD11b = brown. Scalebars = 200 μm. c-d) High magnification images of dashed boxes in (b) showing c) an infected CD11b+ DC in a sinus (white), and d) an infected CD205+ DC in the T cell zone. Scalebars = 20 μm. Results are indicative of 10 LNs from 3 experiments. e) Electron micrographs of popliteal LN harvested 24 h after footpad injection of 104 FFU ZIKV. Left panel) ZIKV virion is indicated in an arrow in a conduit (labeled with a C). Scalebar = 200 nm. Inset shows a higher magnification of virion. Scalebar = 50 nm. FRC = fibroblastic reticular cell. Middle panel) lower magnification image of left panel. Scalebar = 1 μm. Right panel) schematic of the image in the middle panel showing the ZIKV virion (yellow) in the conduit (purple). Arrow indicates the location of the virion. Conduit = C, T = T cell, FRC = fibroblastic reticular cell. 24 grids from 6 nodes and 3 experiments were analyzed.
Figure 6.
Figure 6.. CD8+ T cells are rapidly activated by virus in the T cell zone.
a) Blended projections of T cells (red) clustered around a conduit (white)-associated VACV-infected cell (green) near a high endothelial venule (HEV, indicated in picture). Arrows point to conduits. Scalebar = 20 μm. Area in circle is magnified on the right. Scalebar = 5 μm. ERTR7= white, VACV-infected cells = green, OT-I CD8+ T cells = red, B220 = blue. Results are representative of 30 LN sections taken from 5 experiments. b) OT-I CD8+ T cell activation as determined by flow cytometry of single-cell suspensions of popliteal LNs harvested 8 h p.i. 106 OT-I cells were transferred 12–24 h prior to infection. NP-eGFP (no SIINFEKL) was given at 107 pfu; all other infections used NP-S-eGFP (containing SIINFEKL) at the indicated dose. Activation was determined by CD69 expression. MFI is shown on the right. Dots = individual LNs. n = 6. Results were repeated 3 times with 3–6 mice/group. Bars = mean. Error bars = SEM. c) OT-I CD8+ T cell activation in (b) but 24 h p.i. Dots = individual LNs. n = 6. Results were repeated 3 times with 3–6 mice/group. Bars = mean. Error bars = SEM. d) Quantitation of the percentage of VACV- or MVA-infected cells in either the SCS and IFA region or T cell zone contacted by OT-I CD8+ T cells (n = 37 VACV or 32 MVA; dots indicate individual sections). Bars = mean. Error bars = SEM. e) Percentage of activated OT-I CD8+ T cells (those with CD69 MFI > 50) in each region of 10 LN sections harvested 8 h after infection with 108 pfu VACV. Percentages shown are activated cells/total cells in each region. Dots = individual LN sections. Bars = mean. Error bars = SEM. f) Percentage of only the activated OT-I CD8+ T cells (as opposed to total cells in (e)) found in each LN region. g) MIP LN section 8 h p.i. showing OT-I CD8+ T cell activation. B = B cell follicle, SCS = subcapsular sinus. Arrow indicates activated T cell cluster in the T cell zone, magnified on the right. Scalebars = 50 μm, left and 5 μm, right. OT-I CD8+ T cells = red, CD69 = white, VACV-infected cells = green, B220 = blue. h) MFI of CD69 on all activated cells in each region of the popliteal LN shown in (g). n =197 T cells. Bars = mean. Error bars = SEM. i) MIP of popliteal LN harvested 8 h post infection with 108 pfu VACV (green) without OT-I transfer. Endogenous, polyclonal CD8+ T cells = red. Colocalization of polyclonal CD8+ T cell signal (red) and CD69 (white) signal is shown in purple. B220 = blue, VACV-infected cells = green. The boxed area is magnified in (j). scalebars = 100 μm j) Higher magnification MIP image of (i) showing both the SCS&IFA (labeled SCS) and T cell zone (T). Colocalization of polyclonal CD8+ T cell signal (red) and CD69 (white) signal is shown in purple. scalebars = 50 μm. f,h,i,j) 6 LNs from 3 experiments were analyzed. g) 10 LNs from 5 experiments were analyzed. Statistics = unpaired two-tailed t test.
Figure 7.
Figure 7.. VACV infects paracortical DCs at lower viral doses.
a) Maximum intensity projection (MIPs) of sections from two different popliteal LNs (left and right) harvested 8 h after footpad injection of 106 pfu of VACV. ERTR7 = red, Lyve-1 = white, VACV-infected cells = green, B220 = blue. Arrows indicate the location of VACV-infected paracortical cell. scalebars = 100 μm. Higher magnification images are shown on the right; lower panels lack the blue channel for clarity. Scalebars = 50 μm. Results are representative of 10 LNs from 3 experiments. b) MIP of a section of a popliteal LN harvested 8 h after footpad injection of 106 pfu of VACV. Prior to infection, 106 OT-I CD8+ T cells were transferred (pink). ERTR7 = red, B220 = blue, CD69 = white, VACV-infected cells = green. Arrows indicate two areas of T cell activation that are shown in higher magnification insets on the left. Scalebar = 200 μm. Top panels of insets show merge; bottom panels do not show OT-I signal (pink) in order to reveal CD69 staining more clearly. Scalebars = 20 μm. Results are representative of 10 LNs from 3 experiments. c) MIP of a section of a popliteal LN harvested 8 h after footpad infection with 106 pfu of VACV showing an infected paracortical CD205+ DC. Scalebar = 200 μm. Higher magnification images are shown in the insets showing: top left) merge; top right) conduits + VACV-infected cells; lower left) conduits + VACV-infected cells + CD11c + CD11b; lower right) conduits + VACV-infected cells + CD205. Scalebar = 20 μm. ERTR7 = red, Lyve-1 = white, VACV-infected cells = green, B220 = blue, CD11c = yellow, CD205 = purple, and CD11b = brown. Results are representative of 10 LNs from 3 experiments.
Figure 8.
Figure 8.. T cells activated at the highest viral doses traffic rapidly to the infected tissue.
a) Number of T cells in the ear at the indicated viral dose. (For no ear, only footpad infection was given. For no footpad, only ear infection was given). Dots show individual ears. n = 10 ears from 5 mice. b) Number of IFN-γ producing OT-I CD8+ T cells in the ear after infection with indicated viral dose. Note that for these experiments, mice were infected in the ear pinna with VACV expressing SIINFEKL 24 h after footpad infection. Dots show individual animals. n = 5 ears from 5 mice. Statistics = unpaired two-tailed t test. For a and b, results were repeated 3 times with 5 mice/group.

References

    1. Gretz JE, Norbury CC, Anderson AO, Proudfoot AE & Shaw S Lymph-borne chemokines and other low molecular weight molecules reach high endothelial venules via specialized conduits while a functional barrier limits access to the lymphocyte microenvironments in lymph node cortex. J Exp Med 192, 1425–1440 (2000). - PMC - PubMed
    1. Itano AA et al. Distinct dendritic cell populations sequentially present antigen to CD4 T cells and stimulate different aspects of cell-mediated immunity. Immunity 19, 47–57 (2003). - PubMed
    1. Sixt M et al. The conduit system transports soluble antigens from the afferent lymph to resident dendritic cells in the T cell area of the lymph node. Immunity 22, 19–29 (2005). - PubMed
    1. Pape KA, Catron DM, Itano AA & Jenkins MK The humoral immune response is initiated in lymph nodes by B cells that acquire soluble antigen directly in the follicles. Immunity 26, 491–502 (2007). - PubMed
    1. Gerner MY, Torabi-Parizi P & Germain RN Strategically localized dendritic cells promote rapid T cell responses to lymph-borne particulate antigens. Immunity 42, 172–185 (2015). - PubMed

Publication types

MeSH terms