

Constitutive STAT3 phosphorylation and IL-6/IL-10 co-expression are associated with impaired T-cell function in tuberculosis patients
- PMID: 30886421
- PMCID: PMC6460487
- DOI: 10.1038/cmi.2018.5
Constitutive STAT3 phosphorylation and IL-6/IL-10 co-expression are associated with impaired T-cell function in tuberculosis patients
Abstract
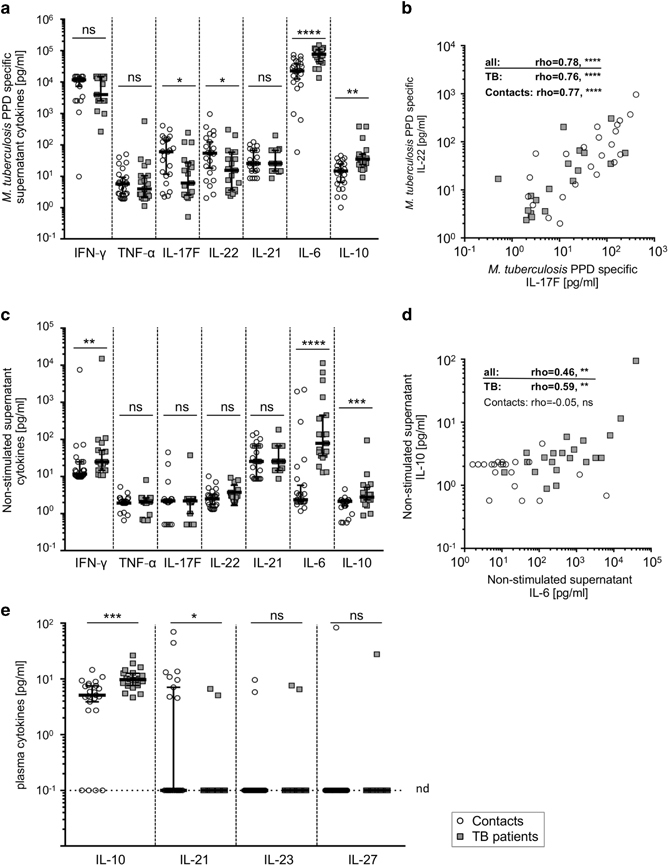
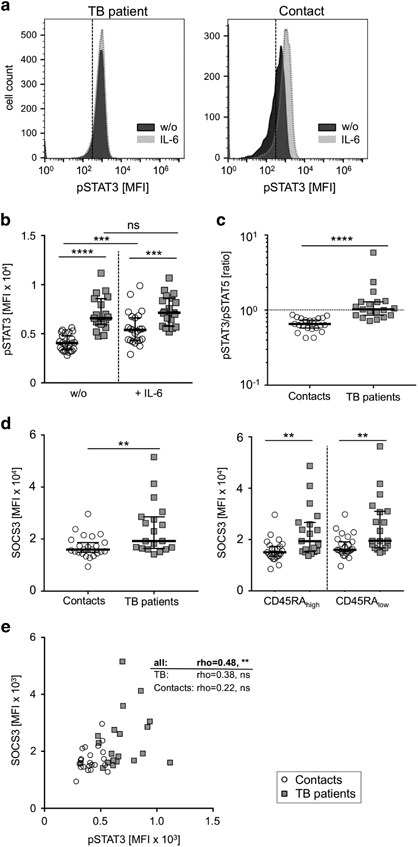
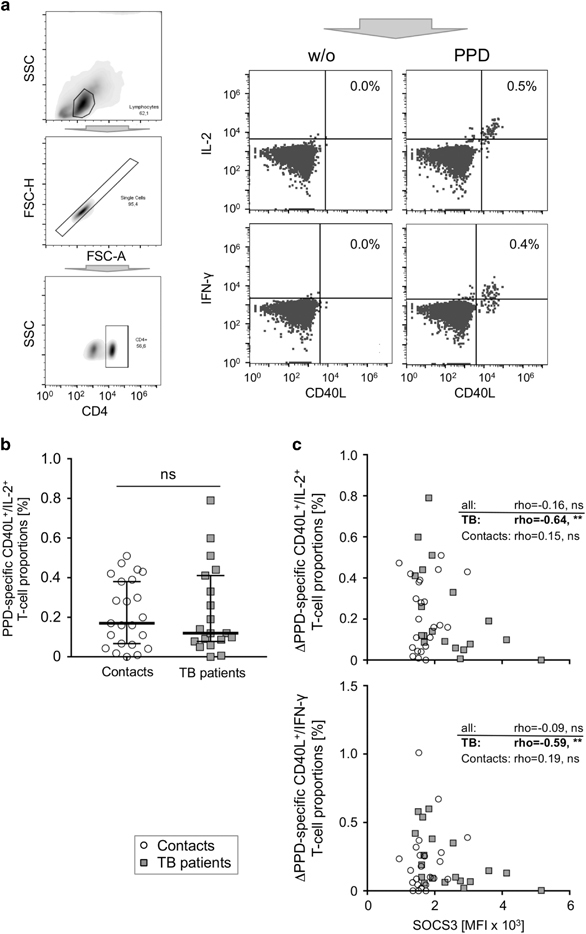
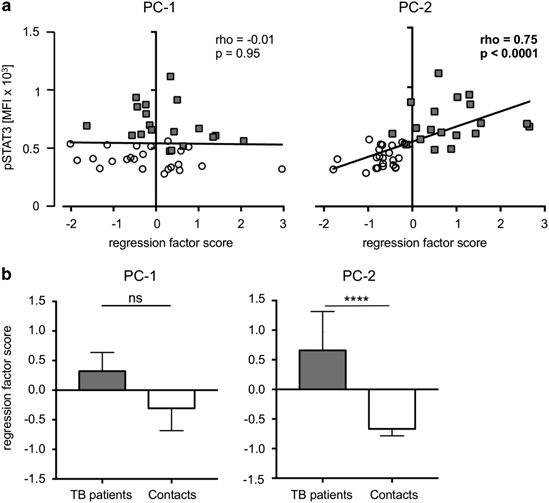
T-cells critically contribute to protection against Mycobacterium tuberculosis infection, and impaired T-cell responses can lead to disease progression. Pro-inflammatory and immunosuppressive cytokines affect T-cells, and fine-tuned regulation of cytokine signaling via the Jak/STAT signaling pathways is crucial for appropriate T-cell function. Constitutive STAT3 phosphorylation as a consequence of aberrant cytokine signaling has been described to occur in pathognomonic T-cell responses in inflammatory and autoimmune diseases. We characterized blood samples from tuberculosis patients (n=28) and healthy contacts (n=28) from Ghana for M. tuberculosis-specific T-cell responses, constitutive cytokine production, and SOCS3 and pSTAT3 expression. Lentiviral modulation of primary CD4+ T-cells was performed to determine the effects of SOCS3 on T-cell functions. T-cells from tuberculosis patients expressed higher levels of IL-10 and IL-6 and lower levels of T helper type (TH)17 cytokines after M. tuberculosis-specific stimulation compared to healthy contacts. In addition, tuberculosis patients had higher IL-10 and IL-6 levels in the supernatants of non-stimulated immune cells and plasma samples compared to healthy contacts. Notably, aberrant cytokine expression was accompanied by high constitutive pSTAT3 levels and SOCS3 expression in T-cells. Multivariate analysis identified an IL-6/IL-10 co-expression-based principal component in tuberculosis patients that correlated with high pSTAT3 levels. SOCS3 contributed to a regulatory component, and tuberculosis patients with high SOCS3 expression showed decreased TH1 cytokine expression and impaired IL-2-induced STAT5 phosphorylation. SOCS3 over-expression in primary CD4+ T-cells confirmed the SOCS3 inhibitory function on IL-2-induced STAT5 phosphorylation. We conclude that constitutive pSTAT3 and high SOCS3 expression are influential factors that indicate impaired T-cell functions in tuberculosis patients.
Keywords: Interleukin-10; Interleukin-6; SOCS3; STAT3; tuberculosis.
Figures

Comment in
-
Aberrant cytokine milieu and signaling affect immune cell phenotypes and functions in tuberculosis pathology: What can we learn from this phenomenon for application to inflammatory syndromes?Cell Mol Immunol. 2021 Aug;18(8):2062-2064. doi: 10.1038/s41423-021-00695-8. Epub 2021 May 25. Cell Mol Immunol. 2021. PMID: 34035497 Free PMC article. No abstract available.
Similar articles
-
Aberrant plasma IL-7 and soluble IL-7 receptor levels indicate impaired T-cell response to IL-7 in human tuberculosis.PLoS Pathog. 2017 Jun 5;13(6):e1006425. doi: 10.1371/journal.ppat.1006425. eCollection 2017 Jun. PLoS Pathog. 2017. PMID: 28582466 Free PMC article.
-
Expression of mycobacterium tuberculosis induced SOCS3 and STAT3 and the implications on innate immunity in TB patients vs healthy contacts in high TB/HIV endemic setting: A cross-sectional analytical study.PLoS One. 2022 Jul 15;17(7):e0263624. doi: 10.1371/journal.pone.0263624. eCollection 2022. PLoS One. 2022. PMID: 35839170 Free PMC article.
-
Upregulation of miR-196b-5p attenuates BCG uptake via targeting SOCS3 and activating STAT3 in macrophages from patients with long-term cigarette smoking-related active pulmonary tuberculosis.J Transl Med. 2018 Oct 16;16(1):284. doi: 10.1186/s12967-018-1654-9. J Transl Med. 2018. PMID: 30326918 Free PMC article.
-
The roles of SOCS3 and STAT3 in bacterial infection and inflammatory diseases.Scand J Immunol. 2018 Dec;88(6):e12727. doi: 10.1111/sji.12727. Scand J Immunol. 2018. PMID: 30341772 Review.
-
SOCS3 and STAT3, major controllers of the outcome of infection with Mycobacterium tuberculosis.Semin Immunol. 2014 Dec;26(6):518-32. doi: 10.1016/j.smim.2014.10.004. Epub 2014 Nov 1. Semin Immunol. 2014. PMID: 25458989 Review.
Cited by
-
Differences in PPD- and mitogen-induced T-cell activation marker expression characterize immunopathology in acute tuberculosis patients.Eur J Clin Microbiol Infect Dis. 2024 Mar;43(3):611-616. doi: 10.1007/s10096-023-04741-3. Epub 2024 Jan 3. Eur J Clin Microbiol Infect Dis. 2024. PMID: 38167987 Free PMC article.
-
Concomitant parasite infections influence tuberculosis immunopathology and favor rapid sputum conversion of pulmonary tuberculosis patients.Ann Clin Microbiol Antimicrob. 2024 Nov 7;23(1):97. doi: 10.1186/s12941-024-00756-6. Ann Clin Microbiol Antimicrob. 2024. PMID: 39511560 Free PMC article.
-
Early introduction of IL-10 weakens BCG revaccination's protection by suppressing CD4+Th1 cell responses.J Transl Med. 2024 Dec 4;22(1):1103. doi: 10.1186/s12967-024-05683-w. J Transl Med. 2024. PMID: 39633471 Free PMC article.
-
Tumor accomplice: T cell exhaustion induced by chronic inflammation.Front Immunol. 2022 Sep 2;13:979116. doi: 10.3389/fimmu.2022.979116. eCollection 2022. Front Immunol. 2022. PMID: 36119037 Free PMC article. Review.
-
Impaired T-cell response to phytohemagglutinin (PHA) in tuberculosis patients is associated with high IL-6 plasma levels and normalizes early during anti-mycobacterial treatment.Infection. 2023 Aug;51(4):1013-1023. doi: 10.1007/s15010-023-01977-1. Epub 2023 Jan 18. Infection. 2023. PMID: 36650358 Free PMC article.
References
-
- Masood KI, Rottenberg ME, Salahuddin N, Irfan M, Rao N, Carow B, et al. Expression of M. tuberculosis-induced suppressor of cytokine signaling (SOCS) 1, SOCS3, FoxP3 and secretion of IL-6 associates with differing clinical severity of tuberculosis. BMC infectious diseases. 2013;13:13. doi: 10.1186/1471-2334-13-13. - DOI - PMC - PubMed
Publication types
MeSH terms
Substances
LinkOut - more resources
Full Text Sources
Medical
Research Materials
Miscellaneous
