. 2019 Mar 4:10:349.
doi: 10.3389/fimmu.2019.00349. eCollection 2019.

Is TCR/pMHC Affinity a Good Estimate of the T-cell Response? An Answer Based on Predictions From 12 Phenotypic Models

Affiliations

Is TCR/pMHC Affinity a Good Estimate of the T-cell Response? An Answer Based on Predictions From 12 Phenotypic Models

Jesús Gálvez et al. Front Immunol. .

Abstract

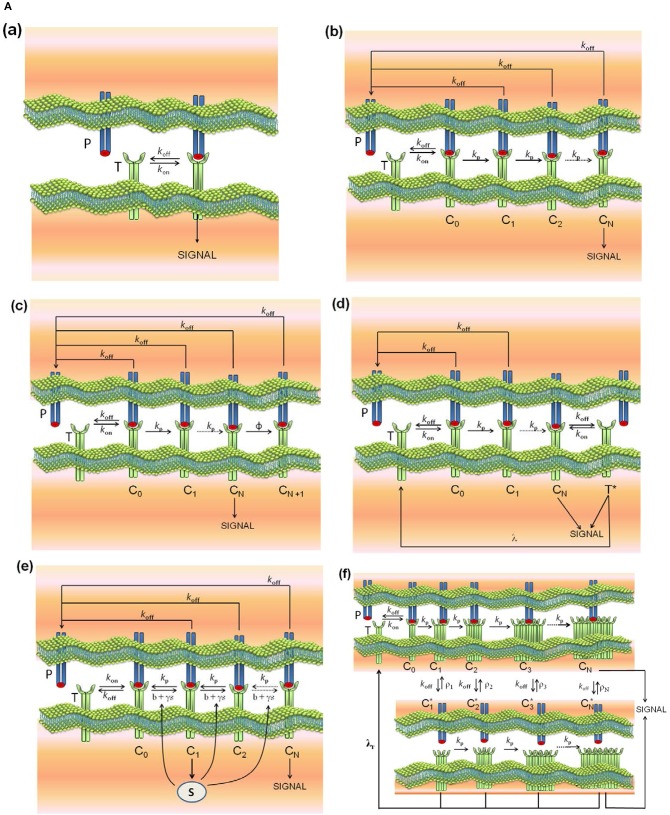
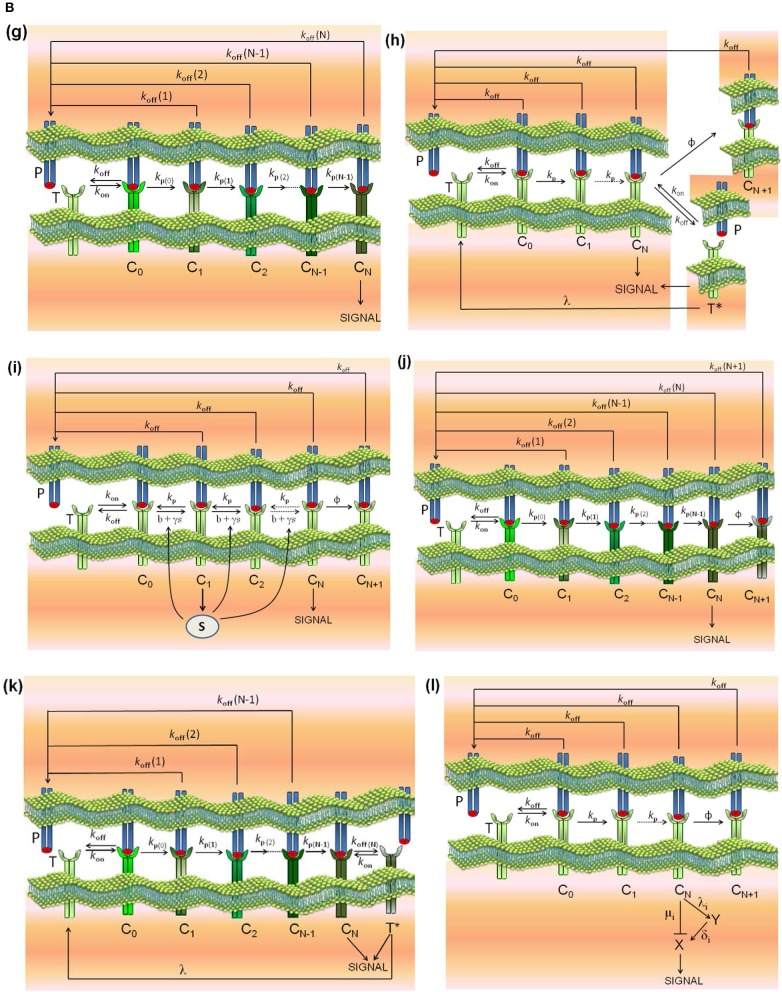
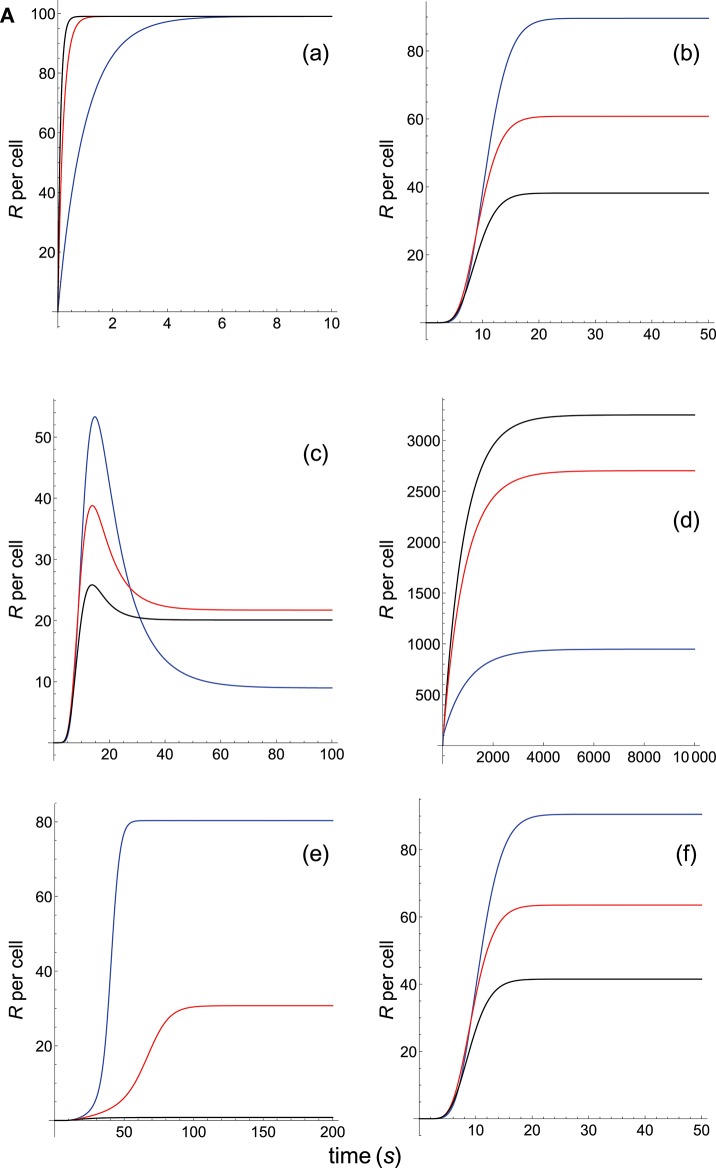
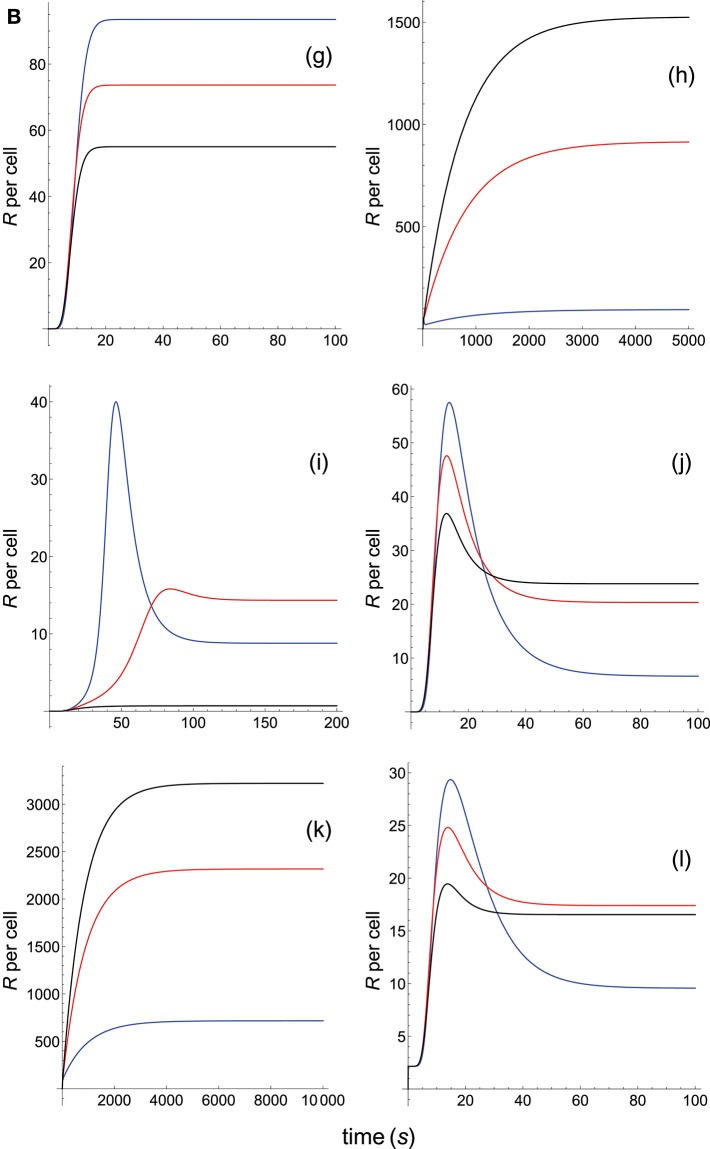
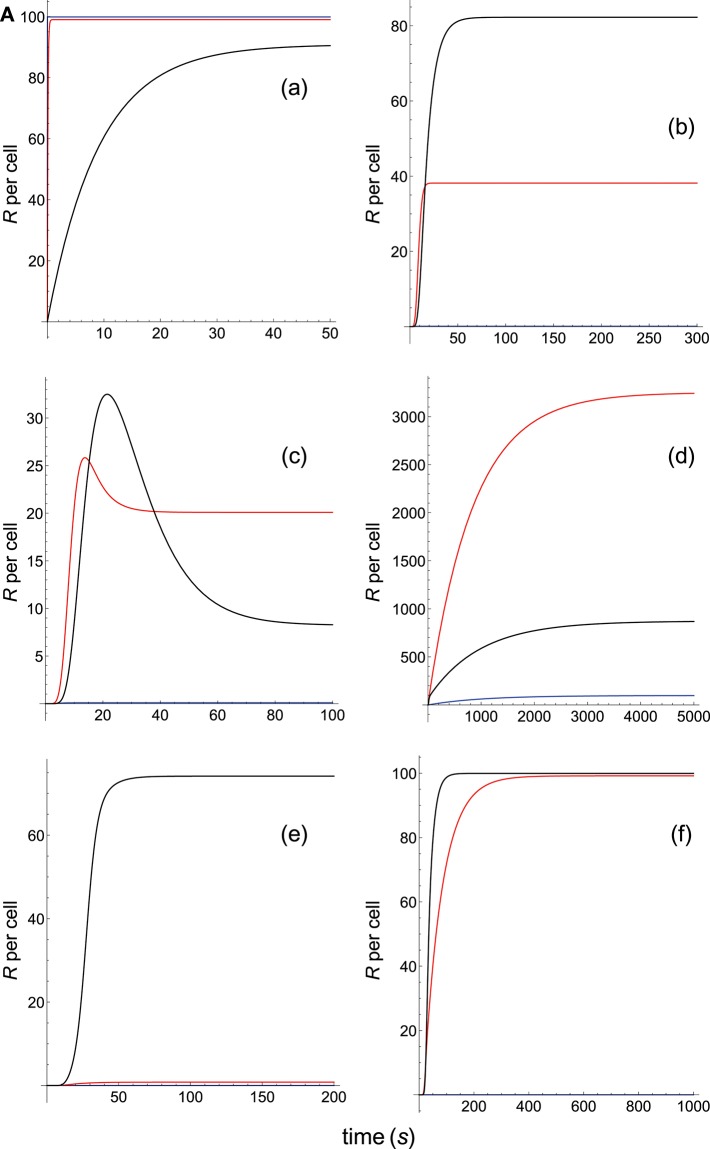
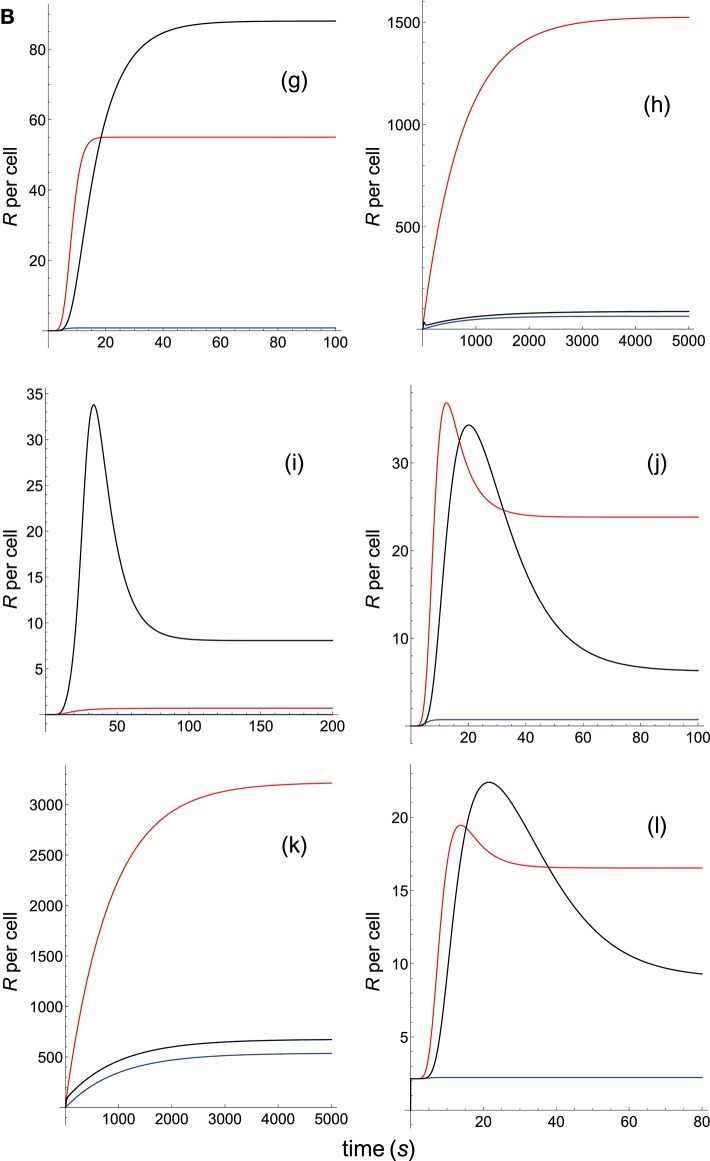
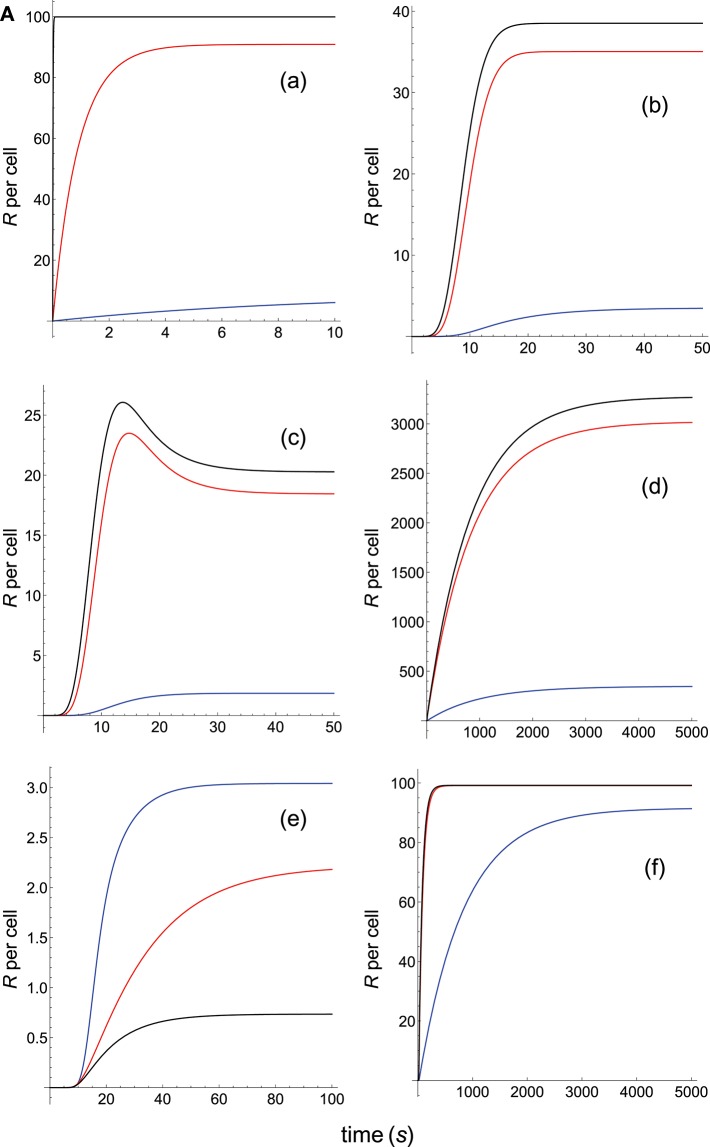
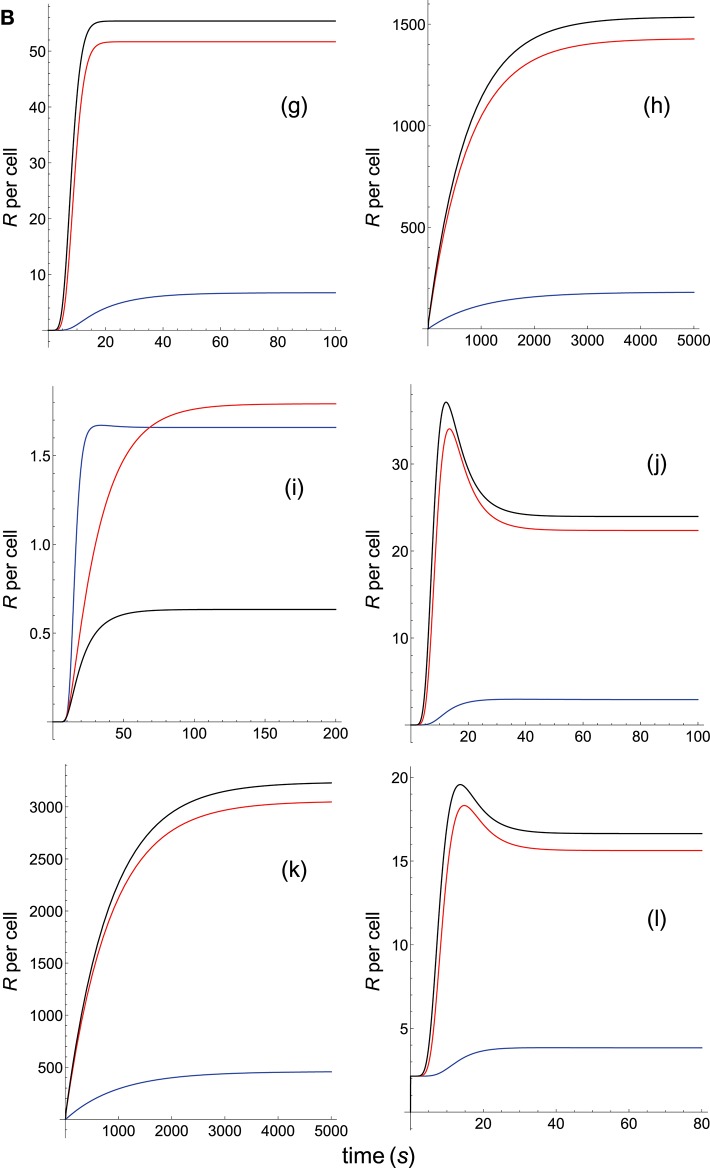
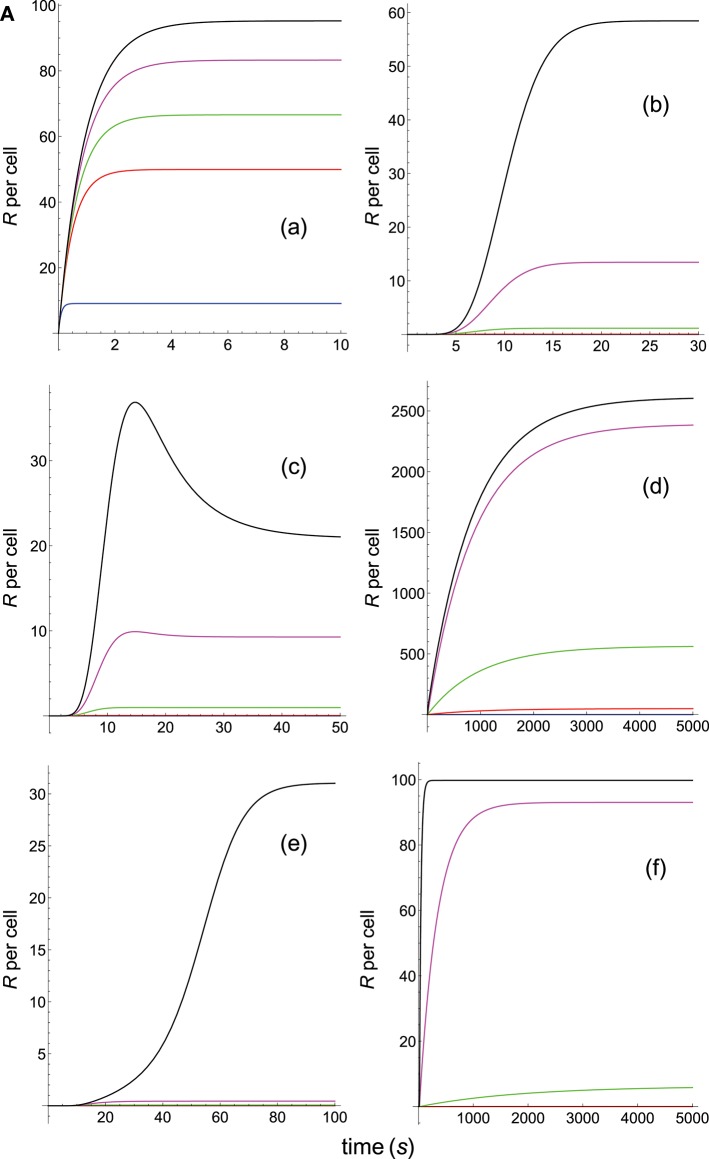
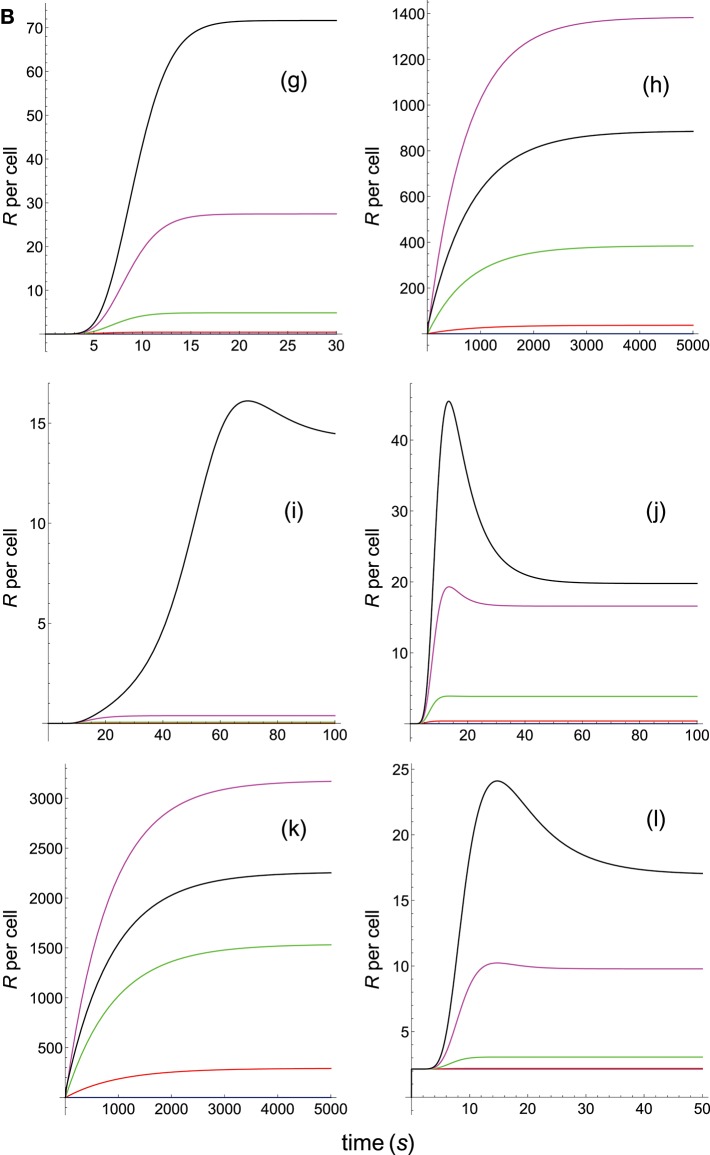
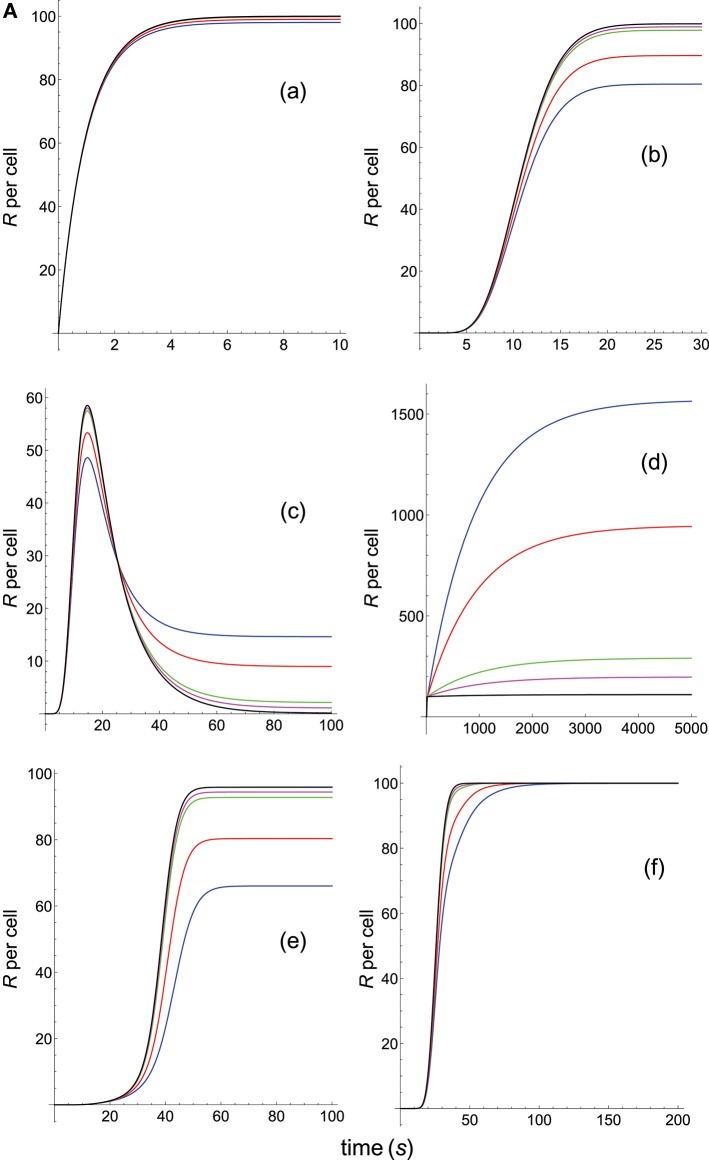
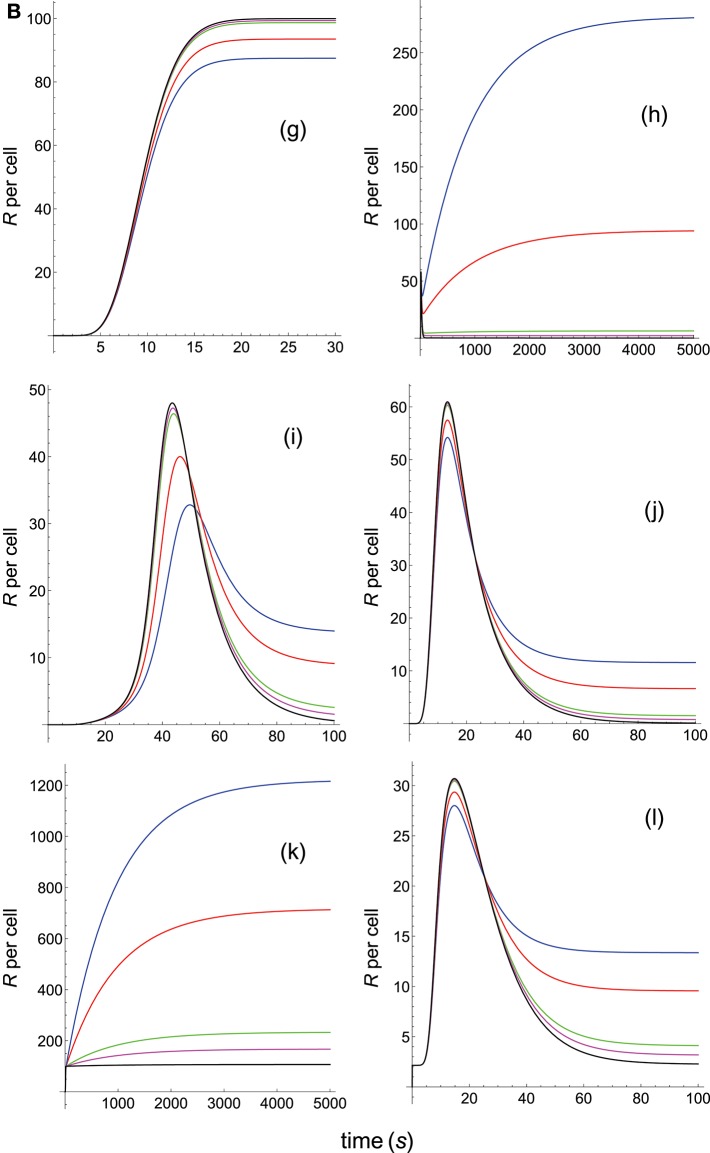
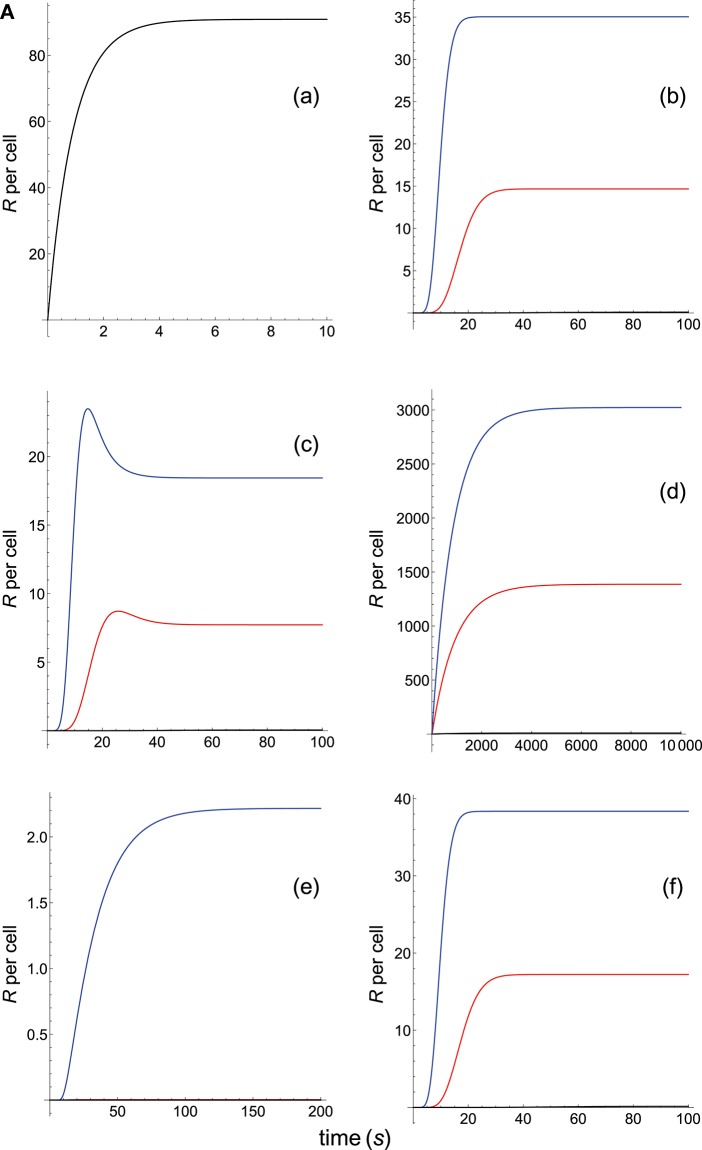
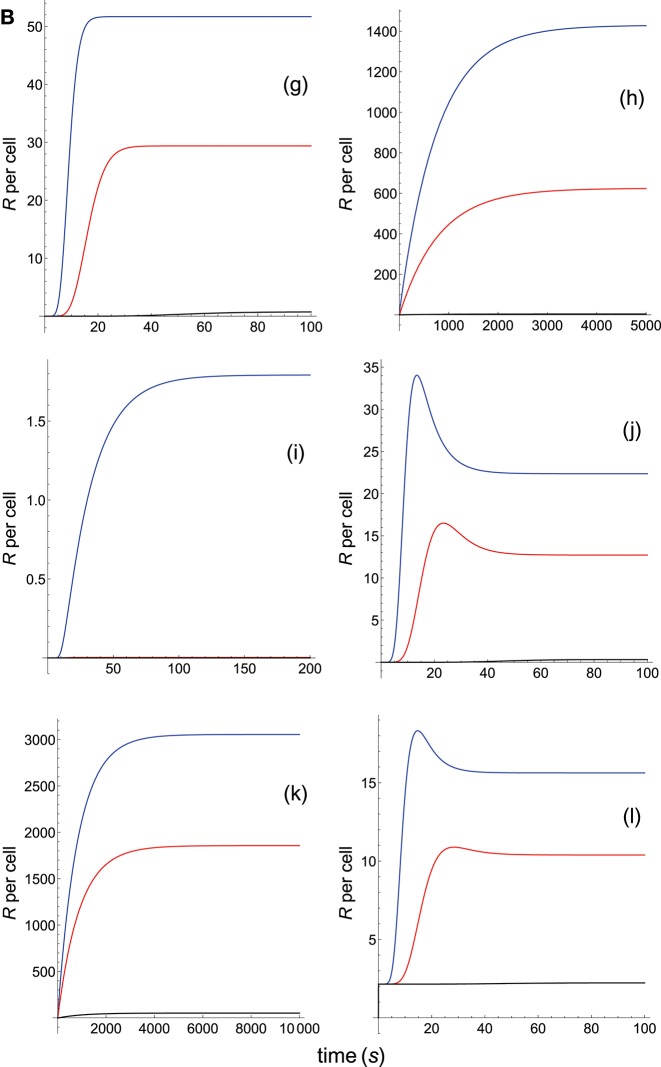
On the T-cell surface the TCR is the only molecule that senses antigen, and the engagement of TCR with its specific antigenic peptide (agonist)/MHC complex (pMHC) is determined by the biochemical parameters of the TCR-pMHC interaction. This interaction is the keystone of the adaptive immune response by triggering intracellular signaling pathways that induce the expression of genes required for T cell-mediated effector functions, such as T cell proliferation, cytokine secretion and cytotoxicity. To study the TCR-pMHC interaction one of its properties most extensively analyzed has been TCR-pMHC affinity. However, and despite of intensive experimental research, the results obtained are far from conclusive. Here, to determine if TCR-pMHC affinity is a reliable parameter to characterize T-cell responses, a systematic study has been performed based on the predictions of 12 phenotypic models. This approach has the advantage that allow us to study the response of a given system as a function of only those parameters in which we are interested while other system parameters remain constant. A little surprising, only the simple occupancy model predicts a direct relationship between affinity and response so that an increase in affinity always leads to larger responses. Conversely, in the others more elaborate models this clear situation does not occur, i.e., that a general positive correlation between affinity and immune response does not exist. This is mainly because affinity values are given by the quotient kon/koff where kon and koff are the rate constants of the binding process (i.e., affinity is in fact the quotient of two parameters), so that different sets of these rate constants can give the same value of affinity. However, except in the occupancy model, the predicted T-cell responses depend on the individual values of kon and koff rather than on their quotient kon/koff. This allows: a) that systems with the same affinity can show quite different responses; and b) that systems with low affinity may exhibit larger responses than systems with higher affinities. This would make affinity a poor estimate of T-cell responses and, as a result, data correlations between affinity and immune response should be interpreted and used with caution.

Keywords: T-cell activation; TCR-pMHC interaction; affinity; correlation between affinity immune response; phenotypic models.


Figures

Figure 1A
Figure 1A
Schemes of the phenotypic models. Panel models: (a) occupancy; (b) basic kpr; (c) kpr with limited signaling; (d) kpr with sustained signaling; (e) kpr with negative feedback; (f) kpr with induced rebinding. A full description of these models are found in the references given in main text.
Figure 1B
Figure 1B
Schemes of the phenotypic models. Panel models: (g) kpr with stabilizing activation chain; (h) kpr with limited and sustained signaling; (i) kpr with negative feedback and limited signaling; (j) kpr with stabilizing activation chain and limited signaling; (k) kpr with stabilizing activation chain and sustained signaling; (l) kpr with limited signaling coupled to an incoherent feed-forward loop (kpl-iff). A full description of these models are found in the references given in main text.
Figure 2A
Figure 2A
Dependence of the values of R on time for three systems with equal affinity (A) but different values of kon(s-1) and koff(s-1) given always in the form (kon,koff): system 1: (kon, 0.01), τ = 100s, A = 100kon (blue); system 2: (5kon, 0.05), τ = 20s, A = 100kon (red); system 3: (10kon, 0.10), τ = 10s, A = 100kon (black). Panel models: (a) occupancy model; (b) basic kpr; (c) kpr with limited signaling; (d) kpr with sustained signaling; (e) kpr with negative feedback; (f) kpr with induced rebinding. Plots were obtained as described in main text and in Appendix. Number of pMHCs, PT = 100. The values of the remaining parameters needed for computation in the different models are given in subsection 2.2.
Figure 2B
Figure 2B
Dependence of the values of R on time for three systems with equal affinity (A) but different values of kon(s-1) and koff(s-1). Panel models: (g) kpr with stabilizing activation chain; (h) kpr with limited and sustained signaling; (i) kpr with negative feedback and limited signaling; (j) kpr with stabilizing activation chain and limited signaling; (k) kpr with stabilizing activation chain and sustained signaling; (l) kpr with limited signaling coupled to an incoherent feed-forward loop. Other conditions as in Figure 2A.
Figure 3A
Figure 3A
Dependence of the values of R on time for three systems with different affinities (A) and different values of kon(s-1) and koff(s-1) given in the form (kon,koff): system 1: (1000kon, 1), τ = 1s, A = 1000kon (blue); system 2: (10kon, 0.10), τ = 10s, A = 100kon (red); system 3: (0.1kon, 0.01), τ = 100s, A = 10kon (black). Panel models: (a) occupancy model; (b) basic kpr; (c) kpr with limited signaling; (d) kpr with sustained signaling; (e) kpr with negative feedback; (f) kpr with induced rebinding. In some cases (v.g. b, blue curve), R-values are so small that their plots are almost coincident with the x-axis. Other conditions as in Figure 2A.
Figure 3B
Figure 3B
Dependence of the values of R on time for three systems with different affinities (A) and different values of kon(s-1) and koff(s-1). Panel models: (g) kpr with stabilizing activation chain; (h) kpr with limited and sustained signaling; (i) kpr with negative feedback and limited signaling; (j) kpr with stabilizing activation chain and limited signaling; (k) kpr with stabilizing activation chain and sustained signaling; (l) kpr with limited signaling coupled to an incoherent feed-forward loop. Other conditions as in Figures 2A, 3A.
Figure 4A
Figure 4A
Dependence of the values of R on time for three systems with different affinities (A), different values of kon(s-1) and equal values of koff(s-1) given in the form (kon,koff): system 1: (0.01kon, 0.1), τ = 10s, A = 0.1kon (blue); system 2: (kon, 0.1), τ = 10s, A = 10kon (red); system 3: (100kon, 0.1), τ = 10s, A = 1000kon (black). Panel models: (a) occupancy model; (b) basic kpr; (c) kpr with limited signaling; (d) kpr with sustained signaling; (e) kpr with negative feedback; (f) kpr with induced rebinding. Other conditions as in Figure 2A.
Figure 4B
Figure 4B
Dependence of the values of R on time for three systems with different affinities (A), different values of kon(s-1) and equal values of koff(s-1). Panel models: (g) kpr with stabilizing activation chain; (h) kpr with limited and sustained signaling; (i) kpr with negative feedback and limited signaling; (j) kpr with stabilizing activation chain and limited signaling; (k) kpr with stabilizing activation chain and sustained signaling; (l) kpr with limited signaling coupled to an incoherent feed-forward loop. Other conditions as in Figures 2A, 4A.
Figure 5A
Figure 5A
Dependence of the values of R on time for five systems with different affinities (A), different values of koff(s-1) and equal values of kon(s-1) given in the form (kon,koff): system 1: (kon, 10), τ = 0.1s, A = 0.1kon (blue); system 2: (kon, 1), τ = 1s, A = kon (red); system 3: (kon, 0.5), τ = 2s, A = 2kon (green); system 4: (kon, 0.2), τ = 5s, A = 5kon (magenta); system 5: (kon, 0.05), τ = 20s, A = 20kon (black). Panel models: (a) occupancy model; (b) basic kpr; (c) kpr with limited signaling; (d) kpr with sustained signaling; (e) kpr with negative feedback; (f) kpr with induced rebinding. Other conditions as in Figure 2A.
Figure 5B
Figure 5B
Dependence of the values of R on time for five systems with different affinities (A), different values of koff(s-1) and equal values of kon(s-1). Panel models: (g) kpr with stabilizing activation chain; (h) kpr with limited and sustained signaling; (i) kpr with negative feedback and limited signaling; (j) kpr with stabilizing activation chain and limited signaling; (k) kpr with stabilizing activation chain and sustained signaling; (l) kpr with limited signaling coupled to an incoherent feed-forward loop. Other conditions as in Figures 2A, 5A.
Figure 6A
Figure 6A
Dependence of the values of R on time for five systems with different affinities (A), different values of koff(s-1) and equal values of kon(s-1) given in the form (kon,koff): system 6: (kon, 0.02), τ = 50s, A = 50kon (blue); system 7: (kon, 0.01), τ = 100s, A = 100kon (red); system 8: (kon, 0.002), τ = 500s, A = 500kon (green); system 9: (kon, 0.001), τ = 1000s, A = 1000kon (magenta); system 10: (kon, 0.0001), τ = 10000s, A = 10000kon (black). Panel models: (a) occupancy model; (b) basic kpr; (c) kpr with limited signaling; (d) kpr with sustained signaling; (e) kpr with negative feedback; (f) kpr with induced rebinding. Other conditions as in Figure 2A.
Figure 6B
Figure 6B
Dependence of the values of R on time for five systems with different affinities (A), different values of koff(s-1) and equal values of kon(s-1). Panel models: (g) kpr with stabilizing activation chain; (h) kpr with limited and sustained signaling; (i) kpr with negative feedback and limited signaling; (j) kpr with stabilizing activation chain and limited signaling; (k) kpr with stabilizing activation chain and sustained signaling; (l) kpr with limited signaling coupled to an incoherent feed-forward loop. Other conditions as in Figures 2A, 6A.
Figure 7A
Figure 7A
Dependence of the values of R on time for three systems with equal affinity (A = 10kon, koff=0.1s-1), but different values of kp(s-1): system 1: kp = 1 (blue); system 2: kp = 0.5 (red); system 3: kp = 0.1 (black). Panel models: (a) occupancy model; (b) basic kpr; (c) kpr with limited signaling; (d) kpr with sustained signaling; (e) kpr with negative feedback; (f) kpr with induced rebinding. In some cases, R-values are so small that their plots are almost coincident with the x-axis. Other conditions as in Figure 2A.
Figure 7B
Figure 7B
As in Figure 7A, but panel models are now: (g) kpr with stabilizing activation chain; (h) kpr with limited and sustained signaling; (i) kpr with negative feedback and limited signaling; (j) kpr with stabilizing activation chain and limited signaling; (k) kpr with stabilizing activation chain and sustained signaling; (l) kpr with limited signaling coupled to an incoherent feed-forward loop.

Similar articles

Cited by

References

    1. Smith-Garvin JE, Koretzky GA, Jordan MS. T cell activation. Annu Rev Immunol. (2009) 27:591–19. 10.1146/annurev.immunol.021908.132706 - DOI - PMC - PubMed
    1. Weiss A, Littman DR. Signal transduction by lymphocyte antigen receptors. Cell. (1994) 76:263–74. 10.1016/0092-8674(94)90334-4 - DOI - PubMed
    1. Zarnitsyna V, Zhu C. T cell triggering: insights from 2D kinetics analysis of molecular interactions. Phys Biol. (2012) 9:045005. 10.1088/1478-3975/9/4/045005 - DOI - PubMed
    1. Lever M, Maini PK, van der Merwe PA, Dushek O. Phenotypic models of T cell activation. Nat Rev Immunol. (2014) 14:619–29. 10.1038/nri3728 - DOI - PubMed
    1. Stone JD, Chervin AS, Kranz DM. T-cell receptor binding affinities and kinetics: impact on T-cell activity and specificity. Immunology. (2009) 126:165–76. 10.1111/j.1365-2567.2008.03015.x - DOI - PMC - PubMed

MeSH terms