. 2019 Mar 6:13:22.
doi: 10.1186/s13036-019-0148-5. eCollection 2019.

Human three-dimensional in vitro model of hepatic zonation to predict zonal hepatotoxicity

Affiliations

Human three-dimensional in vitro model of hepatic zonation to predict zonal hepatotoxicity

Jaehwan Ahn et al. J Biol Eng. .

Abstract

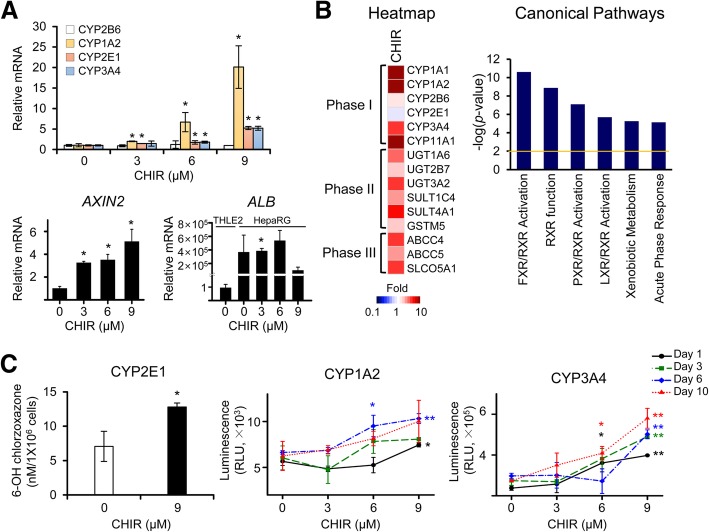
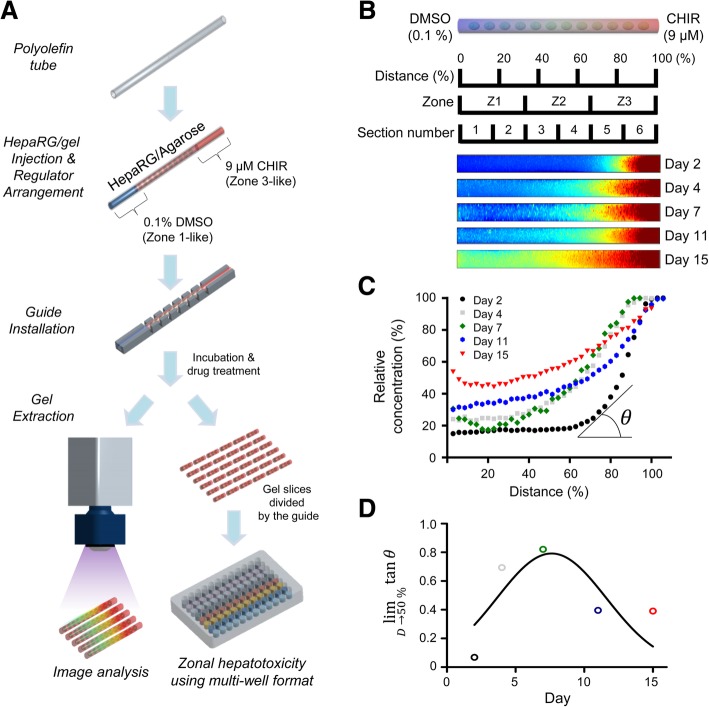
Background: Various hepatic models mimicking liver lobules have been investigated to evaluate the potential hepatotoxic effects of chemicals and drugs, but in vitro hepatic models of zonal hepatotoxicity have not yet been established. Herein, we developed a three-dimensional (3D) hepatic zonal channel to evaluate zone-specific hepatotoxicity. Based on the perivenous zone-3-like cytochrome P450 (CYP) expression patterns in metabolically active HepaRG cells treated with CHIR99021 (CHIR), which is an inducer of Wnt/β-catenin signaling, this culture model represents a novel tool for exploring hepatic zonation.

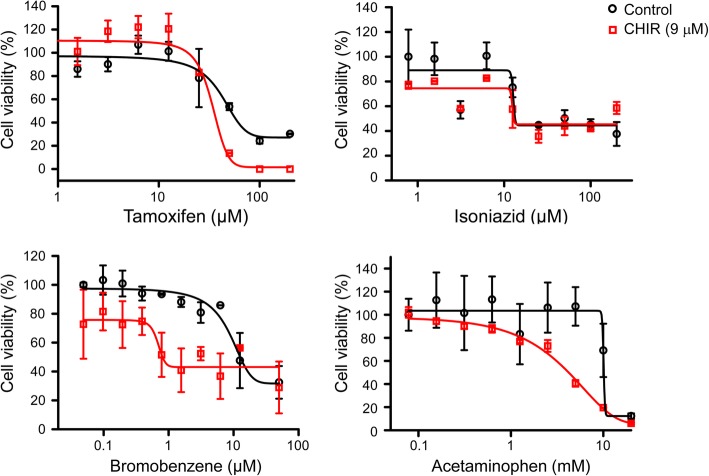
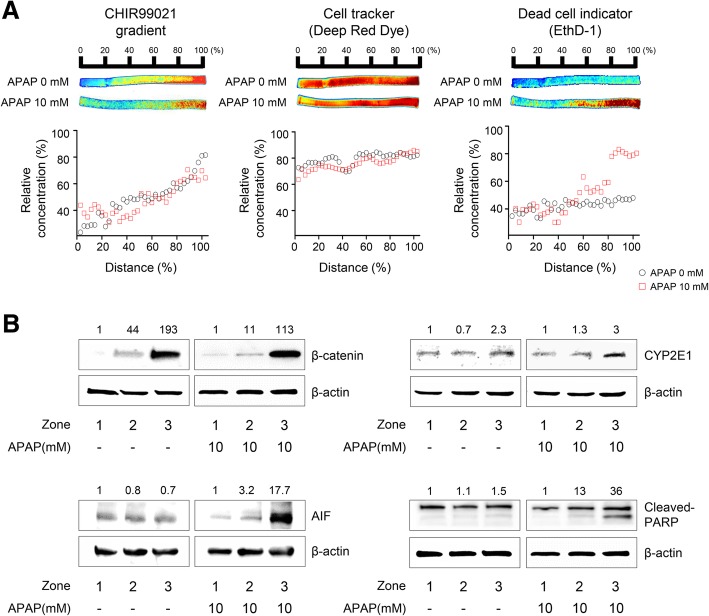
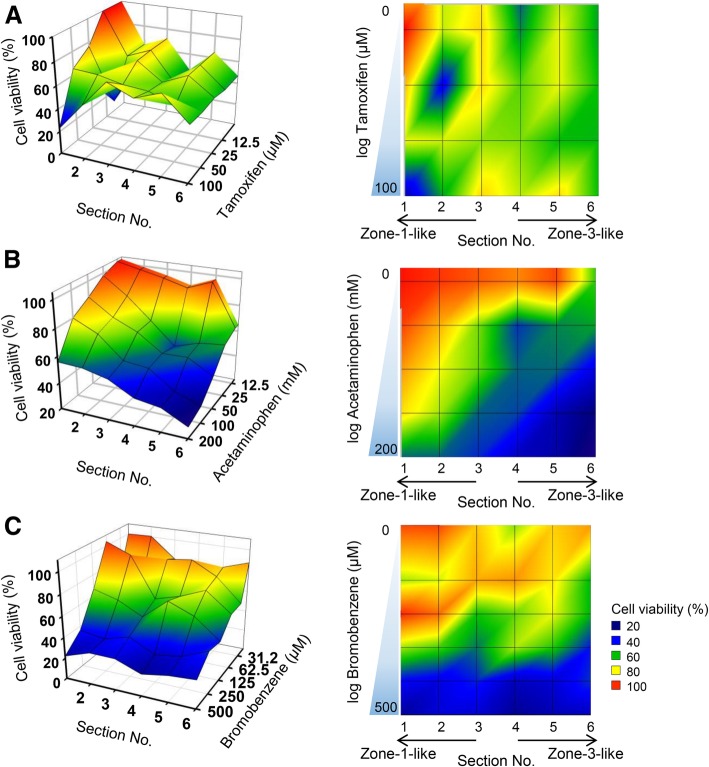
Results: We generated and validated a 3D hepatic zonal channel model in which 3D HepaRG cells were well distributed in agarose hydrogel channels, and a linear gradient of CHIR was generated according to the zonal distance. According to the results from imaging analyses and bioanalytical experiments, acetaminophen (APAP) caused cytotoxicity in the zone-3 region of the 3D hepatic zonal channel, and the levels of nonphosphorylated β-catenin, CYP2E, and apoptotic proteins were remarkably increased in the zone-3-like region. Finally, the applicability of the 3D hepatic zonal channel model for the high-throughput screening of zonal hepatotoxicity was successfully evaluated using hepatotoxic drugs, including tamoxifen, bromobenzene, and APAP.

Conclusions: The results indicated that tamoxifen induced cytotoxic effects, regardless of the zonal distance, while the zone-3-specific hepatotoxic drugs bromobenzene and APAP induced greater cytotoxic effects on cells in the zone-3-like region. This finding highlights the potential of our 3D hepatic zonation model as a valuable tool for replicating and evaluating zonal hepatotoxicity by mimicking the spatial features of liver lobules.

Keywords: Alternative hepatic model; CYP activities; Drug screening; Liver zonation; Wnt/β-catenin; Zonal hepatotoxicity.


Conflict of interest statement

Not applicable.Not applicable.The authors declare that they have no competing interests.Springer Nature remains neutral with regard to jurisdictional claims in published maps and institutional affiliations.

Figures

Fig. 1
Fig. 1
Changes in the expression and activity of CYP enzymes in HepaRG cells induced by the CHIR treatment. The expression of the CYP mRNAs and enzymatic activities of CYPs (CYP2B6, CYP1A2, CYP2E1, and CYP3A4) were analyzed in CHIR-treated HepaRG cells. a Fully differentiated HepaRG cells were exposed to various concentrations of CHIR. The relative levels of CYPs, AXIN2, and ALB (albumin) mRNAs in HepaRG cells were examined after 3 days of CHIR treatment using qRT-PCR. The relative level of ALB was calculated in the HepaRG cells before and after CHIR treatment comparing with THLE2 cells. The basal expression level of ALB mRNA in HepaRG cells was remarkably greater than that of THLE2 cells (b) A microarray analysis was performed using HepaRG cells that had been treated with 9 μM CHIR for 3 days. The heatmap of genes involved in drug metabolism was analyzed using Gene-E software, and canonical pathways of differentially expressed genes (2-fold, P < 0.01) were analyzed using IPA software. c Enzymatic activities of CYPs in HepaRG cells treated with CHIR for up to 10 days. The activities of CYP1A2 and CYP3A4 were measured using the P450-Glo CYP assay, and the CYP activity values were normalized to cell number by dividing the P450-Glo luminescence values by the CCK-8 absorbance values, according to the manufacturer’s instructions. CYP2E1 activity was measured by determining the conversion of chlorzoxazone to OH-chlorzoxazone using HPLC-tandem mass spectrometry. All data are presented as the means ± SD. *P < 0.05 and **P < 0.01 compared with the untreated group at each time point; Student’s t-test
Fig. 2
Fig. 2
Cell viability of HepaRG cells treated with four hepatotoxic drugs after CHIR pretreatment. The hepatotoxic drugs tamoxifen, isoniazid, bromobenzene, and APAP were administered to HepaRG cells pretreated with CHIR for 3 days. After 3 days of hepatotoxic drug treatment, the cell viability of HepaRG cells was measured using the CCK-8 assay, and the dose-response curve was analysed using GraphPad Prism software
Fig. 3
Fig. 3
Development of the in vitro 3D hepatic zonation platform. a Schematic flow of the zonal hepatotoxicity evaluation system using the 3D hepatic zonal channel model. An agarose hydrogel gel containing HepaRG cells was injected into the polyolefin tube, and 3D HepaRG cells were cultured in the gel matrix for 7 days. For natural diffusion, 0.1% DMSO and 9 μM CHIR were located at the left (Inlet 1) and right side (Inlet 2) of the channel, respectively. The 3D hepatic zonal channel can be sliced into several pieces representing zone-1-like, zone-2-like and zone-3-like sections with the installed guide and then treated with hepatotoxic chemicals. b The relative CHIR diffusion in the 3D hepatic zonal channel was monitored for up to 15 days by UV illumination using the ChemiDoc XRS+ Imaging System. The intensity of CHIR across the 3D hepatic zonal channel was imaged using the MATLAB program. c The relative intensity of CHIR according to the distance from Inlet 1 to Inlet 2 was quantified using the MATLAB program and plotted. d The intensity-concentration curves for each time point were analysed with the curve-fitting method, and the linearity was calculated from the limit (lim) of tangent Ɵ approaching 50% of the distances. A tangent value close to 1 indicates the most linearity. On day 7, the CHIR concentration profile was close to a linear diffusion gradient in the 3D hepatic zonal channel
Fig. 4
Fig. 4
Evaluation of the in vitro zonal hepatotoxicity using the 3D hepatic zonation model. a Application of the 3D hepatic zonation model using imaging analysis after APAP treatment. The intact 3D HepaRG sample in the agarose hydrogel channel was removed from the polyolefin tube and then treated with 10 mM APAP for 2 days in a multi-well plate. Quantitative analysis of 3D hepatic zonal channels was performed using staining with dual live/dead dyes as well as CHIR for diffusion of CHIR, CellTracker Deep Red Dye for cellular distribution, and EthD-1 for membrane-damaged cytotoxic cells, and the ChemiDoc XRS+ Imaging System, and images were visualized and analysed with MATLAB. The red and blue colours indicate high and low intensity of the dyes, respectively. The relative concentration was quantified and plotted for the control and APAP-treated groups. The EthD-1+-damaged cells were predominantly observed in the high CHIR concentration region in response to 10 mM APAP treatment. b Molecular experimental approaches using the 3D hepatic zonation model. The 3D HepaRG sample was removed from the 3D hepatic zonal channel and then divided into 3 pieces corresponding to zone-1-like, zone-2-like and zone-3-like regions according to the guide. After treatment with 10 mM APAP for 2 days, total protein was extracted from the 3D HepaRG and western blot analysis was performed. The expression of β-catenin, CYP2E1, AIF, and cleaved PARP was analysed, and β-actin was used as an internal control
Fig. 5
Fig. 5
Imaging profiles of zonal hepatotoxicity using the 3D hepatic zonal channel model. Three different hepatotoxic drugs, tamoxifen (a), APAP (b), and bromobenzene (c), were administered to the sectioned 3D HepaRG sample with an CHIR gradient for 2 days, and cell viability was then evaluated as described in the Materials and Methods section. The values of the x-, y- and z-axes indicate the section number (from 1 to 6), cell viability, and drug concentration, respectively. The imaging profiles display the relative cell viability according to the colour legend. The red and blue colours indicate higher and lower cell viability, respectively

References

    1. Rappaport AM, Borowy ZJ, Lougheed WM, Lotto WN. Subdivision of hexagonal liver lobules into a structural and functional unit; role in hepatic physiology and pathology. Anat Rec. 1954;119(1):11–33. - PubMed
    1. Jungermann K, Kietzmann T. Zonation of parenchymal and nonparenchymal metabolism in liver. Annu Rev Nutr. 1996;16:179–203. - PubMed
    1. Torre C, Perret C, Colnot S. Molecular determinants of liver zonation. Prog Mol Biol Transl Sci. 2010;97:127–150. - PubMed
    1. Jungermann K, Kietzmann T. Oxygen: modulator of metabolic zonation and disease of the liver. Hepatology. 2000;31(2):255–260. - PubMed
    1. Gebhardt R. Metabolic zonation of the liver: regulation and implications for liver function. Pharmacol Ther. 1992;53(3):275–354. - PubMed