. 2019 Jan 15;6(5):1801809.
doi: 10.1002/advs.201801809. eCollection 2019 Mar 6.

Synergistic MicroRNA Therapy in Liver Fibrotic Rat Using MRI-Visible Nanocarrier Targeting Hepatic Stellate Cells

Affiliations

Synergistic MicroRNA Therapy in Liver Fibrotic Rat Using MRI-Visible Nanocarrier Targeting Hepatic Stellate Cells

Jun Wu et al. Adv Sci (Weinh). .

Abstract

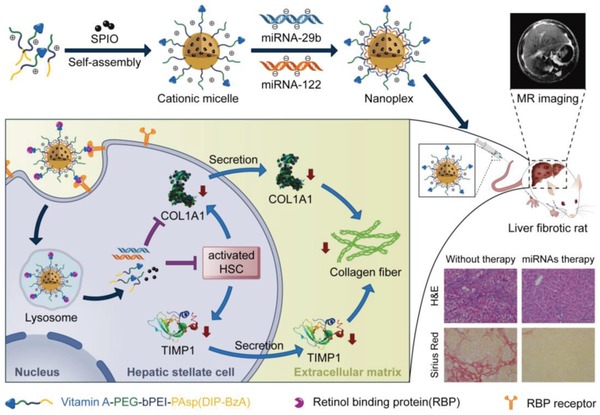
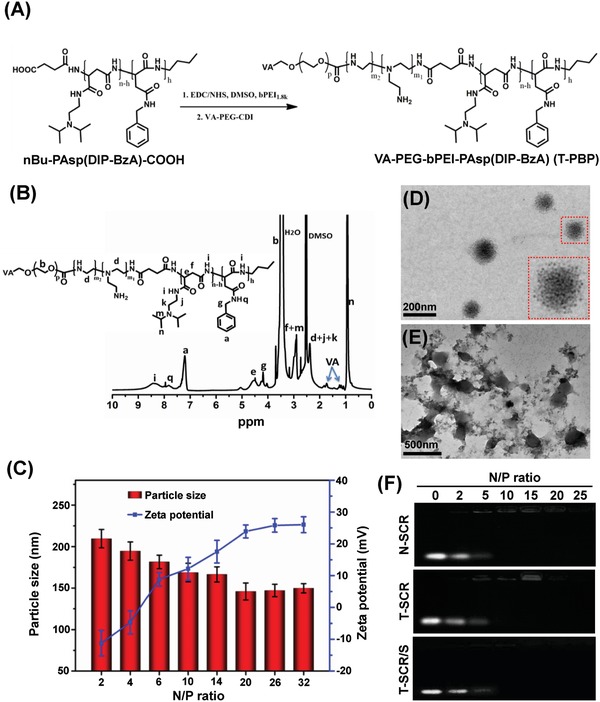
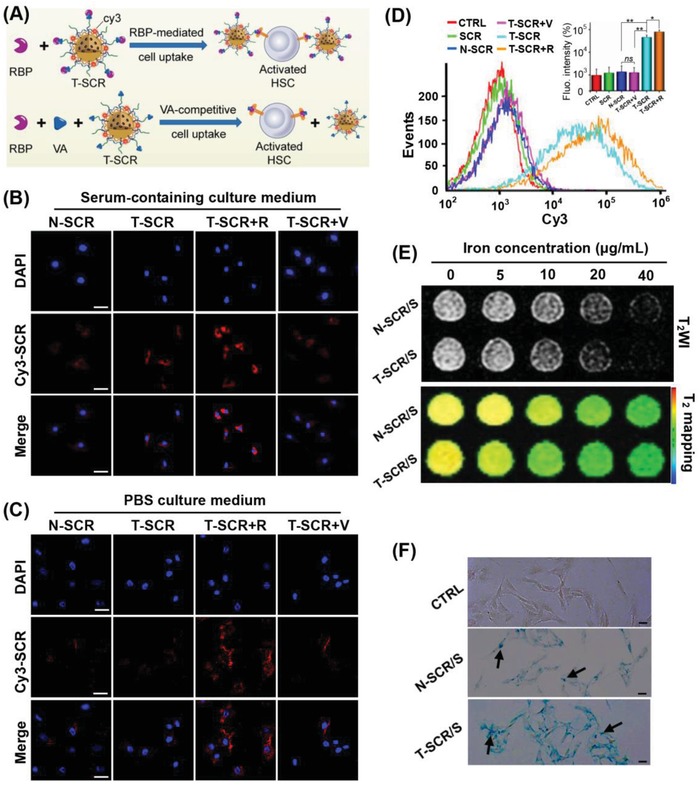
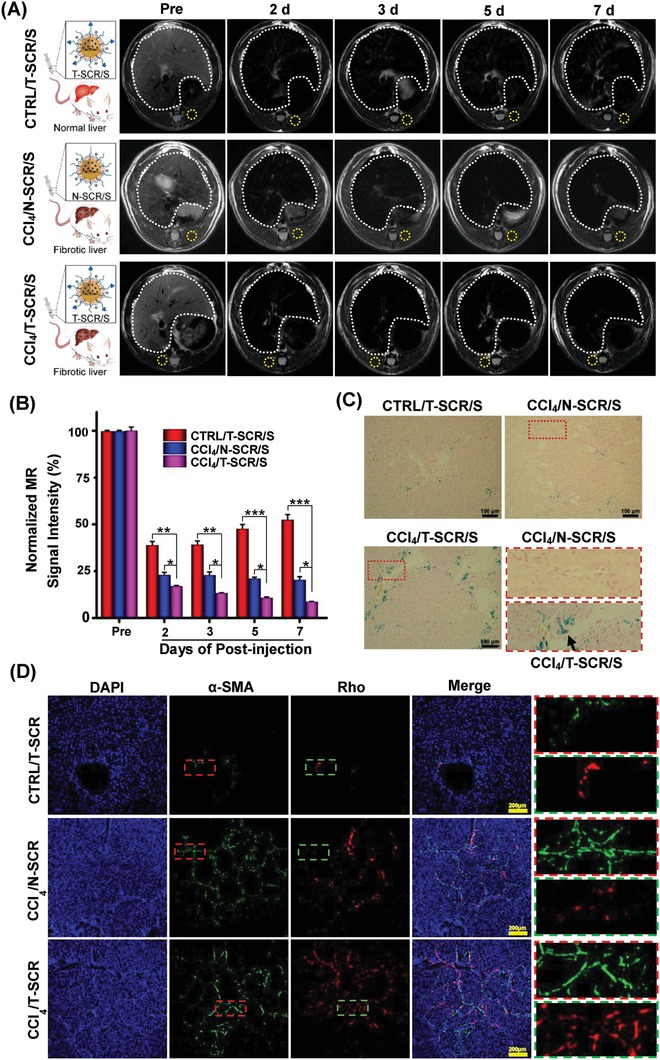
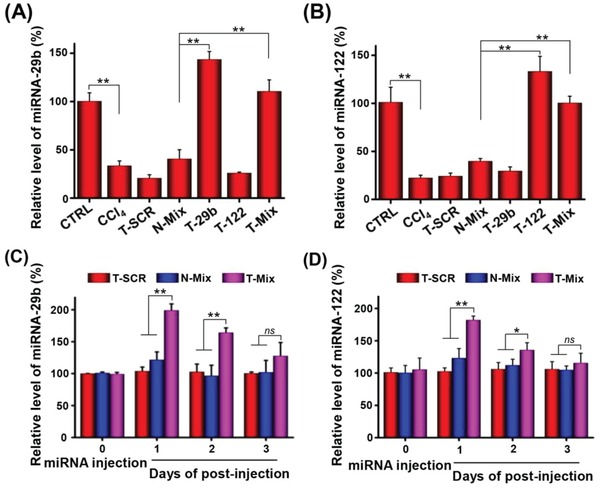
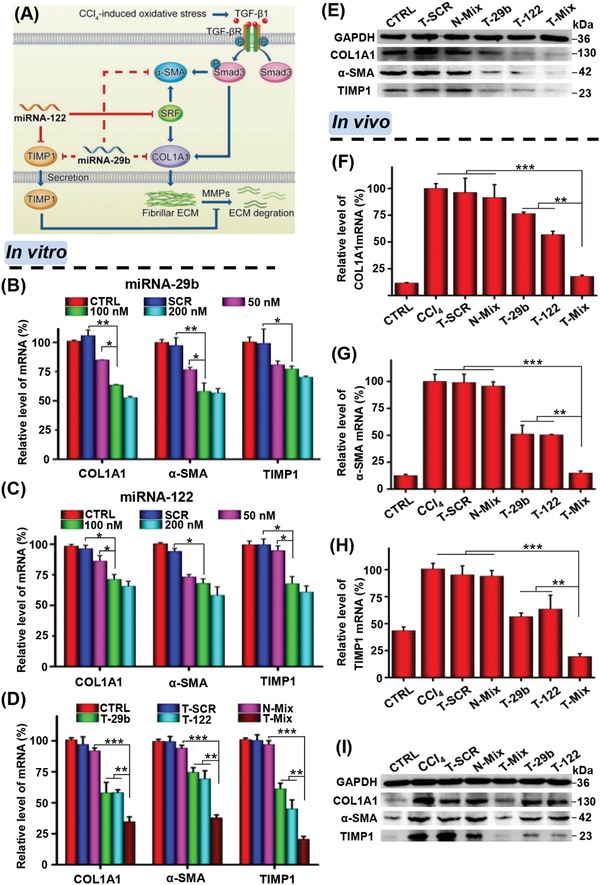
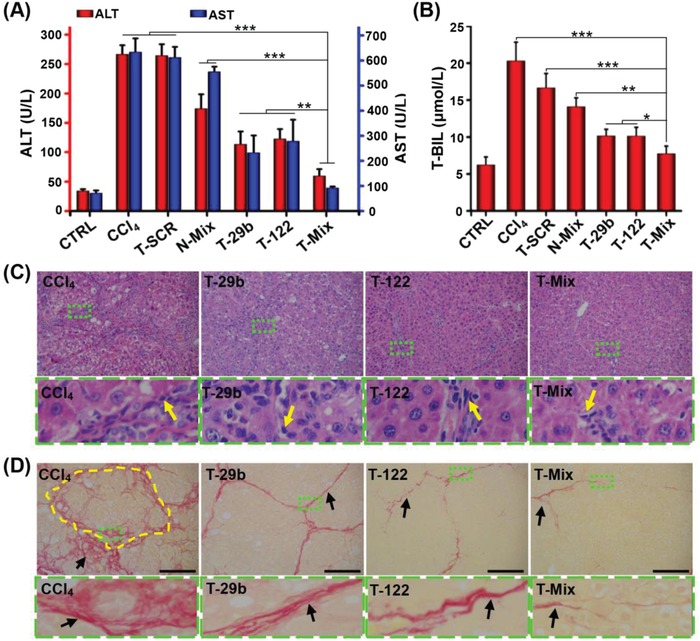
Liver fibrosis, as one of the leading causes of liver-related morbidity and mortality, has no Food and Drug Administration (FDA)-approved antifibrotic therapy yet. Although microRNA-29b (miRNA-29b) and microRNA-122 (miRNA-122) have great potential in treating liver fibrosis via regulating profibrotic genes in hepatic stellate cells (HSCs), it is still a challenge to achieve a HSC-targeted and meanwhile noninvasively trackable delivery of miRNAs in vivo. Herein, a pH-sensitive and vitamin A (VA)-conjugated copolymer VA-polyethylene glycol-polyethyleneimine-poly(N-(N',N'-diisopropylaminoethyl)-co-benzylamino) aspartamide (T-PBP) is synthesized and assembled into superparamagnetic iron oxide (SPIO)-decorated cationic micelle for miRNA delivery. The T-PBP micelle efficiently transports the miRNA-29b and miRNA-122 to HSC in a magnetic resonance imaging-visible manner, resulting in a synergistic antifibrosis effect via downregulating the expression of fibrosis-related genes, including collagen type I alpha 1, α-smooth muscle actin, and tissue inhibitor of metalloproteinase 1. Consequently, the HSC-targeted combination therapy with miRNA-29b and miRNA-122 demonstrates a prominent antifibrotic efficacy in terms of improving liver function and relieving hepatic fibrosis.

Keywords: hepatic stellate cells; liver fibrosis; magnetic resonance imaging visibility; miRNA delivery; nanomedicine; synergistic therapy.


Conflict of interest statement

The authors declare no conflict of interest.

Figures

Figure 1
Figure 1
Schematic illustration of the preparation of vitamin A–decorated pH‐sensitive and SPIO‐loaded nanoplex T‐PBP@miRNA/SPIO (T‐miRNA/S) for miRNA targeting delivery, resulting in synergistically downregulated expression of liver fibrosis–related genes for alleviating liver fibrosis. The red arrows indicate the reduction of COL1A1, TIMP1, and collagen fiber. Abbreviations: COL1A1, collagen type I alpha 1 protein; TIMP1, tissue inhibitor of metalloproteinase 1; SPIO, superparamagnetic iron oxide.
Figure 2
Figure 2
Synthesis and characterization of the polymer and nanoplexes. A) Synthetic route of the triblock copolymer VA–PEG–bPEI–PAsp(DIP–BzA) denoted as T‐PBP. B) 1H NMR spectrum of the T‐PBP polymer. C) Particle size and zeta potential of SPIO‐loaded nanoplex (T‐SCR/S) with different N/P ratios at pH 7.4. Data are shown as mean ± SD, n = 3. TEM images of T‐SCR/S (N/P 10) at D) pH 7.4 and E) pH 5.0. F) Electrophoretic mobility of SCR in agarose gel after complexation with SPIO‐free micelle (N‐SCR and T‐SCR) and SPIO‐loaded micelle (T‐SCR/S) at various N/P ratios. Abbreviations: SCR, scrambled miRNA; N‐SCR, nontargeting PBP micelle complexing SCR; T‐SCR, targeting T‐PBP micelle complexing SCR; T‐SCR/S, T‐PBP micelle complexing SCR and encapsulating SPIO.
Figure 3
Figure 3
HSC‐targeted miRNA delivery and MRI capacity of the targeting nanoplexes. A) Schematic illustration of the RBP‐mediated cell uptake and competitive inhibition effect of excessive free vitamin A. CLSM images of HSCs after incubation with N‐SCR, T‐SCR, T‐SCR+R, and T‐SCR+V in B) serum‐containing culture medium for 2 h and C) PBS culture medium for 0.5 h. The blue and red fluorescence indicate the DAPI‐labeled nuclei and Cy3‐labeled SCR, respectively. Scale bars represent 20 µm. D) Quantification of Cy3‐labeled miRNA transfection efficiency mediated by naked SCR and various nanoplexes (i.e., N‐SCR, T‐SCR, T‐SCR+R, and T‐SCR+V) for 2 h in serum‐containing culture medium. Data are shown as mean ± SD, n = 3. *P < 0.05, **P < 0.01, and ns represents no significant difference. E) T2‐weighted imaging (T2WI) and T2 mapping imaging of HSCs after incubation with N‐SCR/S and T‐SCR/S at various Fe concentrations. F) Intracellular distribution of SPIO using Prussian blue staining. Cells were incubated with SPIO‐encapsulated nanoplexes for 2 h. Scale bars represent 100 µm. The black arrows mark the SPIO in HSCs. All nanoplexes were prepared at an N/P ratio of 10. Abbreviations: RBP, retinol‐binding protein; CTRL, cells without treatment; N‐SCR, PBP micelle complexing SCR; T‐SCR, T‐PBP micelle complexing SCR; T‐SCR+V, T‐SCR nanoplex plus preincubation with excessive vitamin A; T‐SCR+R, T‐SCR nanoplex plus preincubation with RBP at a concentration of 0.7 µg mL−1; N‐SCR/S, SPIO‐encapsulated N‐SCR; T‐SCR/S, SPIO‐encapsulated T‐SCR.
Figure 4
Figure 4
In vivo distribution of the nontargeting and targeting nanoplexes in normal rats and liver fibrotic rats using MRI and ex vivo fluorescence imaging. A) T2‐weighted imaging of liver in rats before (Pre) and after i.v. injection of N‐SCR/S and T‐SCR/S at various time points. SPIO dose: 10 mg Fe kg−1 body weight. The white dotted portions indicate liver tissue, and the yellow dotted portions indicate the muscle tissue. B) T2‐weighted MR signal intensity of liver normalized by referring to that of the muscle tissue. Data are shown as mean ± SD, n = 3. *P < 0.05, **P < 0.01, and ***P < 0.001. C) Prussian blue staining of liver sections excised from rats receiving N‐SCR/S and T‐SCR/S. The areas marked with dotted red rectangle are amplified to clearly show the SPIO nanoparticles. The black arrows mark the SPIO. D) Colocalization of nanoplexes and HSCs in vivo. Blue, red, and green fluorescence indicate the DAPI‐labeled nuclei, Rho‐labeled nanocarrier, and AF488‐labeled antibody against α‐SMA (a biomarker of HSCs), respectively. Scale bars represent 100 and 200 µm in parts (C) and (D), respectively. Abbreviations: Rho, rhodamine B; CTRL/T‐SCR/S, normal rats receiving T‐SCR/S; CCl4/N‐SCR/S, CCl4‐induced liver fibrotic rats receiving N‐SCR/S; CCl4/T‐SCR/S, CCl4‐induced liver fibrotic rats receiving T‐SCR/S; CTRL/T‐SCR, normal rats receiving Rho‐labeled T‐SCR; CCl4/N‐SCR, CCl4‐induced liver fibrotic rats receiving Rho‐labeled N‐SCR; CCl4/T‐SCR, CCl4‐induced liver fibrotic rats receiving Rho‐labeled T‐SCR.
Figure 5
Figure 5
Content and time duration of the miRNA in CCl4‐induced liver fibrotic rats with/without extrinsic miRNA administration as determined by RT‐PCR. Relative levels of A) miRNA‐29b and B) miRNA‐122 in livers at 24 h after i.v. administration of different nanoplexes. Content of C) miRNA‐29b and D) miRNA‐122 at 1, 2, and 3 d after i.v. injection of different nanoplexes. The dose of miRNA‐29b and miRNA‐122 was 1 mg kg−1 body weight. Data are shown as mean ± SD, n = 3. *P < 0.05 and **P < 0.01. Abbreviations: N‐Mix, PBP micelle complexing miRNA‐29b and miRNA‐122; T‐Mix, T‐PBP micelle complexing miRNA‐29b and miRNA‐122.
Figure 6
Figure 6
miRNA dose and synergistic effect of miRNA‐29b and miRNA‐122 on inhibition of fibrosis‐related gene expressions in vitro and in vivo. A) Schematic illustration of the synergistic antifibrosis mechanism of combined therapy with miRNA‐29b and miRNA‐122. Relative mRNA levels of COL1A1, α‐SMA, and TIMP1 in HSCs incubated with B) miRNA‐29b and C) miRNA‐122 at 0, 50, 100, and 200 × 10−9 m complexed with T‐PBP micelle. Synergistic effect of a combination of miRNA‐29b and miRNA‐122 on D) mRNA and E) protein expressions of COL1A1, α‐SMA, and TIMP1 as evaluated by real‐time PCR and Western blot. The concentration of miRNA was 100 × 10−9 m, and 50 × 10−9 m miRNA‐29b and 50 × 10−9 m miRNA‐122 were used for N‐Mix and T‐Mix groups, respectively. F–H) Relative mRNA and I) protein expressions of COL1A1, α‐SMA, and TIMP1 in the liver sliced from rats receiving different treatments. Data are shown as mean ± SD, n = 3. *P < 0.05, **P < 0.01, and ***P < 0.001. Abbreviations: CTRL in parts (B)–(E), cells without treatment; T‐SCR, T‐PBP micelle complexing SCR; N‐Mix, PBP micelle complexing miRNA‐29b and miRNA‐122; T‐29b, T‐PBP micelle complexing miRNA‐29b; T‐122, T‐PBP micelle complexing miRNA‐122; T‐Mix, T‐PBP micelle complexing miRNA‐29b and miRNA‐122; CTRL in parts (F)–(I), normal rat treated with equal quantity of olive oil; CCl4, CCl4‐induced liver fibrotic rat just treated with PBS. Rats, except in the CTRL group, were pretreated with CCl4 to induce liver fibrosis.
Figure 7
Figure 7
In vivo synergistic antifibrotic effect of miRNA‐29b and miRNA‐122. Effect of various miRNA treatments on A) serum ALT and AST levels and B) T‐BIL levels. Data are shown as mean ± SD, n = 3. *P < 0.05, **P < 0.01, and ***P < 0.001. C) H&E and D) Sirius red staining of liver specimen of CCl4‐induced rats after i.v. administration of various nanoplexes. The areas marked with dotted green rectangle are enlarged to reveal the changes of pathological structure. The yellow arrows indicate the inflammatory cells, and the yellow dotted portion indicates the pseudolobule in liver. The black arrows mark the collagen fiber. Scale bars represent 100 µm.

Similar articles

Cited by

References

    1. Wang P., Koyama Y., Liu X., Xu J., Ma H. Y., Liang S., Kim I. H., Brenner D. A., Kisseleva T., Front. Physiol. 2016, 7, 47. - PMC - PubMed
    1. Schuppan D., Kim Y. O., J. Clin. Invest. 2013, 123, 1887. - PMC - PubMed
    1. Koyama Y., Brenner D. A., J. Clin. Invest. 2017, 127, 55. - PMC - PubMed
    1. Seki E., Schwabe R. F., Hepatology 2015, 61, 1066. - PMC - PubMed
    1. Vogt J., Traynor R., Sapkota G. P., Cell. Signalling 2011, 23, 1831. - PubMed

LinkOut - more resources