. 2019 Mar 14:2:102.
doi: 10.1038/s42003-019-0345-2. eCollection 2019.

Neural oscillations in the primate caudate nucleus correlate with different preparatory states for temporal production

Affiliations

Neural oscillations in the primate caudate nucleus correlate with different preparatory states for temporal production

Tomoki W Suzuki et al. Commun Biol. .

Abstract

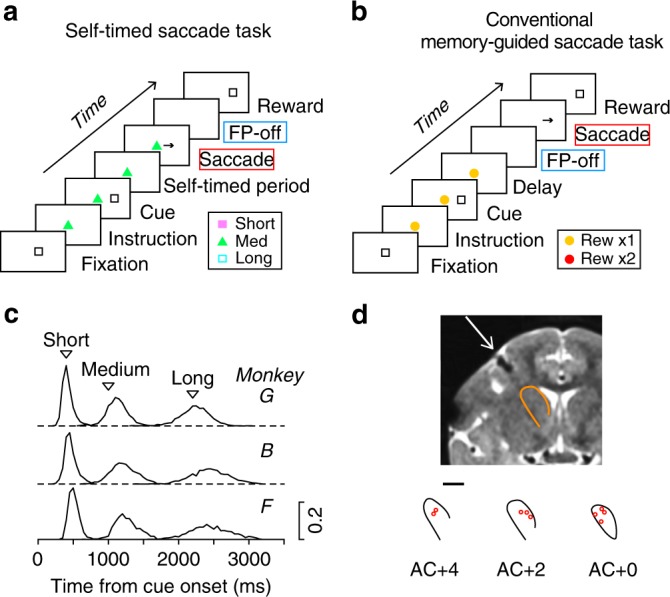
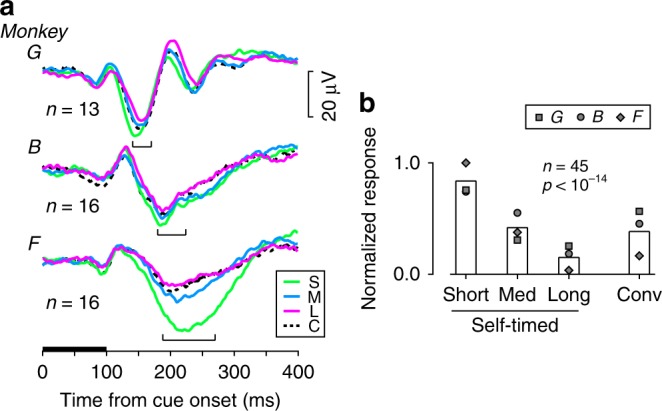
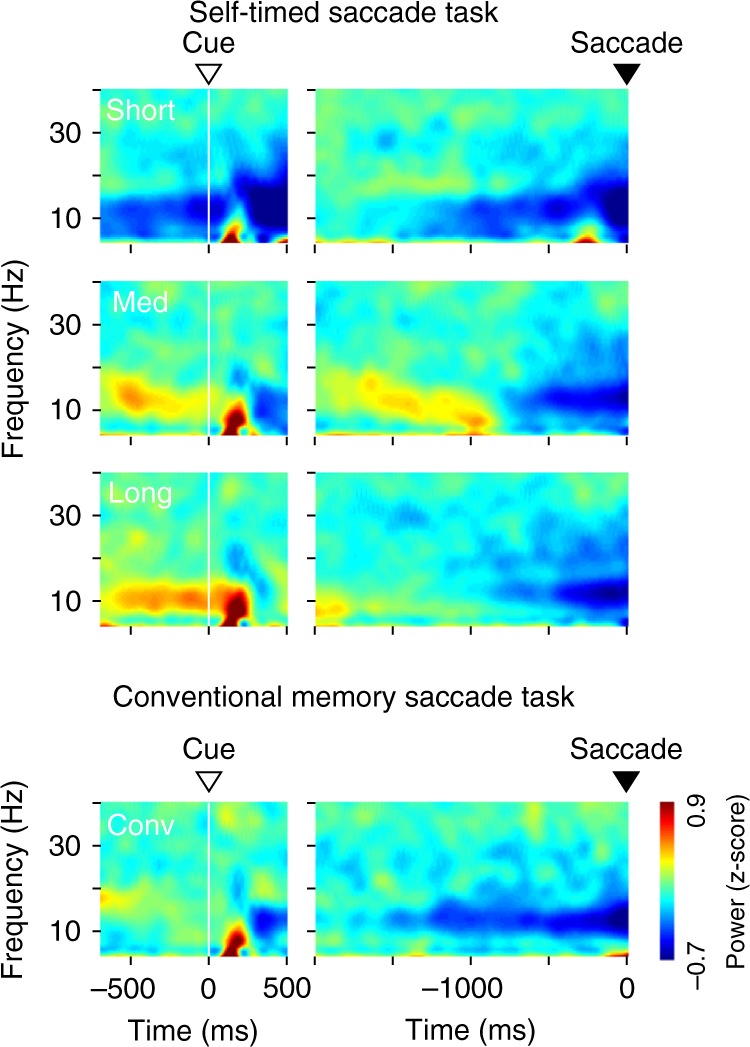
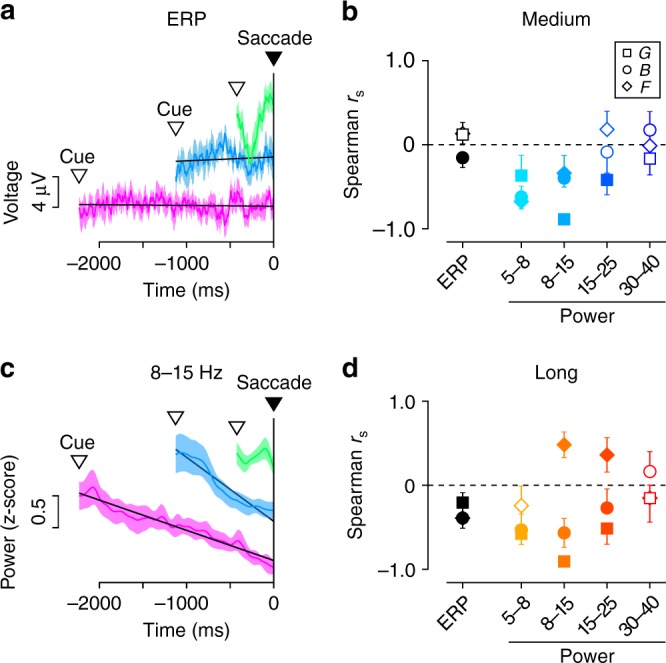
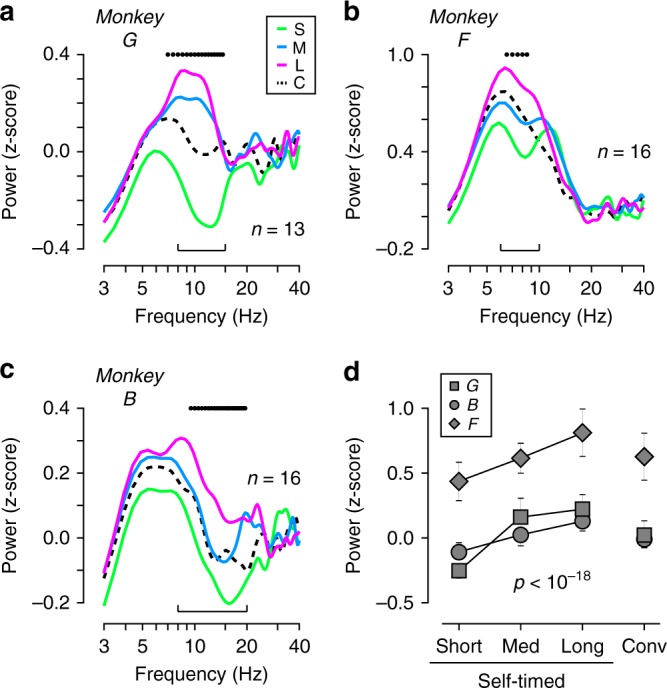
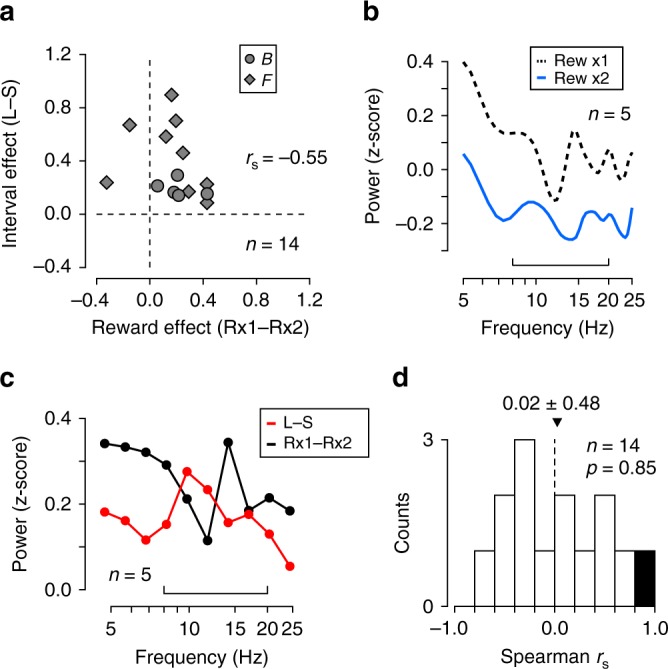
When measuring time, neuronal activity in the cortico-basal ganglia pathways has been shown to be temporally scaled according to the interval, suggesting that signal transmission within the pathways is flexibly controlled. Here we show that, in the caudate nuclei of monkeys performing a time production task with three different intervals, the magnitude of visually-evoked potentials at the beginning of an interval differed depending on the conditions. Prior to this response, the power of low frequency components (6-20 Hz) significantly changed, showing inverse correlation with the visual response gain. Although these components later exhibited time-dependent modification during self-timed period, the changes in spectral power for interval conditions qualitatively and quantitatively differed from those associated with the reward amount. These results suggest that alteration of network state in the cortico-basal ganglia pathways indexed by the low frequency oscillations may be crucial for the regulation of signal transmission and subsequent timing behavior.


Conflict of interest statement

The authors declare no competing interests.

Figures

Fig. 1
Fig. 1
Behavioral paradigms and the locations of recording sites. a In the self-timed saccade task, monkeys were trained to generate a self-initiated saccade to the location of a briefly presented visual cue (100 ms) after the mandatory delay interval (400, 1000, or 2200 ms). b In the conventional memory-guided saccade (MS) task, animals made a saccade in response to the fixation point (FP) offset that occurred 800–2500 ms after the visual cue. Each task condition was indicated by specific color and shape of the FP, and the stimulus set for monkey F is shown here. A different set of the FP color and shape was used for the other two monkeys (see Methods). The visual cue appeared 800–1700 ms following the onset of this instruction. c Distributions of self-timed saccade latency during LFP recording in three monkeys (n = 3225, 4373, and 4588 trials for monkeys G, B, and F, respectively). Inverted triangles indicate the minimal mandatory intervals to obtain reward. d Coronal MR image (AC + 2) and recording sites (red circles) in monkey F. Scale bar represents 5 mm. Recording sites were reconstructed from histological sections in monkey G (Supplementary Figure 1). AC, anterior commissure
Fig. 2
Fig. 2
Contextual modulation of visually evoked potentials. a Time courses of striatal LFPs aligned with the cue onset in the contralateral visual field. Colored traces indicate the self-timed trials with different interval conditions. Black dashed traces indicate the conventional MS trials. The horizontal black bar denotes the timing of cue presentation. Brackets indicate the ranges of maximal response timing. b Comparison of the magnitude of visually evoked response. Each bar summarizes normalized response obtained from 45 sites. Different symbols plot the means of different monkeys. A one-way repeated measures ANOVA revealed a statistically significant difference across the interval conditions (F2,88 = 50.4, p < 10−14). Conv, conventional memory-guided saccade (MS) task
Fig. 3
Fig. 3
Color-coded power spectra of LFP in monkey G (n = 13 sites) for the self-timed and the conventional MS tasks. Zero in the abscissa indicates either the cue onset (left panels) or saccade initiation (right). Data for the other two monkeys are shown in Supplementary Figure 2
Fig. 4
Fig. 4
Temporally variable LFP components during the self-timed period in the self-timed task. a Time courses of event-related potentials (ERP) during saccade preparation in monkey G (n = 13 sites). Green, blue, and magenta traces indicate the means (±95% CIs) for the short, medium, and long interval conditions, respectively. Inverted open triangles indicate the means of cue onset time relative to saccades. The traces are shifted vertically for presentation purpose only. Black lines indicate linear regressions for the average traces in the medium and long interval conditions. b Spearman’s rank correlation coefficients (rs) computed between time (10 bins) and ERP or the power of different LFP components in the medium interval (1000 ms) condition. Different shapes of symbols represent different animals. Filled symbols indicate the data showing a significant difference from zero (one-sample t-test, n = 13 or 16, p < 0.05). Error bars indicate 95% CIs. c Similar configuration as in a, but for the time courses of LFP power at 8–15 Hz. d Rank correlation coefficients computed for the long interval (2200 ms) condition
Fig. 5
Fig. 5
Spectral analysis of LFP during the pre-cue period. a–c Power spectra for monkeys G (a, n = 13 sites), F (b, n = 16), and B (c, n = 16). On each panel, black dots above the traces represent a significant difference across the interval conditions (one-way factorial ANOVA, 2 Hz bin with 0.5 Hz step, p < 0.01, see Methods). Brackets denote the frequency bands used for further quantification. d Comparison of the powers of low-frequency components. Different symbols denote different animals. Error bars indicate 95% CIs. The LFP power differed significantly across the interval conditions (repeated measures ANOVA, F2,88 = 71.5, p < 10−18)
Fig. 6
Fig. 6
Effects of reward amount on the striatal LFP. a Comparison between the effects of reward amount and delay interval. Each point represents single site and compares the alteration in power at the low-frequency bands indicated by brackets in Fig. 5b, c. b Effects of reward amount for a broader frequency band in monkey B (n = 5 sites). The bracket indicates the frequency band used for the analysis in a. c Comparison of spectral modulation associated with interval condition (red, Long minus Short) with that associated with reward amount (black, Reward × 2 minus × 1). Data were divided into 10 groups. d Distribution of rank correlation coefficients computed for the two power spectra shown in c for individual sites in two monkeys. The black bar indicates statistically significant correlation (p < 0.05). Overall, the values were not statistically different from zero (two-tailed t-test, t13 = 0.19, p = 0.85)

Similar articles

Cited by

References

    1. Merchant H, Harrington DL, Meck WH. Neural basis of the perception and estimation of time. Annu. Rev. Neurosci. 2013;36:313–336. doi: 10.1146/annurev-neuro-062012-170349. - DOI - PubMed
    1. Paton JJ, Buonomano DV. The neural basis of timing: distributed mechanisms for diverse functions. Neuron. 2018;98:687–705. doi: 10.1016/j.neuron.2018.03.045. - DOI - PMC - PubMed
    1. Malapani C, et al. Coupled temporal memories in Parkinson’s disease: a dopamine-related dysfunction. J. Cogn. Neurosci. 1998;10:316–331. doi: 10.1162/089892998562762. - DOI - PubMed
    1. Coull JT, Cheng RK, Meck WH. Neuroanatomical and neurochemical substrates of timing. Neuropsychopharmacology. 2011;36:3–25. doi: 10.1038/npp.2010.113. - DOI - PMC - PubMed
    1. Lee IH, Assad JA. Putaminal activity for simple reactions or self-timed movements. J. Neurophysiol. 2003;89:2528–2537. doi: 10.1152/jn.01055.2002. - DOI - PubMed

Publication types