

doi: 10.1038/s42255-019-0036-9.
Epub 2019 Feb 25.
AMPK activation protects against diet induced obesity through Ucp1-independent thermogenesis in subcutaneous white adipose tissue
Affiliations
- PMID: 30887000
- PMCID: PMC6420092
- DOI: 10.1038/s42255-019-0036-9
Item in Clipboard
AMPK activation protects against diet induced obesity through Ucp1-independent thermogenesis in subcutaneous white adipose tissue
Nat Metab.
2019 Mar.
No abstract available
Conflict of interest statement
Competing interests The authors declare no competing interests.
Figures
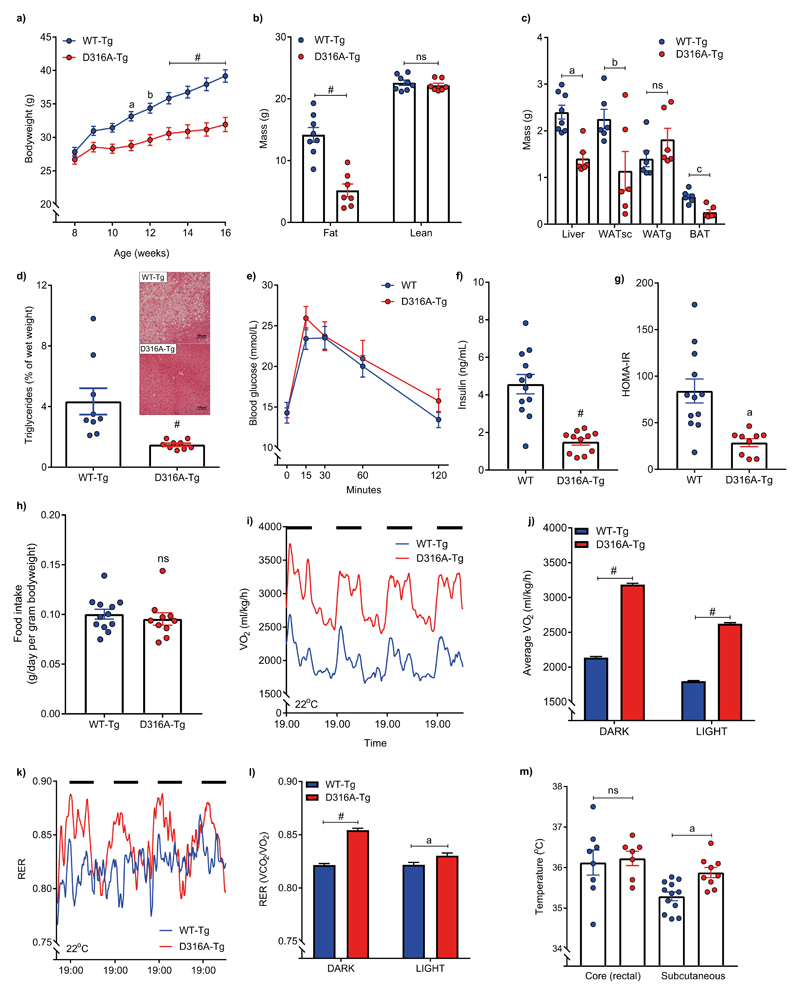
Male mice expressing either wild-type γ1 (WT-Tg) or the D316A γ1 transgene (D316A-Tg) were fed a high fat diet (HFD) from 8 weeks of age. a, Bodyweight (n=20 for WT-Tg, and 17 for D316A-Tg). aP=0.002, bP=0.0006 and #P<0.0001 b, Total body fat and lean mass after 8 weeks on HFD (#P<0.0001) and (c) tissue weights after 16 weeks on HFD (n=8 per genotype; aP=0.0004, bP=0.0378, cP=0.0012, ns=not significant). d, Liver triglyceride levels in mice fed a HFD for 16 weeks (n=9 per genotype; #P<0.0001)). A representative image (from 9 independent mice per genotype) of H&E stained liver sections from HFD fed mice is shown as an inset. e, Oral glucose tolerance test and (f), fasted (6 h) serum insulin levels of mice fed a HFD for 12 weeks (n=12 for WT-Tg and 11 for D316A-Tg; #P<0.0001). g, HOMA IR calculated from 6 h fasted glucose and insulin levels (n=12 for WT-Tg and 9 for D316A-Tg, aP=0.0012). h, Food intake over a 5-day period (n=12 for WT-Tg and 10 for D316A-Tg, ns=not significant). i, Whole body oxygen consumption (VO2) monitored continuously over an 84-hour period, and (j) average VO2 during 12 h light and 12 h dark periods (dark periods represented by the solid black bars). Data points from individual mice were omitted in the graph to more clearly show mean values and error bar sizes. #P<0.0001. (k) Respiratory exchange ratio (RER) over 84 h and (l) average RER during light and dark periods. Data points from individual mice were omitted in the graph to more clearly show mean values and error bar sizes. aP=0.0086 #P<0.0001. For (i-l) mice were fed a HFD for 6 weeks (n=8 for WT-Tg and 6 for D316A-Tg mice). m, core (n=8 for WT-Tg and 7 for D316A-Tg mice) and subcutaneous (n=12 for WT-Tg and 9 for D316A-Tg mice) body temperature in mice fed a HFD for 12 weeks. aP=0.0022, ns=not significant). In all cases the results shown are the mean ±sem. Statistical analyses in panels a, b, e, j and l were performed by two-way ANOVA followed by Bonferroni’s multiple comparisons test. Statistical analyses in panels c, f, g, h and m were performed by Student’s t-test, unpaired, 2-tailed, with Welch’s correlation applied to f and g. Data in panel d were analysed by Mann-Whitney test.
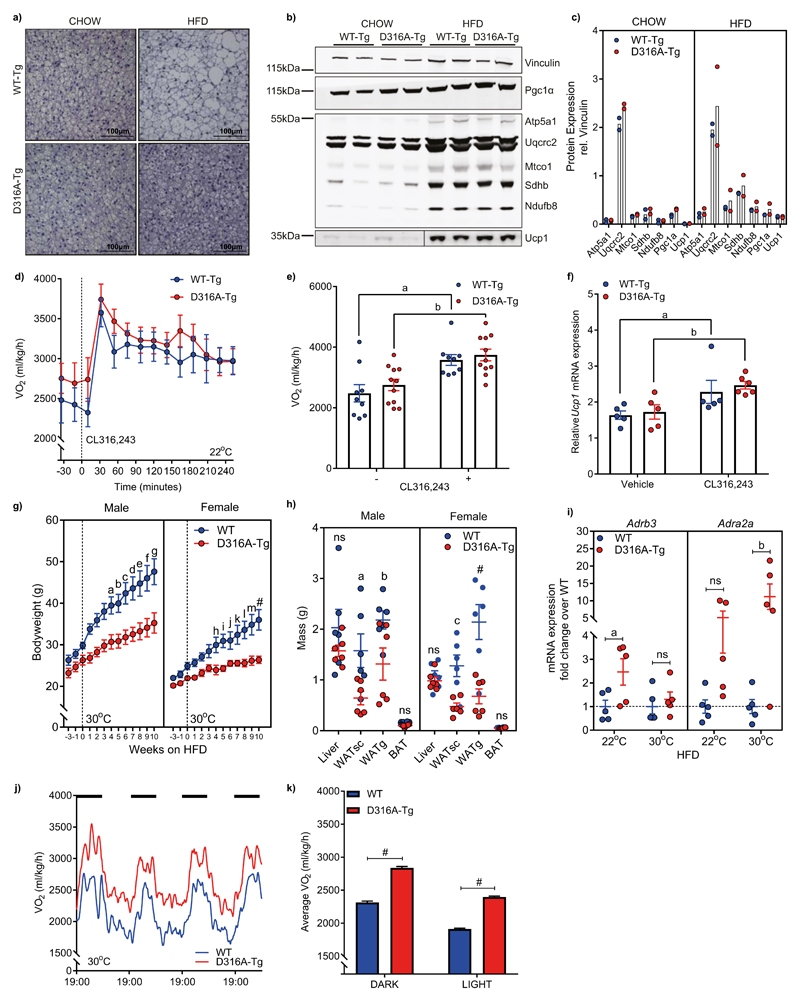
a, Representative images (from 6-7 mice per genotype from a single experimental cohort) of haematoxylin stained BAT from 16 week old mice fed chow or 12 week old mice fed for 4 weeks on a HFD (scale bar = 100 μm). b, Western blot analysis and (c) quantification, of mitochondrial electron transport chain proteins, Pgc1α and Ucp1 in BAT. In each case, samples from two mice are shown and vinculin is used as a loading control. d, e, Whole body oxygen consumption (VO2) under basal conditions and following injection with the β3-adrenoreceptor agonist, CL316,243 (n=9 for WT-Tg, and 11 for D316A-Tg; aP=0.0081, bP=0.0084). f, Ucp1 mRNA expression in BAT harvested 6 h post injection with CL316,243 (n-5 for WT-Tg and 6 for D316A-Tg mice) or vehicle control (n=5 for WT-Tg and D316A-Tg mice). aP=0.0159, bP=0.0087. g, Bodyweight of mice transferred to 30°C (represented by the dashed line) and fed a HFD for 10 weeks (n=8 for male and 6 for female WT, and 6 for male and female D316A-Tg mice). aP=0.0433, bP=0.0304, cP=0.0056, dP=0.0031, eP=0.0017, fP=0.001, gP=0.0006, hP=0.02, iP=0.0068, jP=0.0477, kP=0.0044, lP=0.0005, mP=0.0001, #P<0.0001. h, Tissue weights from mice housed at 30°C and fed a HFD for 11 weeks (n=6 mice per group). aP=0.0216, bP=0.0368, cP=0.0044, #P<0.0001. i, mRNA expression of Adrb3 and Adra2a in WATsc from mice housed at 22°C or 30°C and fed a HFD for 11 weeks (n=5 mice per group). aP=0.0297, bP=0.0063, ns=not significant. j, Whole body oxygen consumption (VO2) over an 84-hour period, and (k) average VO2 during 12 h light and 12 h dark periods (dark periods represented by the solid black bars) in mice housed at 30°C fed a HFD for 11 weeks (n=6 per genotype, #P<0.0001). Data points from individual mice were omitted in the graph to more clearly show mean values and error bar sizes. In all cases, results shown are the mean ±sem. Statistical analyses in panels e, g, h, I and k were performed by two-way ANOVA followed by Bonferroni’s multiple comparisons test. Statistical analyses in panel f was performed by Mann-Whitney test.
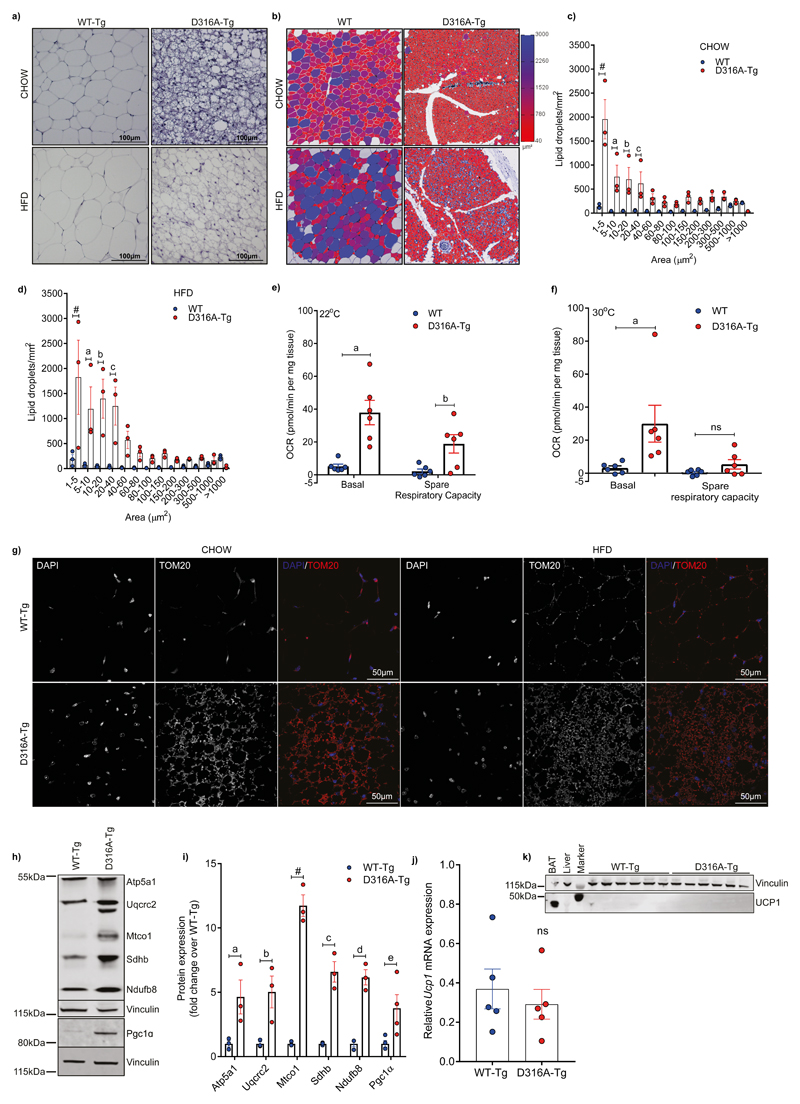
a, Representative image (from 6-7 mice per group from a single experimental cohort) of haematoxylin stained sections of WATsc from mice maintained on a chow or fed a HFD for 4 weeks (scale bar = 100 μm). b, Examples of 1 mm2 region-of-interest (ROI) selected for quantification. 3 ROIs per mouse were quantified and this was repeated for 3 mice per group. Lipid droplet size is represented using a heat-scale shown alongside. c, Quantification of lipid droplet size on chow diet. aP=0.001, bP=0.0038, cP=0.0212, #P<0.0001. d, Quantification of lipid droplet size on HFD. aP=0.004, bP=0.0003, cP=0.0015, #P<0.0001. e, Basal oxygen consumption rate (OCR) and spare respiratory capacity measured in adipose tissue explants from WT and D316A-Tg mice (n=6 per genotype) housed at 22°C and fed a HFD for 8 weeks. aP=0.0001, bP=0.0269. f, OCR and spare respiratory capacity in adipose tissue explants from mice housed at 30°C and fed a HFD for 11 weeks. aP=0.0076, ns=not significant. g, Representative images (3 images per section from 6-7 mice per group from a single experimental cohort) of immunofluorescent staining of mitochondrial outer membrane protein Tom20 (shown red in the merged images) counterstained with DAPI to stain nuclei (shown in blue in the merged images) in WATsc (scale bar = 50 μm). Similar results were obtained from two independent cohorts. h, Representative western blot analysis of mitochondrial electron transport chain proteins and Pgc1α in WATsc from mice fed a HFD and (i) quantification of protein expression (n=3-4 mice per genotype). aP=0.0137, bP=0.0055, cP=0.0001, dP=0.0003, eP=0.0397, #P<0.0001. j, mRNA expression and (k) Western blot of Ucp1 in WATsc from mice fed a HFD for 4 weeks. A sample of BAT is included as a positive control and vinculin is used as a loading control. In all cases, results shown are the mean ±sem. Statistical analyses in panels c, d, e, f, and i, were performed by two-way ANOVA followed by Bonferroni’s multiple comparisons test. Statistical analyses in panel j was performed by Student’s t-test, unpaired, 2-tailed.
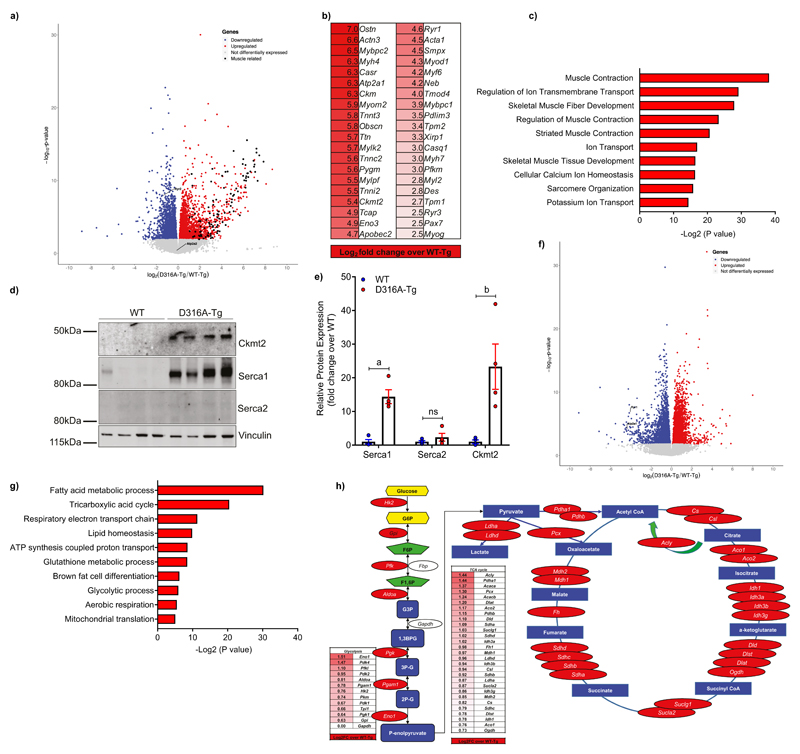
RNAseq analysis was used to determine changes in gene expression in WATsc isolated from WT-Tg and D316A-Tg mice fed a HFD for 16 weeks (n=6 mice per genotype). a, Volcano plot with down-regulated genes shown in blue, up-regulated in red, and unchanged in grey. 1353 genes were upregulated and 1102 genes downregulated (fold change >1.5). Differentially expressed genes (DEGs) were identified (P<0.05) using DESeq2 (Wald test) in R. DEGs were expressed as Log2 fold change over WT-Tg with an adjusted P value for each gene. Skeletal muscle-associated genes are shown in black. Cardiac isoforms of Serca (Atp2a2) and ryanodine receptor (Ryr2) are also highlighted. b, The 40 most highly up-regulated skeletal muscle-associated genes and (c) the most significantly enriched gene ontology (GO) annotations for the 100 most highly up-regulated genes are shown. Association P values determined by DAVID analysis (Fisher Exact P-value). d, Western blot and (e) quantification of Ckmt2, Serca1 and Serca2 in WATsc isolated from mice fed a HFD for 16 weeks (n=4 per genotype from two independent experimental cohorts). Protein expression was normalized to vinculin and expression is shown as fold change relative to WT. Significant differences from WT are shown as aP=0.0026 and bP=0.0494; ns=not significant. f, Volcano plot as in (a) from WATsc from mice fed a chow diet (n=6 mice per genotype). 1361 genes were upregulated and 1808 genes downregulated. Atp2a1 and Ryr1 are highlighted on the plot. g, The most significantly enriched gene ontology (GO) annotations for significantly up-regulated genes are shown. h, A schematic diagram showing up-regulated genes (highlighted in red) in glycolysis and the TCA cycle in D316A WATsc in mice fed a chow diet. Results shown in panel e are the mean ±sem and statistical analysis performed by multiple t-test adjusted for multiple comparisons.
References
-
- Carling D. AMPK signalling in health and disease. Curr Opin Cell Biol. 2017;45:31–37. - PubMed
-
- Steinberg GR, Kemp BE. AMPK in health and disease. Physiol Rev. 2009;89:1025–1078. - PubMed
-
- Cool B, et al. Identification and characterization of a small molecule AMPK activator that treats key components of type 2 diabetes and the metabolic syndrome. Cell Metab. 2006;3:403–416. - PubMed
Publication types
MeSH terms
Substances
Grants and funding
LinkOut - more resources
Full Text Sources
Other Literature Sources
Medical
Molecular Biology Databases
