. 2019 May 1;142(5):1215-1226.
doi: 10.1093/brain/awz063.

Electrophysiological and transcriptomic correlates of neuropathic pain in human dorsal root ganglion neurons

Affiliations

Electrophysiological and transcriptomic correlates of neuropathic pain in human dorsal root ganglion neurons

Robert Y North et al. Brain. .

Abstract

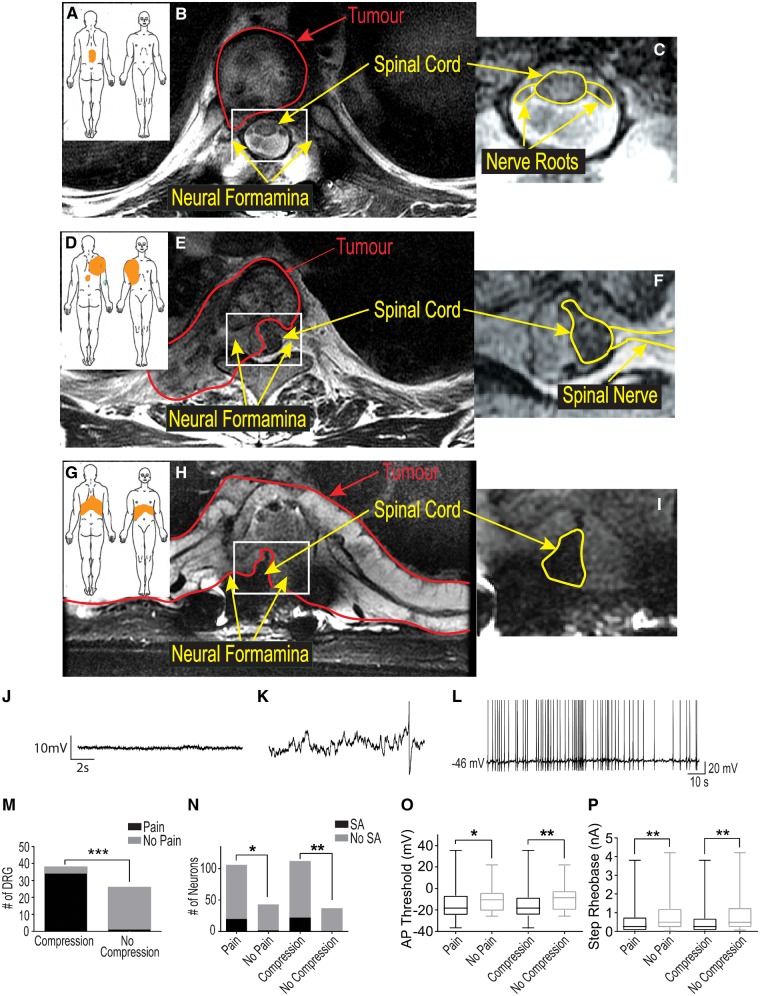
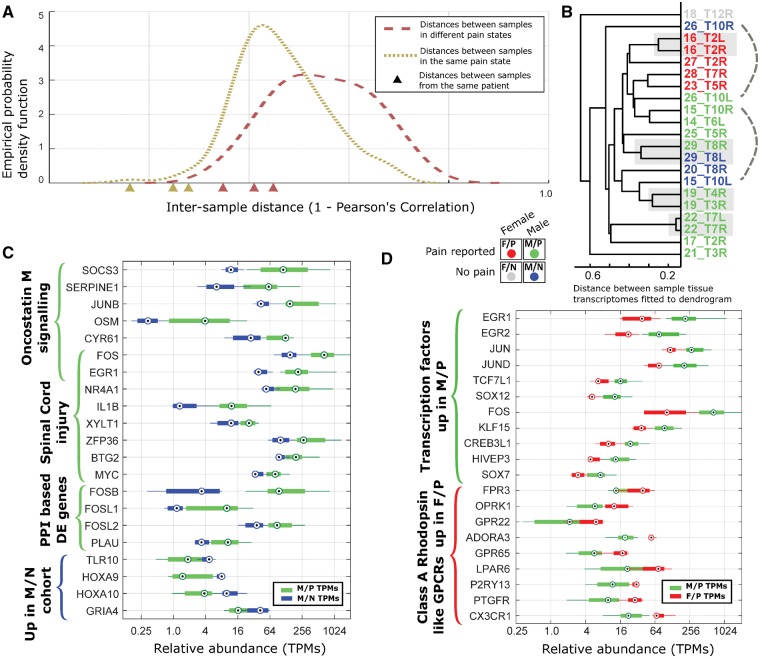
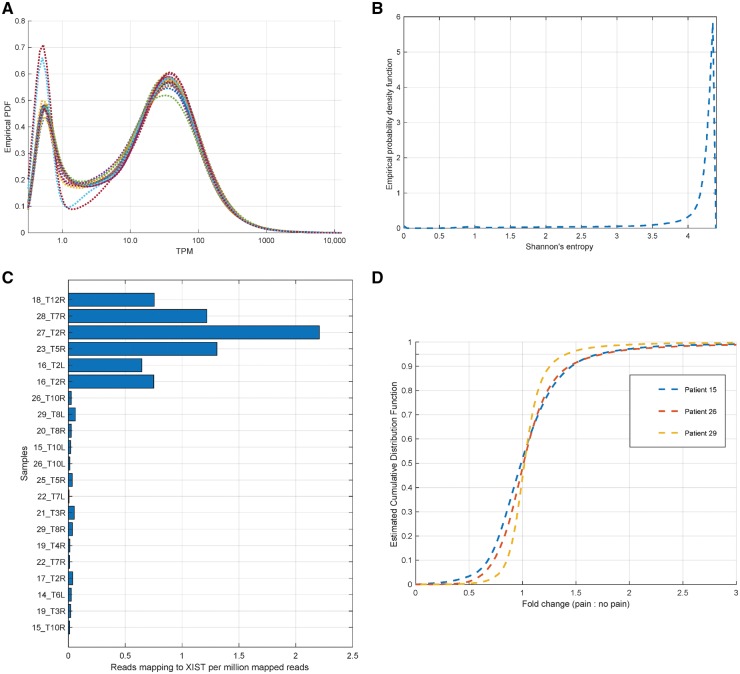
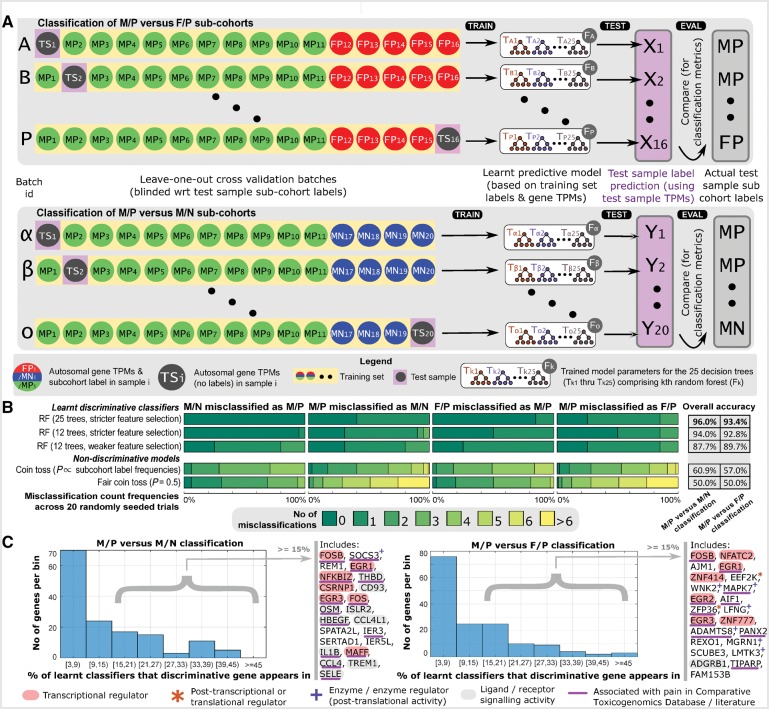
Neuropathic pain encompasses a diverse array of clinical entities affecting 7-10% of the population, which is challenging to adequately treat. Several promising therapeutics derived from molecular discoveries in animal models of neuropathic pain have failed to translate following unsuccessful clinical trials suggesting the possibility of important cellular-level and molecular differences between animals and humans. Establishing the extent of potential differences between laboratory animals and humans, through direct study of human tissues and/or cells, is likely important in facilitating translation of preclinical discoveries to meaningful treatments. Patch-clamp electrophysiology and RNA-sequencing was performed on dorsal root ganglia taken from patients with variable presence of radicular/neuropathic pain. Findings establish that spontaneous action potential generation in dorsal root ganglion neurons is associated with radicular/neuropathic pain and radiographic nerve root compression. Transcriptome analysis suggests presence of sex-specific differences and reveals gene modules and signalling pathways in immune response and neuronal plasticity related to radicular/neuropathic pain that may suggest therapeutic avenues and that has the potential to predict neuropathic pain in future cohorts.

Keywords: DRG transcriptomics; machine learning in healthcare; neuropathy; spontaneous activity.


Figures

Figure 1
Figure 1
DRG neurons from dermatomes with radicular/neuropathic pain show ectopic spontaneous activity and hyperexcitability. Pain diagrams and MRI spinal images for three categories of patients are shown in AI. The orange shaded area in A, D and G indicate where patients marked the location of their pain. This was either localized to the spine without signs of radicular/neuropathic pain (axial pain only, A); showed radiation only to one side (unilateral radicular/neuropathic pain, D); or pain that radiated to both sides of the body (bilateral radicular/neuropathic pain). The large MRI scan in B shows that patients with axial pain often only had tumours (outlined in red) that did not compress the nerve roots or spinal cord. Patients with unilateral neuropathic pain (E) typically had tumours that compressed one or more nerve roots on one side and part of the spinal cord. Patients with bilateral neuropathic pain typically had compression of one or more roots on both sides and the spinal cord (H). The area in B, E and H outlined in white are magnified in C, F, and I to show the spinal cord and nerve roots better (outlined in yellow). A representative recording of the resting membrane potential with an expanded time base for a cell without spontaneous activity is shown in J while a similar recording for a cell with spontaneous activity is shown in K to illustrate the spontaneous depolarizing fluctuations (DSFs) in membrane potential that occurred in these cells. A single action potential is shown at the right of this trace occurring atop one of the larger of these DSFs. The representative trace shown in L illustrates the irregular pattern of action potentials typically seen in cells with spontaneous activity. The bar graphs in M show that radiological evidence of nerve compression was strongly associated with signs of radicular/neuropathic pain; while in N the bar graphs show the relationship of radicular/neuropathic pain and nerve compression with spontaneous activity (SA). The box and whisker plots in O and P show that DRG neurons from a dermatome with pain and/or nerve compression had a more depolarized spike threshold potential and lower rheobase, respectively.
Figure 2
Figure 2
Differential expression analysis for human DRG transcriptomes. (A) Empirically estimated density function for pairwise transcriptome distances between samples with the same pain state and between samples with different pain states show overlap but a clear increase overall. Inter-sample distances for samples from the same patient (shown by triangles on the x-axis) are comparatively low with respect to the set of all distances. (B) Hierarchical clustering of RNA profiles for all samples, showing close distances between female pain samples. Standard hierarchical clustering was performed for all RNA-seq samples using expression patterns of high variability (entropy <3.5, see Fig. 3), expressed [transcripts per million (TPM) > 1.5 in at least one sample] genes with distance metric = 1 − Pearsons’ correlation coefficient, and average linkage. Four cohorts [male-pain (M/P), male-no pain (M/N), female-pain (F/P), and female-no pain (F/N)] are colour-coded. (C and D) Several representative differentially-expressed gene sets for the male-pain versus male-no pain (C) and for the male-pain versus female-pain (D) comparison.
Figure 3
Figure 3
In silico controls for RNA-sequencing analysis. (A) The estimated probability density function for transcripts per million (TPMs) (smoothed by adding 0.5 to each value) show that all samples have approximately similar distributions over coding gene TPMs, along with a consistent number of genes expressed at 1.5 TPM or higher in each sample (between 13 850 and 14 715). (B) Genes with high variability in TPM across our datasets were identified in a fashion agnostic to clinical information by calculating Shannon’s entropy for each gene’s TPMs across RNA-seq samples, identifying genes with high variability (based on low entropy values in the left tail of the estimated distribution, value <3.5). Higher values correspond to more generic expression patterns. (C) Some well-known marker genes were checked in RNA-seq samples. The reported sex for each sample was independently verified using reads mapping to the XIST non-coding gene. (D) Estimated density function for the gene expression (for genes with transcripts per million >3.0 in either sample) fold change between pain and non-pain samples derived from the same patient, showing that a 2-fold change corresponds to the top 5th percentile.
Figure 4
Figure 4
Sample cohort prediction using Random Forests. (A) Leave one out cross validation schema is shown, with one sample (test sample) held out from training in each batch. The RNA profile of the test sample is then used by the trained classifier to predict its cohort membership, and the predicted cohort label is compared to actual cohort membership to evaluate the quality of classification. (B) Classification metrics for our optimal Random Forest model, using 25 decision trees, with no more than five decisions per tree, and using an input set of discriminative candidate genes is shown on top. Metrics from random forests built using 12 trees; as well as from random forests using 12 trees and a larger input set of candidate genes are also shown. Our classifier achieves discriminative results across a range of training parameters. We also show expected classification metrics for classifiers with no discriminative ability: based on models of biased and unbiased coin tosses. (C) A small set of genes are chosen for many of the random forests that we trained, suggesting a high predictive ability of these genes. Histograms show the number of genes that are chosen most frequently (in 3% to 45% of trained random forests) for both male-pain (M/P) versus female-pain (F/P) and male-pain versus male-no pain (M/N) classification. Genes chosen in >15% of the random forests include transcriptional/post transcriptional regulators, enzymes, and signalling molecules, many of which are associated with pain.

References

    1. Andratsch M, Mair N, Constantin CE, Scherbakov N, Benetti C, Quarta S et al. . A key role for gp130 expressed on peripheral sensory nerves in pathological pain. J Neurosci 2009; 29: 13473–83. - PMC - PubMed
    1. Bannwarth B, Kostine M. Targeting nerve growth factor (NGF) for pain management: what does the future hold for NGF antagonists? Drugs 2014; 74: 619–26. - PubMed
    1. Baumann TK, Burchiel KJ, Ingram SL, Martenson ME. Responses of adult human dorsal root ganglion neurons in culture to capsaicin and low ph. Pain 1996; 65: 31–8. - PubMed
    1. Bilsky MH, Laufer I, Fourney DR, Groff M, Schmidt MH, Varga PP et al. . Reliability analysis of the epidural spinal cord compression scale. J Neurosurg Spine 2010; 13: 324–8. - PubMed
    1. Borsook D, Hargreaves R, Bountra C, Porreca F. Lost but making progress–Where will new analgesic drugs come from? Sci Transl Med 2014; 6: 249sr3. - PMC - PubMed

Publication types