

Vitronectin deficiency attenuates hepatic fibrosis in a non-alcoholic steatohepatitis-induced mouse model
- PMID: 30887659
- PMCID: PMC6540715
- DOI: 10.1111/iep.12306
Vitronectin deficiency attenuates hepatic fibrosis in a non-alcoholic steatohepatitis-induced mouse model
Abstract
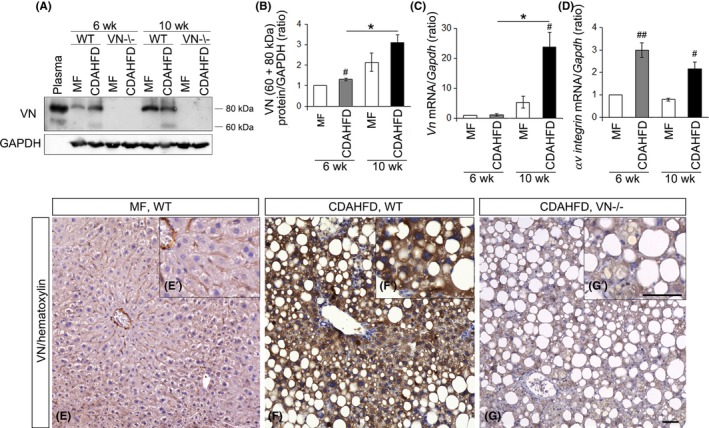
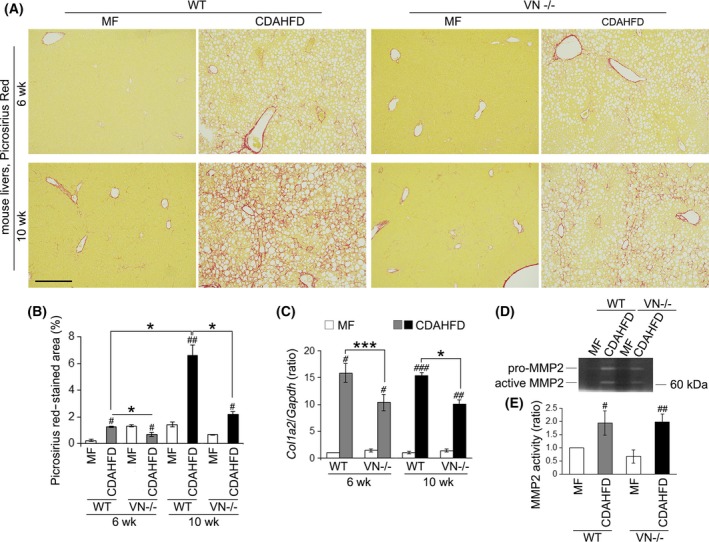
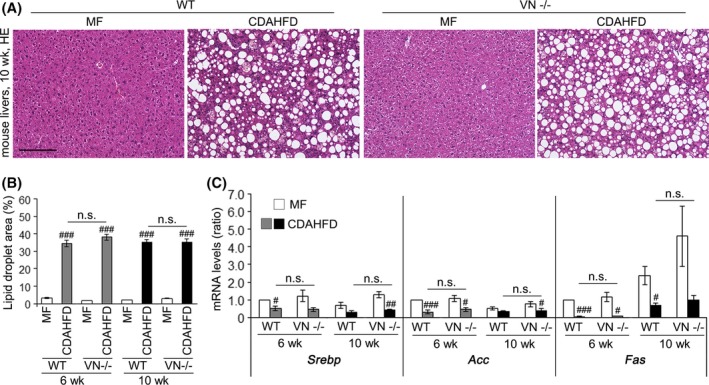
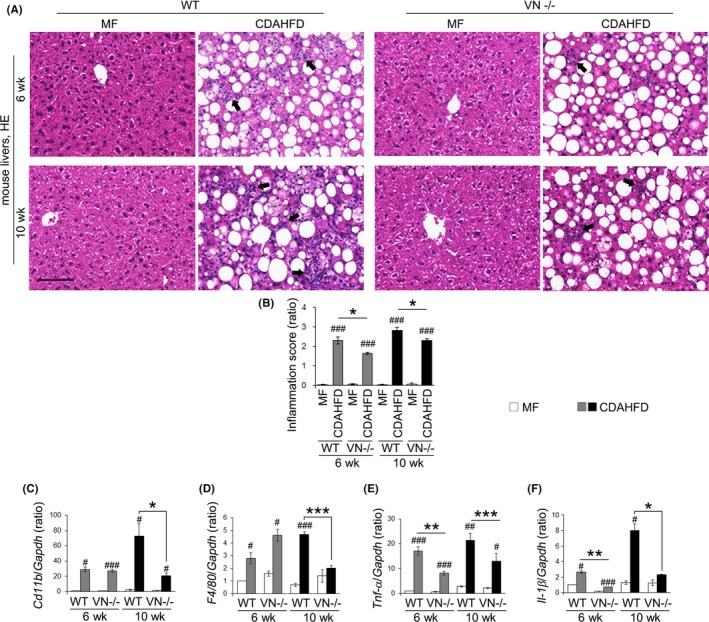
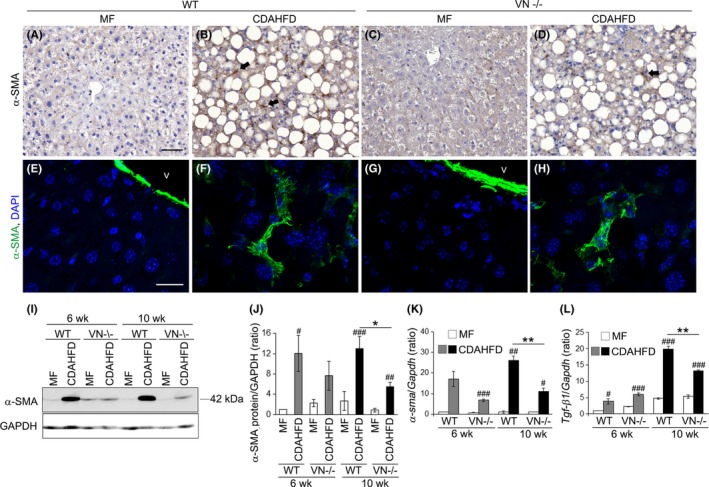
Vitronectin (VN), an extracellular matrix protein, is a promising immune biomarker of non-alcoholic steatohepatitis (NASH); however, its precise function remains unclear. This study investigated how VN deficiency contributes to the development of NASH. Towards this aim, wild-type (WT) and VN-/- mice were fed with a choline-deficient, L-amino acid-defined, high-fat diet (CDAHFD) for 6 and 10 weeks to induce NASH, and the livers were isolated. In WT mice fed with CDAHFD for 6 and 10 weeks, the expression of Vn mRNA and protein was up-regulated compared with that in mice fed with the MF control diet, indicating that VN is regulated in NASH condition. VN-/- mice showed decreased picrosirius red staining in the liver area and Col1a2 mRNA expression levels, compared with WT mice, indicating that the severity of hepatic fibrosis is attenuated in the CDAHFD-fed VN-/- mice. In addition, VN deficiency did not affect the area of lipid droplets in haematoxylin-eosin staining and the mRNA expression levels of fatty acid synthases, Srebp, Acc and Fas in the CDAHFD-fed mice. Moreover, VN deficiency decreased the inflammation score and the mRNA expression levels of Cd11b and F4/80, macrophage markers, as well as Tnf-α and Il-1β, inflammatory cytokines in the CDAHFD-fed mice. Furthermore, VN deficiency decreased the protein and mRNA expression levels of α-smooth muscle actin in the CDAHFD-fed mice, suggesting that VN deficiency inhibits the activation of hepatic stellate cells (HSCs). Our findings indicate that VN contributes to the development of fibrosis in the NASH model mice via modulation of the inflammatory reaction and activation of HSCs.
Keywords: hepatic fibrosis; hepatic stellate cell; inflammation; non-alcoholic steatohepatitis; vitronectin.
© 2019 The Authors. International Journal of Experimental Pathology © 2019 International Journal of Experimental Pathology.
Conflict of interest statement
The authors declare no conflict of interest.
Figures
Similar articles
-
Imaging Fibrogenesis in a Diet-Induced Model of Nonalcoholic Steatohepatitis (NASH).Contrast Media Mol Imaging. 2019 Dec 1;2019:6298128. doi: 10.1155/2019/6298128. eCollection 2019. Contrast Media Mol Imaging. 2019. PMID: 31866798 Free PMC article.
-
Thrombospondin-I is a critical modulator in non-alcoholic steatohepatitis (NASH).PLoS One. 2019 Dec 31;14(12):e0226854. doi: 10.1371/journal.pone.0226854. eCollection 2019. PLoS One. 2019. PMID: 31891606 Free PMC article.
-
Fucoxanthin inhibits hepatic oxidative stress, inflammation, and fibrosis in diet-induced nonalcoholic steatohepatitis model mice.Biochem Biophys Res Commun. 2020 Jul 23;528(2):305-310. doi: 10.1016/j.bbrc.2020.05.050. Epub 2020 May 29. Biochem Biophys Res Commun. 2020. PMID: 32475638
-
Galectin-3 and IL-33/ST2 axis roles and interplay in diet-induced steatohepatitis.World J Gastroenterol. 2016 Nov 28;22(44):9706-9717. doi: 10.3748/wjg.v22.i44.9706. World J Gastroenterol. 2016. PMID: 27956794 Free PMC article. Review.
-
Role of G Protein-Coupled Receptors in Hepatic Stellate Cells and Approaches to Anti-Fibrotic Treatment of Non-Alcoholic Fatty Liver Disease.Front Endocrinol (Lausanne). 2021 Dec 6;12:773432. doi: 10.3389/fendo.2021.773432. eCollection 2021. Front Endocrinol (Lausanne). 2021. PMID: 34938271 Free PMC article. Review.
Cited by
-
Chemotherapy treatment induces pro-invasive changes in liver ECM composition.Matrix Biol. 2022 Sep;112:20-38. doi: 10.1016/j.matbio.2022.08.002. Epub 2022 Aug 5. Matrix Biol. 2022. PMID: 35940338 Free PMC article.
-
Urine Biomarkers in the Management of Adult Neurogenic Lower Urinary Tract Dysfunction: A Systematic Review.Diagnostics (Basel). 2023 Jan 27;13(3):468. doi: 10.3390/diagnostics13030468. Diagnostics (Basel). 2023. PMID: 36766573 Free PMC article. Review.
-
Urinary exosomal vitronectin predicts vesicoureteral reflux in patients with neurogenic bladders and spinal cord injuries.Exp Ther Med. 2022 Jan;23(1):65. doi: 10.3892/etm.2021.10988. Epub 2021 Nov 23. Exp Ther Med. 2022. PMID: 34934436 Free PMC article.
-
Macrophage promotes fibroblast activation and kidney fibrosis by assembling a vitronectin-enriched microenvironment.Theranostics. 2023 Jul 3;13(11):3897-3913. doi: 10.7150/thno.85250. eCollection 2023. Theranostics. 2023. PMID: 37441594 Free PMC article.
-
Proteomics of Urinary Extracellular Vesicles Highlight the Involvement of Vitronectin and the Fibrinolytic and TNF Pathways as Mechanisms Underlying Renal Fibrosis in Kidney Transplant Patients.J Extracell Biol. 2025 Jun 2;4(6):e70056. doi: 10.1002/jex2.70056. eCollection 2025 Jun. J Extracell Biol. 2025. PMID: 40458674 Free PMC article.
References
-
- Montaldo C, Mattei S, Baiocchini A, et al. Spike‐in SILAC proteomic approach reveals the vitronectin as an early molecular signature of liver fibrosis in hepatitis C infections with hepatic iron overload. Proteomics. 2014;14:1107‐1115. - PubMed
-
- Koukoulis GK, Shen J, Virtanen I, Gould VE. Vitronectin in the cirrhotic liver: an immunomarker of mature fibrosis. Hum Pathol. 2001;32:1356‐1362. - PubMed
-
- Brunt EM. Nonalcoholic steatohepatitis: definition and pathology. Semin Liver Dis. 2001;21:3‐16. - PubMed
Publication types
MeSH terms
Substances
LinkOut - more resources
Full Text Sources
Medical
Research Materials
Miscellaneous
