

Prediction of Pulmonary Function in Patients with Chronic Obstructive Pulmonary Disease: Correlation with Quantitative CT Parameters
- PMID: 30887750
- PMCID: PMC6424824
- DOI: 10.3348/kjr.2018.0391
Prediction of Pulmonary Function in Patients with Chronic Obstructive Pulmonary Disease: Correlation with Quantitative CT Parameters
Abstract
Objective: We aimed to evaluate correlations between computed tomography (CT) parameters and pulmonary function test (PFT) parameters according to disease severity in patients with chronic obstructive pulmonary disease (COPD), and to determine whether CT parameters can be used to predict PFT indices.
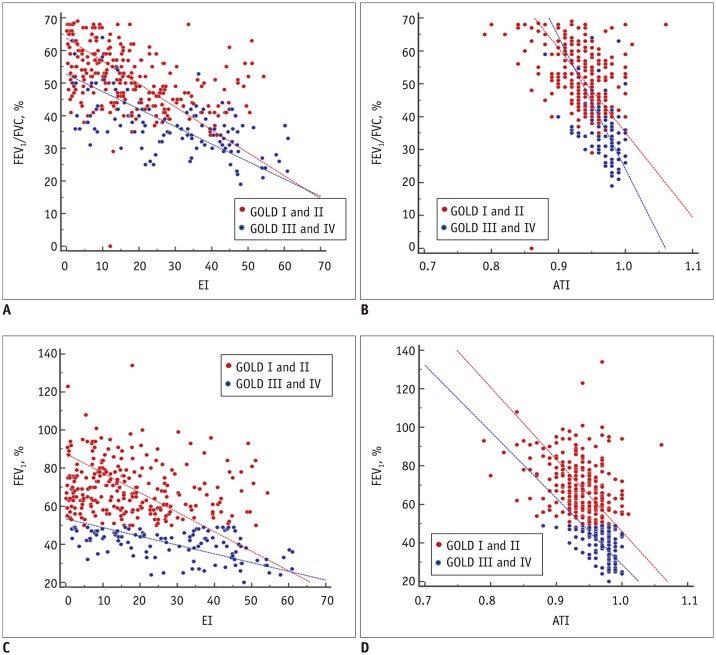
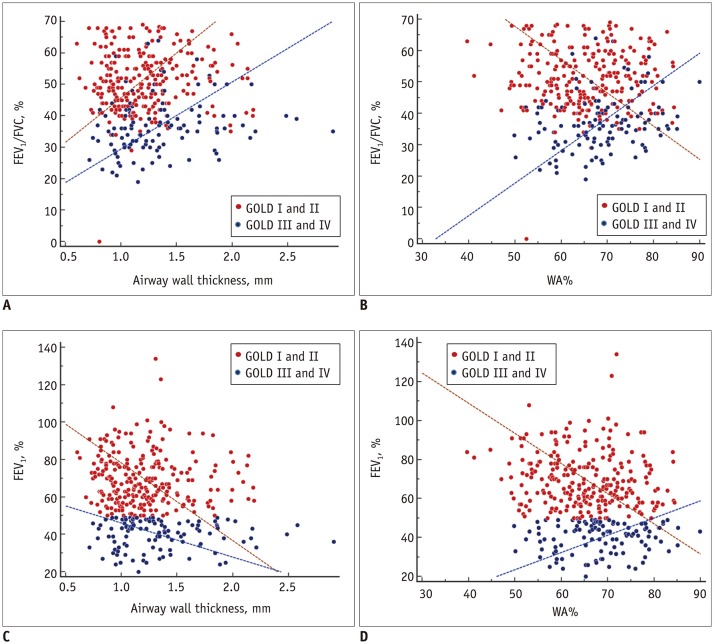
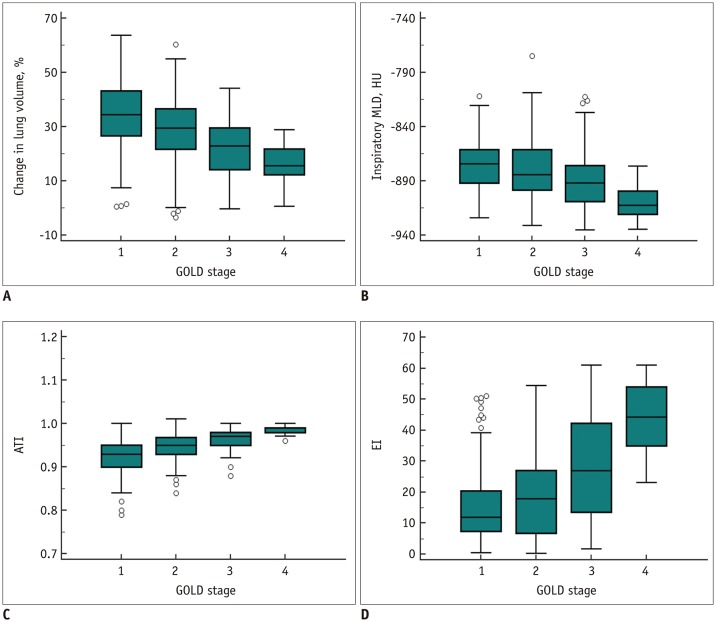
Materials and methods: A total of 370 patients with COPD were grouped based on disease severity according to the Global Initiative for Chronic Obstructive Lung Disease (GOLD) I-IV criteria. Emphysema index (EI), air-trapping index, and airway parameters such as the square root of wall area of a hypothetical airway with an internal perimeter of 10 mm (Pi10) were measured using automatic segmentation software. Clinical characteristics including PFT results and quantitative CT parameters according to GOLD criteria were compared using ANOVA. The correlations between CT parameters and PFT indices, including the ratio of forced expiratory volume in one second to forced vital capacity (FEV₁/FVC) and FEV₁, were assessed. To evaluate whether CT parameters can be used to predict PFT indices, multiple linear regression analyses were performed for all patients, Group 1 (GOLD I and II), and Group 2 (GOLD III and IV).
Results: Pulmonary function deteriorated with increase in disease severity according to the GOLD criteria (p < 0.001). Parenchymal attenuation parameters were significantly worse in patients with higher GOLD stages (p < 0.001), and Pi10 was highest for patients with GOLD III (4.41 ± 0.94 mm). Airway parameters were nonlinearly correlated with PFT results, and Pi10 demonstrated mild correlation with FEV₁/FVC in patients with GOLD II and III (r = 0.16, p = 0.06 and r = 0.21, p = 0.04, respectively). Parenchymal attenuation parameters, airway parameters, EI, and Pi10 were identified as predictors of FEV₁/FVC for the entire study sample and for Group 1 (R² = 0.38 and 0.22, respectively; p < 0.001). However, only parenchymal attenuation parameter, EI, was identified as a predictor of FEV₁/FVC for Group 2 (R² = 0.37, p < 0.001). Similar results were obtained for FEV₁.
Conclusion: Airway and parenchymal attenuation parameters are independent predictors of pulmonary function in patients with mild COPD, whereas parenchymal attenuation parameters are dominant independent predictors of pulmonary function in patients with severe COPD.
Keywords: Chronic obstructive pulmonary disease; Computed tomography; Emphysema; Pulmonary function test; Quantitative.
Copyright © 2019 The Korean Society of Radiology.
Conflict of interest statement
The authors have no potential conflicts of interest to disclose.
Figures
References
-
- Vogelmeier CF, Criner GJ, Martinez FJ, Anzueto A, Barnes PJ, Bourbeau J, et al. Global strategy for the diagnosis, management, and prevention of chronic obstructive lung disease 2017 report. GOLD executive summary. Am J Respir Crit Care Med. 2017;195:557–582. - PubMed
-
- Topalovic M, Laval S, Aerts JM, Troosters T, Decramer M, Janssens W. Automated interpretation of pulmonary function tests in adults with respiratory complaints. Respiration. 2017;93:170–178. - PubMed
-
- Al-Ashkar F, Mehra R, Mazzone PJ. Interpreting pulmonary function tests: recognize the pattern, and the diagnosis will follow. Cleve Clin J Med. 2003;70:866, 868, 871–873. passim. - PubMed
-
- Schroeder JD, McKenzie AS, Zach JA, Wilson CG, Curran-Everett D, Stinson DS, et al. Relationships between airflow obstruction and quantitative CT measurements of emphysema, air trapping, and airways in subjects with and without chronic obstructive pulmonary disease. AJR Am J Roentgenol. 2013;201:W460–W470. - PMC - PubMed
