

An Unbiased Lipid Phenotyping Approach To Study the Genetic Determinants of Lipids and Their Association with Coronary Heart Disease Risk Factors
- PMID: 30887811
- PMCID: PMC6558644
- DOI: 10.1021/acs.jproteome.8b00786
An Unbiased Lipid Phenotyping Approach To Study the Genetic Determinants of Lipids and Their Association with Coronary Heart Disease Risk Factors
Abstract
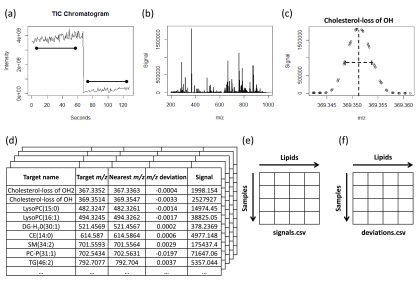
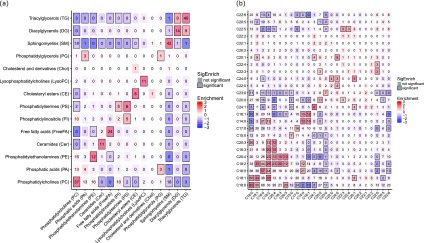
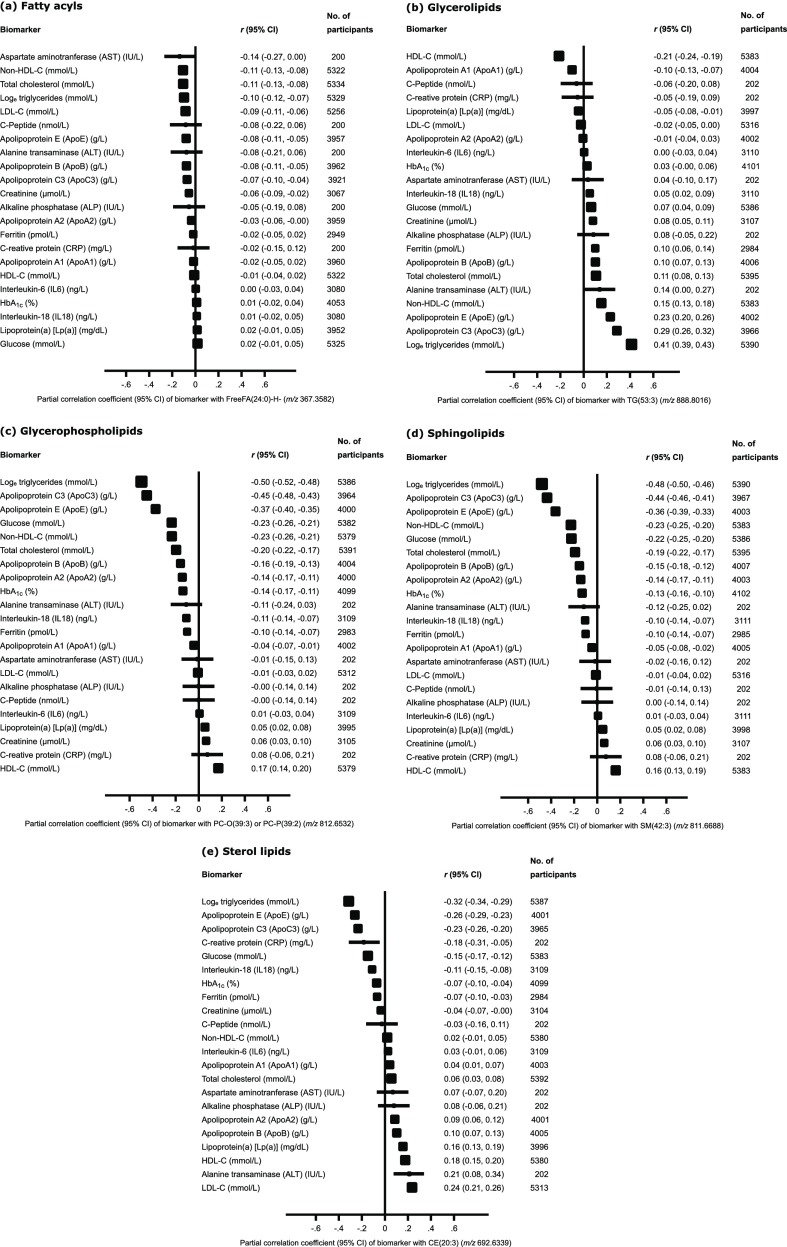
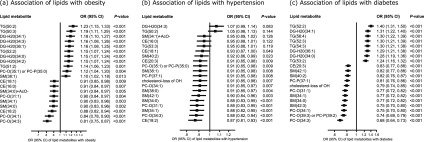
Direct infusion high-resolution mass spectrometry (DIHRMS) is a novel, high-throughput approach to rapidly and accurately profile hundreds of lipids in human serum without prior chromatography, facilitating in-depth lipid phenotyping for large epidemiological studies to reveal the detailed associations of individual lipids with coronary heart disease (CHD) risk factors. Intact lipid profiling by DIHRMS was performed on 5662 serum samples from healthy participants in the Pakistan Risk of Myocardial Infarction Study (PROMIS). We developed a novel semi-targeted peak-picking algorithm to detect mass-to-charge ratios in positive and negative ionization modes. We analyzed lipid partial correlations, assessed the association of lipid principal components with established CHD risk factors and genetic variants, and examined differences between lipids for a common genetic polymorphism. The DIHRMS method provided information on 360 lipids (including fatty acyls, glycerolipids, glycerophospholipids, sphingolipids, and sterol lipids), with a median coefficient of variation of 11.6% (range: 5.4-51.9). The lipids were highly correlated and exhibited a range of associations with clinical chemistry biomarkers and lifestyle factors. This platform can provide many novel insights into the effects of physiology and lifestyle on lipid metabolism, genetic determinants of lipids, and the relationship between individual lipids and CHD risk factors.
Keywords: coronary heart disease; genetics; lipidomics; mass spectrometry; protocol.
Conflict of interest statement
The authors declare the following competing financial interest(s): EBF and DZ are employees and shareholders of Pfizer, Inc. JD has received research funding from the British Heart Foundation, the National Institute for Health Research Cambridge Comprehensive Biomedical Research Centre, the Bupa Foundation, diaDexus, the European Research Council, the European Union, the Evelyn Trust, the Fogarty International Centre, GlaxoSmithKline, Merck, the National Heart, Lung, and Blood Institute, the National Institute for Health Research, the National Institute of Neurological Disorders and Stroke, NHS Blood and Transplant, Novartis, Pfizer, the UK Medical Research Council, and the Wellcome Trust. DSa has received funding from Pfizer, Regeneron Pharmaceuticals, Genentech, and Eli Lilly. JLG has received funding from Agilent, WatersGlaxoSmithKline, Medimmune, Unilever, AstraZeneca, the Medical Research Council, the Biotechnology and Biological Sciences Research Council, the National Institute of Health, the British Heart Foundation, and the Wellcome Trust. All other authors declare no competing interests.
Figures
Similar articles
-
Identification of the lipid biomarkers from plasma in idiopathic pulmonary fibrosis by Lipidomics.BMC Pulm Med. 2017 Dec 6;17(1):174. doi: 10.1186/s12890-017-0513-4. BMC Pulm Med. 2017. PMID: 29212488 Free PMC article.
-
The plasma lipidome of the Quaker parrot (Myiopsitta monachus).PLoS One. 2020 Dec 1;15(12):e0240449. doi: 10.1371/journal.pone.0240449. eCollection 2020. PLoS One. 2020. PMID: 33259543 Free PMC article.
-
Screening of lipid metabolism biomarkers in patients with coronary heart disease via ultra-performance liquid chromatography-high resolution mass spectrometry.J Chromatogr B Analyt Technol Biomed Life Sci. 2021 Apr 15;1169:122603. doi: 10.1016/j.jchromb.2021.122603. Epub 2021 Feb 23. J Chromatogr B Analyt Technol Biomed Life Sci. 2021. PMID: 33690078
-
Lipid profiling of brain tissue and blood after traumatic brain injury: A review of human and experimental studies.Semin Cell Dev Biol. 2021 Apr;112:145-156. doi: 10.1016/j.semcdb.2020.08.004. Epub 2020 Oct 7. Semin Cell Dev Biol. 2021. PMID: 33036880 Review.
-
Mendelian randomization to assess causal effects of blood lipids on coronary heart disease: lessons from the past and applications to the future.Curr Opin Endocrinol Diabetes Obes. 2016 Apr;23(2):124-30. doi: 10.1097/MED.0000000000000230. Curr Opin Endocrinol Diabetes Obes. 2016. PMID: 26910273 Free PMC article. Review.
Cited by
-
A high-throughput platform for detailed lipidomic analysis of a range of mouse and human tissues.Anal Bioanal Chem. 2020 May;412(12):2851-2862. doi: 10.1007/s00216-020-02511-0. Epub 2020 Mar 7. Anal Bioanal Chem. 2020. PMID: 32144454 Free PMC article.
-
Towards Precision Medicine in Gestational Diabetes: Pathophysiology and Glycemic Patterns in Pregnant Women With Obesity.J Clin Endocrinol Metab. 2023 Sep 18;108(10):2643-2652. doi: 10.1210/clinem/dgad168. J Clin Endocrinol Metab. 2023. PMID: 36950879 Free PMC article.
-
The biosynthesis of phospholipids is linked to the cell cycle in a model eukaryote.Biochim Biophys Acta Mol Cell Biol Lipids. 2021 Aug;1866(8):158965. doi: 10.1016/j.bbalip.2021.158965. Epub 2021 May 14. Biochim Biophys Acta Mol Cell Biol Lipids. 2021. PMID: 33992808 Free PMC article.
-
Microencapsulated algal feeds as a sustainable replacement diet for broodstock in commercial bivalve aquaculture.Sci Rep. 2020 Jul 31;10(1):12577. doi: 10.1038/s41598-020-69645-0. Sci Rep. 2020. PMID: 32737351 Free PMC article.
-
Fermentation of Milk into Yoghurt and Cheese Leads to Contrasting Lipid and Glyceride Profiles.Nutrients. 2019 Sep 11;11(9):2178. doi: 10.3390/nu11092178. Nutrients. 2019. PMID: 31514309 Free PMC article.
References
-
- Stegemann C.; Pechlaner R.; Willeit P.; Langley S. R.; Mangino M.; Mayr U.; Menni C.; Moayyeri A.; Santer P.; Rungger G.; et al. Lipidomics profiling and risk of cardiovascular disease in the prospective population-based Bruneck study. Circulation 2014, 129 (18), 1821–1831. 10.1161/CIRCULATIONAHA.113.002500. - DOI - PubMed
Publication types
MeSH terms
Substances
Grants and funding
- G0800270/MRC_/Medical Research Council/United Kingdom
- RG/18/13/33946/BHF_/British Heart Foundation/United Kingdom
- RG/13/13/30194/BHF_/British Heart Foundation/United Kingdom
- MC_EX_G0800783/MRC_/Medical Research Council/United Kingdom
- MC_UU_00014/5/MRC_/Medical Research Council/United Kingdom
- MC_UU_12012/5/MRC_/Medical Research Council/United Kingdom
- SP/09/002/ERC_/European Research Council/International
- 105602/Z/14/Z/WT_/Wellcome Trust/United Kingdom
- WT_/Wellcome Trust/United Kingdom
- MR/P01836X/1/MRC_/Medical Research Council/United Kingdom
- MR/P011705/1/MRC_/Medical Research Council/United Kingdom
- MC_UP_A090_1006/MRC_/Medical Research Council/United Kingdom
- MC_PC_13030/MRC_/Medical Research Council/United Kingdom
LinkOut - more resources
Full Text Sources
