

Differences in Particle Deposition Between Members of Imaging-Based Asthma Clusters
- PMID: 30888242
- PMCID: PMC6685197
- DOI: 10.1089/jamp.2018.1487
Differences in Particle Deposition Between Members of Imaging-Based Asthma Clusters
Abstract
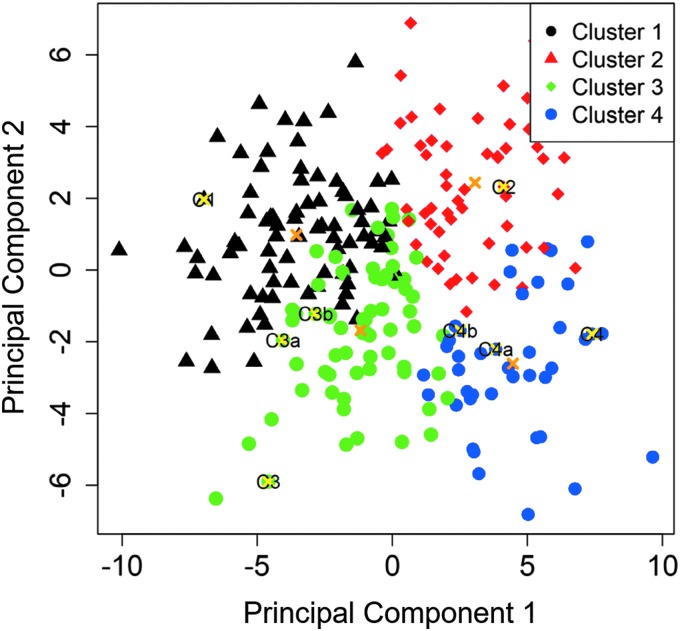
Background: Four computed tomography (CT) imaging-based clusters have been identified in a study of the Severe Asthma Research Program (SARP) cohort and have been significantly correlated with clinical and demographic metrics (J Allergy Clin Immunol 2017; 140:690-700.e8). We used a computational fluid dynamics (CFD) model to investigate air flow and aerosol deposition within imaging archetypes representative of the four clusters. Methods: CFD simulations for air flow and 1-8 μm particle transport were performed using CT-based airway models from two healthy subjects and eight asthma subjects. The subject selection criterion was based on the discriminant imaging-based flow-related variables of J(Total) (average local volume expansion in the total lung) and Dh*(sLLL) (normalized airway hydraulic diameter in the left lower lobe), where reduced J(Total) and Dh*(sLLL) indicate reduced regional ventilation and airway constriction, respectively. The analysis focused on the comparisons between all clusters with respect to healthy subjects, between cluster 2 and cluster 4 (nonsevere and severe asthma clusters with airway constriction) and between cluster 3 and cluster 4 (two severe asthma clusters characterized by normal and constricted airways, respectively). Results: Nonsevere asthma cluster 2 and severe asthma cluster 4 subjects characterized by airway constriction had an increase in the deposition fraction (DF) in the left lower lobe. Constricted flows impinged on distal bifurcations resulting in large depositions. Although both cluster 3 (without constriction) and cluster 4 (with constriction) were severe asthma, they exhibited different particle deposition patterns with increasing particle size. The statistical analysis showed that Dh*(sLLL) plays a more important role in particle deposition than J(Total), and regional flow fraction is correlated with DF among lobes for smaller particles. Conclusions: We demonstrated particle deposition characteristics associated with cluster-specific imaging-based metrics such as airway constriction, which could pertain to the design of future drug delivery improvements.
Keywords: airway constriction; cluster analysis; computational fluid dynamics; inhaled corticosteroid; particle deposition; quantitative computed tomography.
Conflict of interest statement
E.A.H. is a shareholder in VIDA diagnostics, a company that is commercializing lung image analysis software derived by the University of Iowa lung imaging group. He is also a member of the Siemens CT advisory board.
Figures
References
-
- Byron PR: Drug delivery devices: Issues in drug development. Proc Am Thorac Soc. 2004;1:321–328 - PubMed
-
- Delvadia RR, Longest PW, and Byron PR: In vitro tests for aerosol deposition. I: Scaling a physical model of the upper airways to predict drug deposition variation in normal humans. J Aerosol Med Pulm Drug Deliv. 2012;25:32–40 - PubMed
-
- Choi S, Hoffman EA, Wenzel SE, Castro M, Fain S, Jarjour N, Schiebler ML, Chen K, Lin C-L, National Heart Lung, and Blood Institute's Severe Asthma Research Program: Quantitative computed tomographic imaging-based clustering differentiates asthmatic subgroups with distinctive clinical phenotypes. J Allergy Clin Immunol. 2017;140:690–700.e698 - PMC - PubMed
Publication types
MeSH terms
Substances
Grants and funding
LinkOut - more resources
Full Text Sources
Other Literature Sources
Medical
Miscellaneous
