. 2019 May 1;199(9):1116-1126.
doi: 10.1164/rccm.201901-0145OC.

Correlating Cystic Fibrosis Transmembrane Conductance Regulator Function with Clinical Features to Inform Precision Treatment of Cystic Fibrosis

Affiliations

Correlating Cystic Fibrosis Transmembrane Conductance Regulator Function with Clinical Features to Inform Precision Treatment of Cystic Fibrosis

Allison F McCague et al. Am J Respir Crit Care Med. .

Abstract

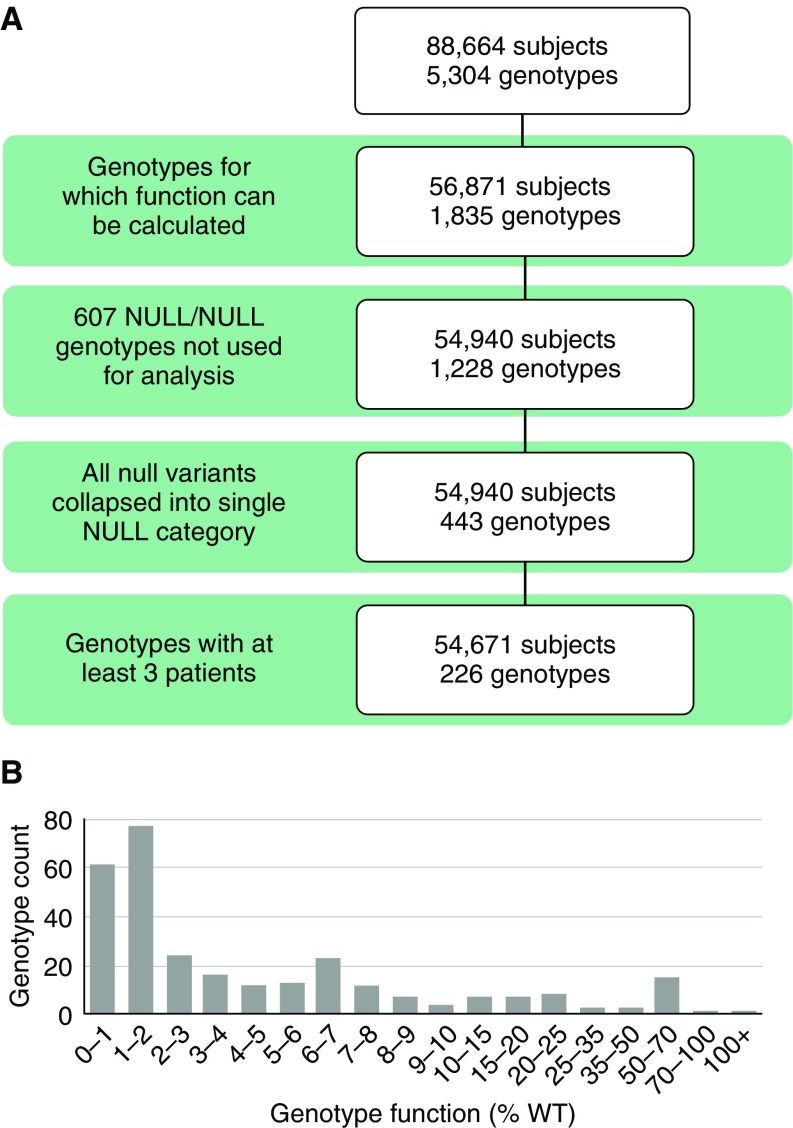
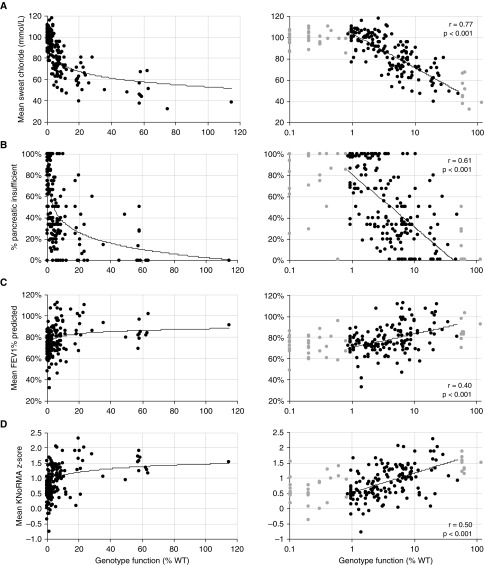
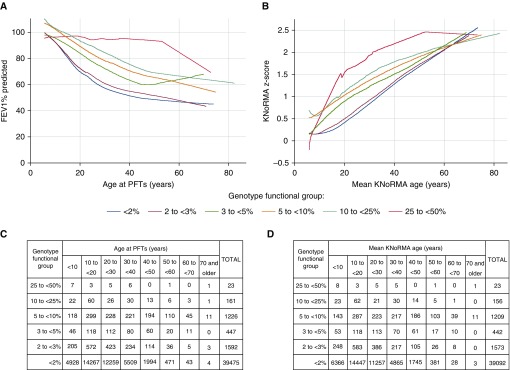
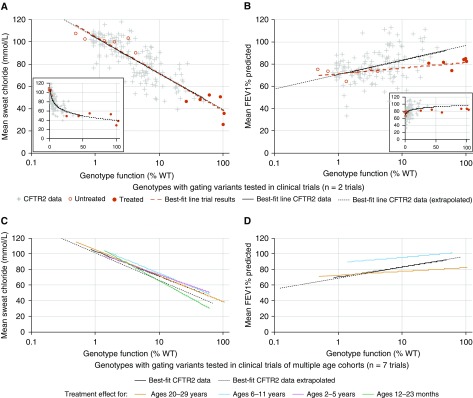
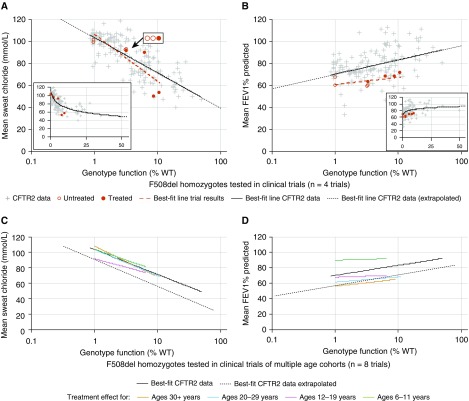
Rationale: The advent of precision treatment for cystic fibrosis using small-molecule therapeutics has created a need to estimate potential clinical improvements attributable to increases in cystic fibrosis transmembrane conductance regulator (CFTR) function. Objectives: To derive CFTR function of a variety of CFTR genotypes and correlate with key clinical features (sweat chloride concentration, pancreatic exocrine status, and lung function) to develop benchmarks for assessing response to CFTR modulators. Methods: CFTR function assigned to 226 unique CFTR genotypes was correlated with the clinical data of 54,671 individuals enrolled in the Clinical and Functional Translation of CFTR (CFTR2) project. Cross-sectional FEV1% predicted measurements were plotted by age at which measurement was obtained. Shifts in sweat chloride concentration and lung function reported in CFTR modulator trials were compared with function-phenotype correlations to assess potential efficacy of therapies. Measurements and Main Results: CFTR genotype function exhibited a logarithmic relationship with each clinical feature. Modest increases in CFTR function related to differing genotypes were associated with clinically relevant improvements in cross-sectional FEV1% predicted over a range of ages (6-82 yr). Therapeutic responses to modulators corresponded closely to predictions from the CFTR2-derived relationship between CFTR genotype function and phenotype. Conclusions: Increasing CFTR function in individuals with severe disease will have a proportionally greater effect on outcomes than similar increases in CFTR function in individuals with mild disease and should reverse a substantial fraction of the disease process. This study provides reference standards for clinical outcomes that may be achieved by increasing CFTR function.

Keywords: cystic fibrosis transmembrane conductance regulator modulator; genotype–phenotype; lung function; sweat chloride.


Figures

Figure 1.
Figure 1.
Subjects, genotypes, and cystic fibrosis transmembrane conductance regulator (CFTR) function of individuals included in function–phenotype analysis. (A) Diagram of the filtering process used to select individuals for the study. The 5,304 genotypes of 88,664 subjects from the Clinical and Functional Translation of CFTR (CFTR2) project dataset were provided by contributing registries and cystic fibrosis clinics. Genotypes including only one null variant were collapsed such that any null variant could be present in trans with a nonnull variant of interest and only genotype groups with at least three individuals were included in the analysis, resulting in 226 genotypes for study. (B) Genotype function (percentage of wild type [%WT]) was assigned as the sum of the individual functions of each variant comprising the genotype. Genotype function is primarily below 10%, as expected for individuals with cystic fibrosis, though individuals with genotype function levels above this level are present in CFTR2.
Figure 2.
Figure 2.
Genotype function has a nonlinear relationship with cystic fibrosis clinical traits. Left-hand panels for each cystic fibrosis clinical trait plot cystic fibrosis transmembrane conductance regulator (CFTR) genotype function as a percentage of wild type (%WT) on a linear scale against (A) the mean sweat chloride from individuals with that genotype, (B) the percentage of individuals of that genotype who are pancreatic insufficient, (C) the mean FEV1% predicted for individuals of that genotype, or (D) the mean Kulich normal residual mortality-adjusted (KNoRMA) z-score for individuals of that genotype. The best-fit line is shown. Right-hand panels show CFTR genotype function plotted on a logarithmic scale. Linear regressions for right-hand panels were performed on CFTR function between 0.85% and 50% (black data points). Trait measures from CFTR genotype function outside this range are shown in gray data points. Pearson r value for correlation and P value for deviation of slope from zero are shown for each trait.
Figure 3.
Figure 3.
Lung function by age, stratified by level of cystic fibrosis transmembrane conductance regulator (CFTR) function. (A) Locally weighted scatterplot smoothing of cross-sectional FEV1% predicted measurements from 42,924 individuals in the Clinical and Functional Translation of CFTR (CFTR2) project database, plotted by age at which measurement was taken and stratified by CFTR genotype function. (B) Locally weighted scatterplot smoothing of Kulich normal residual mortality-adjusted (KNoRMA) z-scores from 42,495 individuals in the CFTR2 database, plotted by mean age at the FEV1% predicted measures used to calculate the KNoRMA z-score and stratified by CFTR genotype function. (C) The number of patients with FEV1% predicted measurements within each genotype group at 10-year age increments are shown in the table. (D) The number of patients with KNoRMA z-scores within each genotype group at 10-year mean KNoRMA age increments are shown in the table. PFTs = pulmonary function tests.
Figure 4.
Figure 4.
Treatment effect on gating variants mirrors the relationship between genotype function and phenotype determined using Clinical and Functional Translation of CFTR (CFTR2) project data. (A and B) Genotype function versus sweat chloride ([Cl]) (A) or FEV1% predicted (B) on a semilogarithmic plot indicates that the effect of ivacaftor treatment on individuals with gating variants does not differ from the relationship shown between these variables using CFTR2 data (solid line determined from genotypes with 0.85–50% function; dotted line extrapolates this relationship <0.85% or >50% function). Genotype function and baseline sweat [Cl] or FEV1% predicted of individuals tested in clinical trials with duration of either 24 or 48 weeks are represented by open red circles; after treatment, genotype function (determined by in vitro Fischer rat thyroid cell testing) and resulting sweat [Cl] or FEV1% predicted are represented by filled red circles. (A and B, insets) Genotype function versus sweat [Cl] (A, inset) or FEV1% predicted (B, inset) illustrates the nonlinear relationship between these variables. (C and D) Treatment effect from ivacaftor on sweat [Cl] (C) or FEV1% predicted (D) stratified by age cohort (colored lines) does not differ from the relationship between these variables using CFTR2 data (all ages included [mean age, 22 yr at time of FEV1% predicted measures]). Trials included in C and D ranged in duration from 24 to 144 weeks of treatment. All comparisons were performed using an interaction term between CFTR2 data and data from clinical trials and indicated no significant difference between the regressions for each dataset. Clinical trial data plotted are detailed in Table E4 and Methods. %WT = percentage of wild type.
Figure 5.
Figure 5.
Treatment effect on F508del homozygote variants mirrors the relationship between genotype function and phenotype determined using Clinical and Functional Translation of CFTR (CFTR2) project data. (A and B) Genotype function versus sweat chloride ([Cl]) (A) or FEV1% predicted (B) is plotted as described in Figure 4. The treatment effect of cystic fibrosis transmembrane conductance regulator (CFTR) modulators on F508del homozygotes does not differ from the relationship shown between these variables using CFTR2 data. Genotype function and baseline sweat [Cl] or FEV1% predicted of individuals tested in clinical trials of duration 4–24 weeks are represented by open red circles; after treatment, genotype function (determined by in vitro cystic fibrosis bronchial epithelial cell or ex vivo primary cell testing) and resulting sweat [Cl] or FEV1% predicted are represented by filled red circles. (A and B, insets) Genotype function versus sweat [Cl] (A, inset) or FEV1% predicted (B, inset) illustrates the nonlinear relationship between these variables. (C and D) Treatment effect on sweat [Cl] (C) or FEV1% predicted (D) stratified by age cohort (colored lines) does not differ from the relationship between these variables using CFTR2 data. Trials included in C and D ranged in duration from 4 to 24 weeks of treatment. All comparisons were performed using an interaction term between CFTR2 data and data from clinical trials and indicated no significant difference between the regressions for each dataset. Clinical trial data plotted are detailed in Table E4 and Methods. %WT = percentage of wild type.

Comment in

References

    1. Bobadilla JL, Macek M, Jr, Fine JP, Farrell PM. Cystic fibrosis: a worldwide analysis of CFTR mutations–correlation with incidence data and application to screening. Hum Mutat. 2002;19:575–606. - PubMed
    1. Ramsey BW, Davies J, McElvaney NG, Tullis E, Bell SC, Dřevínek P, et al. VX08-770-102 Study Group. A CFTR potentiator in patients with cystic fibrosis and the G551D mutation. N Engl J Med. 2011;365:1663–1672. - PMC - PubMed
    1. Wainwright CE, Elborn JS, Ramsey BW. Lumacaftor-ivacaftor in patients with cystic fibrosis homozygous for Phe508del CFTR. N Engl J Med. 2015;373:1783–1784. - PubMed
    1. Drumm ML, Ziady AG, Davis PB. Genetic variation and clinical heterogeneity in cystic fibrosis. Annu Rev Pathol. 2012;7:267–282. - PMC - PubMed
    1. Kerem B, Rommens JM, Buchanan JA, Markiewicz D, Cox TK, Chakravarti A, et al. Identification of the cystic fibrosis gene: genetic analysis. Science. 1989;245:1073–1080. - PubMed

Publication types

Substances