. 2019 Mar 19;14(3):e0213642.
doi: 10.1371/journal.pone.0213642. eCollection 2019.

7T MRI in epilepsy patients with previously normal clinical MRI exams compared against healthy controls

Affiliations

7T MRI in epilepsy patients with previously normal clinical MRI exams compared against healthy controls

Rebecca Emily Feldman et al. PLoS One. .

Abstract

Objective: To compare by 7 Tesla (7T) magnetic resonance imaging (MRI) in patients with focal epilepsy who have non-lesional clinical MRI scans with healthy controls.

Methods: 37 patients with focal epilepsy, based on clinical and electroencephalogram (EEG) data, with non-lesional MRIs at clinical field strengths and 21 healthy controls were recruited for the 7T imaging study. The MRI protocol consisted of high resolution T1-weighted, T2-weighted and susceptibility weighted imaging sequences of the entire cortex. The images were read by two neuroradiologists, who were initially blind to clinical data, and then reviewed a second time with knowledge of the seizure onset zone.

Results: A total of 25 patients had findings with epileptogenic potential. In five patients these were definitely related to their epilepsy, confirmed through surgical intervention, in three they co-localized to the suspected seizure onset zone and likely caused the seizures. In seven patients the imaging findings co-localized to the suspected seizure onset zone but were not the definitive cause, and ten had cortical lesions with epileptogenic potential that did not localize to the suspected seizure onset zone. There were multiple other findings of uncertain significance found in both epilepsy patients and healthy controls. The susceptibility weighted imaging sequence was instrumental in guiding more targeted inspection of the other structural images and aiding in the identification of cortical lesions.

Significance: Information revealed by the improved resolution and enhanced contrast provided by 7T imaging is valuable in noninvasive identification of lesions in epilepsy patients who are non-lesional at clinical field strengths.


Conflict of interest statement

Dr. Priti Balchandani is a named inventor on patents relating to magnetic resonance imaging (MRI) and RF pulse design [US Patents 8473536, 7996053, 7683618. Pending patents 14/697,040 and 14/960,071]. The patents have been licensed to GE Healthcare, Siemens AG, and Philips international. Dr. Balchandani receives royalty payments relating to these patents. In addition, Dr. Rebecca Feldman is a named inventor on a patent related to pulse sequence design, which was not used as part of the imaging protocol used in this experiment [Pending patents 14/697,040 and 14/960,071]. This technology currently does not have any financial value, but may benefit as a result of this study. The remaining authors have no conflict of interest to disclose. This does not alter our adherence to PLOS ONE policies on sharing data and materials.

Figures
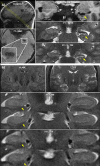
Fig 1
Fig 1. Hippocampal Asymmetry.
(A) Patient 19 –clockwise from top left: A low resolution localizer indicating the coronal-oblique slice thorough the hippocampus shown; 7T: MP2RAGE UniDen reconstruction visualizing the cavity; 7T:T2 TSE image showing a coronal oblique slice through the hippocampus and a visualization of the parenchymal cavernoma; 3T: T2 TSE scan, acquired previously, showing the location of the lesion. On the 3T image, the lesion was less conspicuous and therefore went undiagnosed despite being identified in a retrospective examination of the image; SWI axial slice where the cavernoma can be clearly identified. (B) Patient 24—from top left: A 7T FLAIR image showing relatively equivalent signal intensity in both hippocampi; 7T:T2 TSE image showing full coronal-oblique slice and right hippocampal sclerosis, and 3T T2 images showing the hippocampus.7T:T2 TSE slice series showing a coronal oblique slice through the hippocampus showing right hippocampal sclerosis with decreased digitation and lamination without accompanying signal change in the hippocampus on the FLAIR image. The 3T T2 images for this subject do not show this architectural change in the hippocampus.
Fig 2
Fig 2. Cortical Abnormalities.
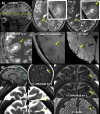
(A) Patient 7 –clockwise from top left: Localizer image showing the location of the axial slices; 3T T2 axial image of the lesion illustrating subtle changes in cortical thickness detected only after the lesion was identified at 7T; 7T T2 TSE slice visualizing the polymicrogyria marked by a yellow arrow highlighting the texture of the polymicrogyria; 7T: MP2RAGE with T1 weighted reconstruction highlighting the abnormal thickening of the cortex due to the polymicrogyria; 3T T1-w spin-echo of the same region; 7T SWI axial slice showing abnormal vasculature due to the polymicrogyria (B) Patient 36 –clockwise from top left: Localizer image showing the location of the axial slices; MP2RAGE full coronal-oblique slice showing cortical dysplasia (yellow arrow) in the left parietal lobe; enlarged slices of 7T MP2RAGE image showing cortical dysplasia marked by a yellow arrow in the left parietal lobe; 7T FLAIR slice showing the location of the cortical dysplasia (yellow arrow) enlarged slices of 7T T2 TSE image showing cortical dysplasia (yellow arrow) in the left parietal lobe.
Fig 3
Fig 3. Lesions identified on SWI.
(A) Patient 17 –clockwise from top left: Localizer image showing the location of the axial slices; an enlarged view of a DVA associated with the sSOZ identified on the SWI; full axial slice of 7T SWI minimum intensity projection showing a DVA.(B) Patient 10 –left to right: Localizer image showing the location of the axial slices; T2 TSE slice (full slice above, enlarged image below) showing a cortical thickness defect indicated by a yellow arrow, initially identified on SWI; SWI slice (full slice above, enlarged image below) showing a punctate focus of susceptibility indicated by a yellow arrow co-localized with a cortical thickness defect.
Fig 4
Fig 4. Lesion frequency.
Graph showing numbers of reported findings in both controls (pink) and patients with epilepsy when blinded (light blue), and unblinded (dark blue). Grey shaded rows show total numbers for a particular category of findings. Abbreviations: PVS-perivascular spaces; SWI–susceptibility weighted imaging.

Similar articles

Cited by

References

    1. Duncan JS, Sander JW, Sisodiya SM, Walker MC. Adult epilepsy. Lancet 2006; 367: 1087–1100. 10.1016/S0140-6736(06)68477-8 - DOI - PubMed
    1. Kwan P, Brodie MJ. Early identification of refractory epilepsy. N Engl J Med 2000; 342: 314–319. 10.1056/NEJM200002033420503 - DOI - PubMed
    1. Tellez-Zenteno JF, Dhar R, Hernandez-Ronquillo L, Wiebe S. Long-term outcomes in epilepsy surgery: antiepileptic drugs, mortality, cognitive and psychosocial aspects. Brain 2007; 130: 334–345. 10.1093/brain/awl316 - DOI - PubMed
    1. Nowell M, Miserocchi A, McEvoy AW, Duncan JS. Advances in epilepsy surgery. J Neurol Neurosurg Psychiatry 2014; 85: 1273–1279. 10.1136/jnnp-2013-307069 - DOI - PMC - PubMed
    1. Duncan JS. Imaging in the surgical treatment of epilepsy. Nat Rev Neurol 2010; 6: 537–550. 10.1038/nrneurol.2010.131 - DOI - PubMed

Publication types