Review
. 2019 Apr;60(4):593-604.
doi: 10.1111/epi.14688. Epub 2019 Mar 19.

Neuroimaging and connectomics of drug-resistant epilepsy at multiple scales: From focal lesions to macroscale networks

Affiliations
Review

Neuroimaging and connectomics of drug-resistant epilepsy at multiple scales: From focal lesions to macroscale networks

Shahin Tavakol et al. Epilepsia. 2019 Apr.

Abstract

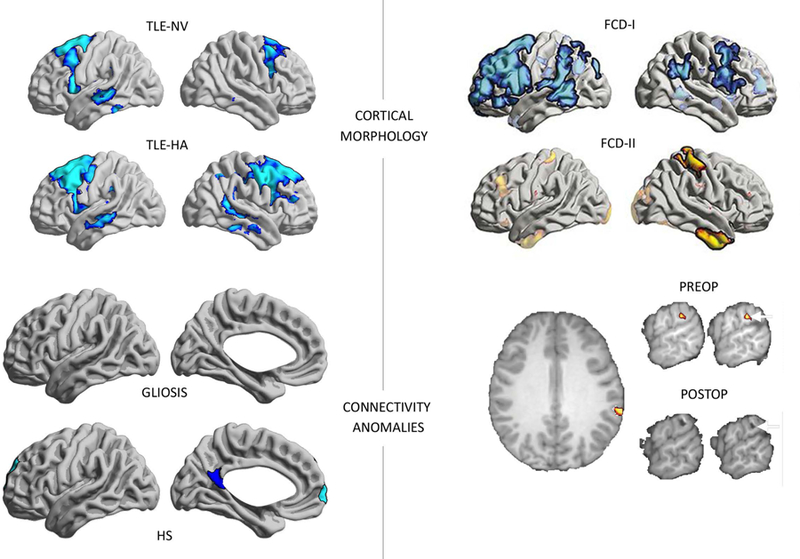
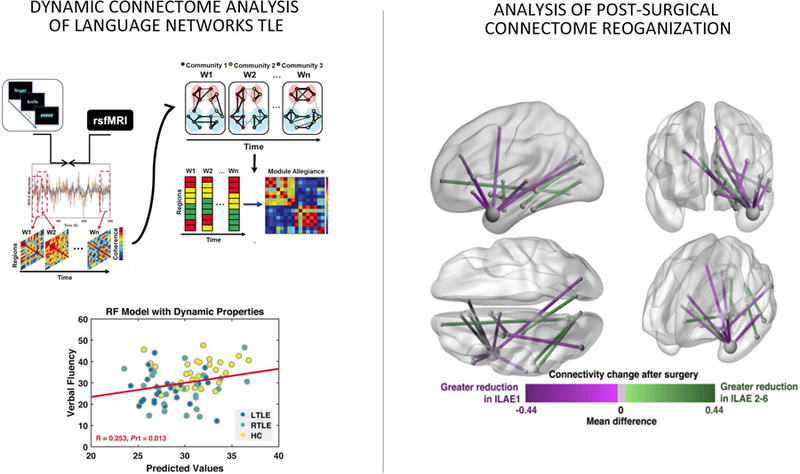
Epilepsy is among the most common chronic neurologic disorders, with 30%-40% of patients having seizures despite antiepileptic drug treatment. The advent of brain imaging and network analyses has greatly improved the understanding of this condition. In particular, developments in magnetic resonance imaging (MRI) have provided measures for the noninvasive characterization and detection of lesions causing epilepsy. MRI techniques can probe structural and functional connectivity, and network analyses have shaped our understanding of whole-brain anomalies associated with focal epilepsies. This review considers the progress made by neuroimaging and connectomics in the study of drug-resistant epilepsies due to focal substrates, particularly temporal lobe epilepsy related to mesiotemporal sclerosis and extratemporal lobe epilepsies associated with malformations of cortical development. In these disorders, there is evidence of widespread disturbances of structural and functional connectivity that may contribute to the clinical and cognitive prognosis of individual patients. It is hoped that studying the interplay between macroscale network anomalies and lesional profiles will improve our understanding of focal epilepsies and assist treatment choices.

Keywords: MRI; biomarker; connectivity; connectome; epilepsy.


Conflict of interest statement

Disclosure

None of the authors has any conflict of interest to disclose.

Figures

F<sc>igure</sc> 1.
Figure 1.
Left: Neuroimaging of hippocampal sclerosis (HS, cell loss and gliosis in the hippocampal formation). Upper panels show histological specimens and corresponding high-resolution T1-and T2-weighted images in two TLE patients with variable degrees of HS. Lower panels illustrate preoperative imaging findings in two cohorts with TLE relative to controls, with the one on the left presenting with isolated gliosis but only little cell loss while patients on the right showed marked HS. For details, see . TLE-HS shows decreased volume together with T2-weighted intensity increases compared to controls. TLE-gliosis only showed focal increases in T2-weighted intensity but no reductions in columnar volumes. CA: Cornu Ammonis Subfield, DG – Dentate Gyrus – Sub – Subiculum. Right: Neuroimaging profiles of FCD subtypes (i.e., FCD Type-IIA, red, and IIB, black). Features include T1w-and FLAIR-intensity, vertical, and horizontal gradients. Features were analyzed at different intracortical depths (25–100%). Compared to controls, abnormalities in FCD Type IIB were seen across most intracortical layers, whereas alterations remained closer to the gray matter/white matter boundary in IIA. The innermost marker indicates significant differences between an FCD subtype and healthy controls, while the outermost marker indicates significant differences between both FCD subtypes i.e., IIA and IIB (* FDR < 0.05; • Uncorrected p < 0.05). For details, see .
F<sc>igure</sc> 2.
Figure 2.
Structural and functional connectivity anomalies in TLE and ETE. Top left: Top left: Widespread cortical thinning in temporal and fronto-central neocortices in (MRI-defined) subgroups of patients with hippocampal atrophy (TLE-HA) and patients with normal hippocampal volume (TLE-NV) compared to controls, based on a sample of TLE patients and healthy individuals scanned at 1.5T . Top right: In dysplasia-related ETE, a study has shown that the direction of overall morphometric anomalies may be different as a function of the specific histological subtype of the primary lesion . Bottom left: Disruptions in hippocampal functional connectivity are selectively seen in TLE subgroups, who had postoperative histological assessment of hippocampal pathology, compared to healthy controls. Functional connectivity anomalies were seen in patients with hippocampal sclerosis (TLE-HS) but not in the subgroup of TLE patients that showed isolated astrogliosis (TLE-G), suggesting an association between hippocampal structural integrity and its functional network embedding. For details, see . Please note that results in the Top Left and Bottom Left were obtained from two independent TLE cohorts, scanned at different MRI platforms, with different procedures to assess the degree of hippocampal structural alterations. Bottom right: Functional connectivity anomalies in a patient with ETE co-localizing with the surgical target. The patient has been seizure-free post-op .
F<sc>igure</sc> 3.
Figure 3.
Connectome-level findings in focal epilepsy. Top left: Structural covariance anomalies in TLE, showing increased path length and clustering in left and right TLE (LTLE/RTLE) patients compared to controls, suggesting network-level regularization . Top right: Covariance network analyses in extra-temporal epilepsy also suggest an increased clustering and path length across all subtypes, with however more marked effects in late stage cortical malformations (PMG – polymicrogyrias) compared to those thought to occur mainly in early (FCD Type-II) and intermediary stages (HET – heterotopia) of corticogenesis. Bottom left: Functional connectivity anomalies in TLE relative to controls, also showing increased path length . Bottom right: Functional network anomalies in a cohort of ETE showing an increase in local efficiency and higher clustering coefficient compared to healthy controls, suggesting increased local network segregation .
F<sc>igure</sc> 4.
Figure 4.
Connectome models of postsurgical seizure outcome in TLE (left) and dysplasia-related ETE (right). For details, please see ; .
F<sc>igure</sc> 5.
Figure 5.
Left: Dynamic functional connectome markers of language networks in TLE, which can be used to predict impairments in verbal fluency . Right: Pre-to postoperative changes in diffusion-derived macroscale connectivity, with differ between seizure free and non-seizure free patients .

References

    1. Chin JH, Vora N. The global burden of neurologic diseases. Neurology 2014;83:349–351. - PMC - PubMed
    1. Kwan P, Brodie MJ. Early identification of refractory epilepsy. N Engl J Med 2000;342:314–319. - PubMed
    1. Engel J Jr. What can we do for people with drug-resistant epilepsy? The 2016 Wartenberg Lecture. Neurology 2016;87:2483–2489. - PMC - PubMed
    1. Caciagli L, Bernasconi A, Wiebe S, et al. Time is brain? A meta-analysis on progressive atrophy in intractable temporal lobe epilepsy. Neurology 2017;in press. - PMC - PubMed
    1. Bernasconi A, Bernasconi N, Bernhardt BC, et al. Advances in MRI for ‘cryptogenic’ epilepsies. Nat Rev Neurol 2011;7:99–108. - PubMed

Publication types

MeSH terms