. 2019 Mar 18;35(3):473-488.e6.
doi: 10.1016/j.ccell.2019.02.006.

CD40 Ligand-Modified Chimeric Antigen Receptor T Cells Enhance Antitumor Function by Eliciting an Endogenous Antitumor Response

Affiliations

CD40 Ligand-Modified Chimeric Antigen Receptor T Cells Enhance Antitumor Function by Eliciting an Endogenous Antitumor Response

Nicholas F Kuhn et al. Cancer Cell. .

Abstract

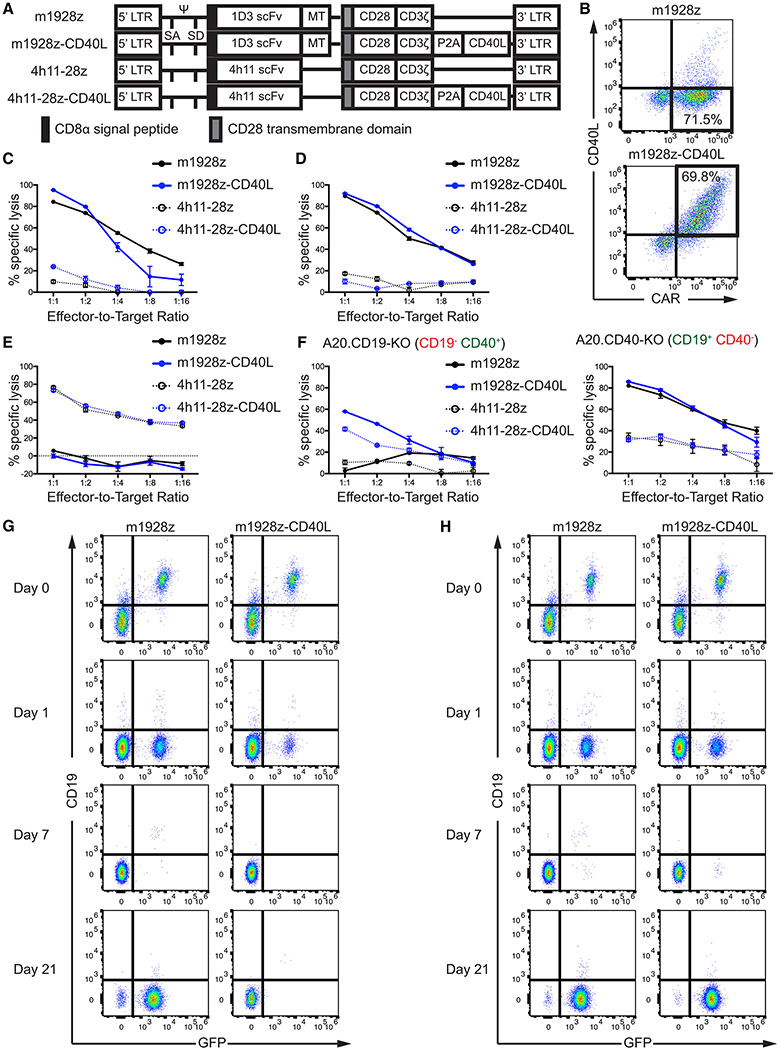
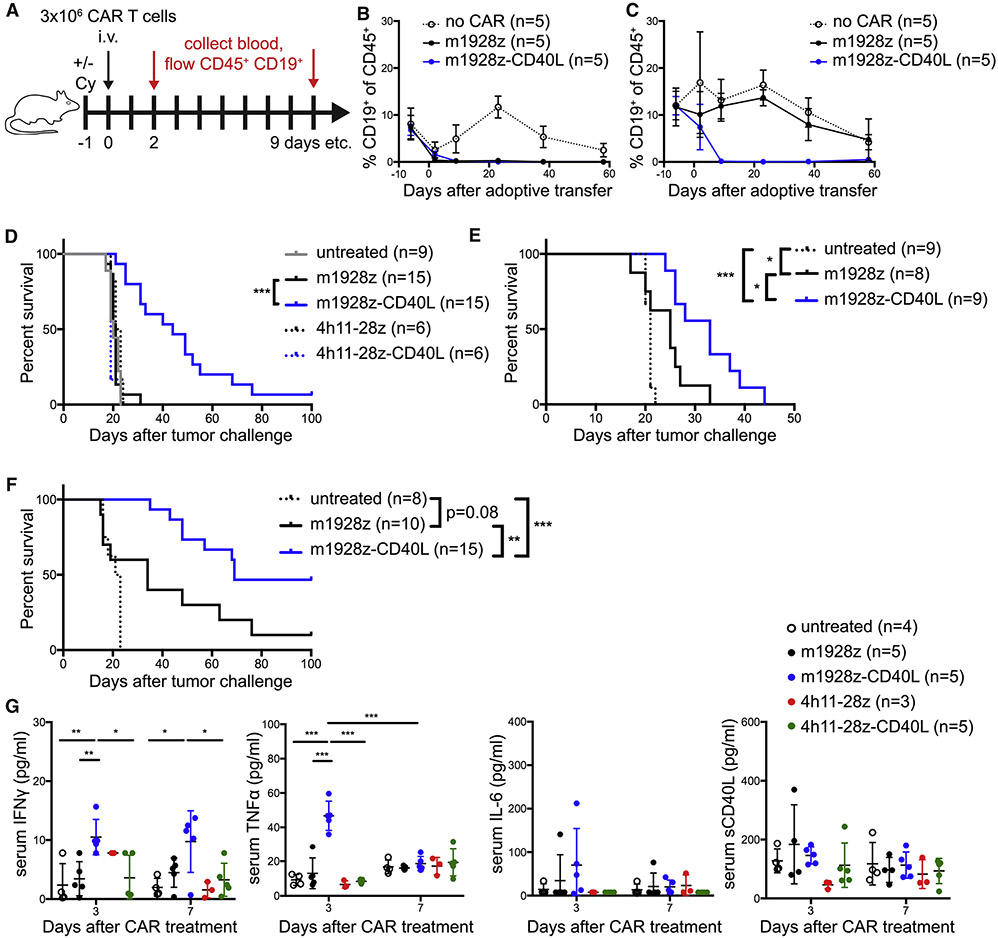
Chimeric antigen receptor (CAR) T cells provide great efficacy in B cell malignancies. However, improved CAR T cell therapies are still needed. Here, we engineered tumor-targeted CAR T cells to constitutively express the immune-stimulatory molecule CD40 ligand (CD40L) and explored efficacy in different mouse leukemia/lymphoma models. We observed that CD40L+ CAR T cells circumvent tumor immune escape via antigen loss through CD40/CD40L-mediated cytotoxicity and induction of a sustained, endogenous immune response. After adoptive cell transfer, the CD40L+ CAR T cells displayed superior antitumor efficacy, licensed antigen-presenting cells, enhanced recruitment of immune effectors, and mobilized endogenous tumor-recognizing T cells. These effects were absent in Cd40-/- mice and provide a rationale for the use of CD40L+ CAR T cells in cancer treatment.

Keywords: CAR T cells; CD40; CD40 ligand; antigen-presenting cells; chimeric antigen receptor; endogenous T cells; immunotherapy; leukemia; lymphoma.


Figures

Figure 1.
Figure 1.. CD40/CD40L-Mediated Cytotoxicity by m1928z-CD40L CAR T Cells Prevents Outgrowth of Antigen-Negative Tumor Cells
(A)Construct maps encoding CARs with or without CD40L. The 1D3 scFv binds murine CD19 and the 4h11 scFv binds the ectodomain of human MUC16, serving as a negative control throughout this study. (B) Transgene expression after retroviral transduction of mouse T cells by flow cytometry. (C-E) In vitro cytotoxicity of CAR T cells was assessed using a 16 hr bioluminescence assay. CD19+ CD40+ A20 (C), and CD19+ CD40 Eμ-ALL01 (D) cells were used as targets. CD19 CD40 MUC16+ ID8 (E) cells served assed a negative control. Plots are representative of two independent experiments. Data are means ± SEM. (F) In vitro cytotoxicity of CAR T cells was assessed using a 16 hr bioluminescence assay in A20 with KO of CD19 (left) or CD40 (right). Plots are representative of two independent experiments. Data are means ± SEM. (G and H) CD19+ CD40+ GFP+ A20 cells (G) or CD19+ CD40 GFP+ A20 cells (H) were co-cultured at a 1:1 ratio with m1928z or m1928z-CD40L CAR T cells. Percentage of GFP+ tumor cells and CD19 surface expression was assessed over time by flow cytometry. Shown is one of 3 independent experiments. LTR, long terminal repeats; MT, myc tag; P2A, P2A element; SA, splice acceptor; scFv, small chain variable fragment; SD, splice donor; Ψ, packaging signal. See also Figure S1.
Figure 2.
Figure 2.. m1928z-CD40L CAR T cells function in vivo without preconditioning and display improved antitumor response in murine CD19+ disease models independent of CD40 surface expression on the tumor
(A) Experimental layout for (B) and (C). (B and C) Non-tumor-bearing mice were preconditioned with (B) or without (C) Cy and treated as outlined in (A). Mice were bled at indicated time points and the percentage of CD19+ B cells in the CD45+ population in the peripheral blood was assessed by flow cytometry. Means ± SEM are shown (n=5/group). (D and E) Survival of BALB/c mice inoculated with 1×10⁶ tumor cells i.v. on day 0 and treated with 3×10⁶ CAR T cells i.v. on day 7 without preconditioning. Mice were injected with A20.GL tumor cells (n=6-15/group, pooled from 3 independent experiments) (D) or A20.CD40-KO tumor cells (n=8-9/group, pooled from two independent experiments) (E). (F) Survival of C57BL/6 mice inoculated with 1×10⁶ CD19+ CD40 Eμ-ALL01 leukemia cells i.v. on day 0 and treated with 1-2×10⁶ CAR T cells i.v. on day 7 without preconditioning (n=8-15, pooled from two independent experiments). *p<0.05, **p<0.01, ***p<0.001 by a log-rank (Mantel-Cox) test (D-F). (G) Serum levels of IFNγ, TNFα, IL-6, and sCD40L in A20.GL tumor-bearing mice treated with 3×10⁶ CAR T cells i.v. (n=3-5/group) were measured on days 3 and 7 after CAR treatment by Luminex. Data is plotted as mean ± SEM and is representative of two independent experiments. *p<0.05, **p<0.01, ***p<0.001 (Student’s t test). See also Figure S2.
Figure 3.
Figure 3.. CD40L-modified CAR T cells promote upregulation of co-stimulatory markers on CD40+ lymphoma cells and licensing of DCs
(A) Representative histograms of flow cytometry analysis of CD80 and CD86 expression on A20 cells co-cultured for 48 hr with CD40L+ or CD40L T cells. Graph summarizes results of 3 independent experiments as geometric mean fluorescence intensity (GeoMFI) fold-change (mean ± SEM; CD40L T cells normalized to 1). *p<0.05, ***p<0.001 (Student’s t-test). (B) Same as in (A), but this time T cells were co-cultured with A20.CD40-KO cells. Results are representative of two independent experiments. (C) Representative histograms of flow cytometry analysis of CD80, CD86, and MHC-II on BMDCs co-cultured for 48 hr with CD40L+ or CD40L T cells. Graph summarizes percentage of CD80hi, CD86hi, and MHC-IIhi BMDCs of 3 independent experiments (mean ± SD). *p<0.01 (Student’s t-test). (D) IL-12p70 concentration in the supernatant from cultured cells in (C) was measured by Luminex. Graph represents mean ± SD of experimental triplicates. One of two representative experiments is shown. n.d., not detected. FMO, fluorescence minus one. See also Figure S3.
Figure 4.
Figure 4.. m1928z-CD40L CAR T cells license APCs in vivo
(A) Experimental layout for (B-F). (B) GFP+ tumor cells (%) in the liver of mice treated with indicated CAR T cells (n=3 mice). (C and D) Surface expression of CD40, CD86, and MHC-II on CD11b CD11c+ DCs and CD11b+ F4/80+ macrophages (CD45+ CD3 CD19 Gr-1 pre-gates) in tumor (C) and spleen (D). Quantification of surface marker expression is plotted underneath the histograms (n=10-13/group, data pooled from 3 independent experiments, m1928z normalized to 1). (E and F) Intracellular flow cytometry of DCs for IL-12p40 production in tumor (E) and spleen (F) of mice treated with m1928z or m1928z-CD40L CAR T cells. Boxed regions highlight IL-12p40-producing DCs. One representative plot per treatment condition is shown. Quantification of IL-12 production is plotted on the right (n=3/group). Each dot represents one mouse. Data is plotted as mean ± SEM and is representative of 2-3 independent experiments. *p<0.05, **p<0.01, ****p<0.0001 (Student’s t test). FMO, fluorescence minus one; ns, non-significant. See also Figure S4.
Figure 5.
Figure 5.. m1928z-CD40L CAR T cell treatment promotes the recruitment of immune effectors
(A) BALB/c mice were injected i.v. with 1×10⁶ A20.GL cells followed by ACT of 3×10⁶ CAR T cells 7 days after tumor inoculation. The splens and tumors of the mice were analyzed 7 days after ACT. Immunofluorescent staining for DAPI (blue), B220 (red), CD3 (green), and CAR (white) in spleens of m1928z (top) or m1928z-CD40L (bottom) CAR T cell treated mice. One of two representative spleens is shown per cohort. Individual antibody stains at higher magnification of boxed in region are shown on the right. Scale bar, 250 or 50 μm. (B-E) Quantification of different immune cell populations in tumor tissue from mice in (A). Frequency of macrophages (MAC) and dendritic cells (DC) as percentage of CD45+ cells (B). Frequency of CD4+ T cells, CD8+ T cells, NKp46+ lymphocytes, and Treg cells (CD4+ Foxp3+) as percentage of CD45+ cells (C). The CD8+ / Treg cell ratio in tumor tissue (D). Quantification of CAR+ T cells per mg of tumor tissue (E). (F-I) Quantification of different immune cell populations in the spleen from mice in (A). Frequency of MAC and DC as percentage of CD45+ cells (F). Frequency of CD4+ T cells, CD8+ T cells, NKp46+ lymphocytes, and Treg cells as percentage of CD45+ cells (G). The CD8+ / Treg cell ratio in spleen tissue (H). Quantification of CAR+ T cells per mg of spleen tissue (I). (J) Cytokine Array of 40 proteins taken from the supernatant of homogenized spleens of m1928z or m1928z-CD40L CAR T cell treated mice as in (A). (K) Quantification of significantly changed cytokines in (J) (n=3 mice/group). One of two representative experiments is shown. Each dot represents one mouse. Data is plotted as mean ± SEM and is representative of 2-3 independent experiments. *p<0.05, **p<0.01, ***p<0.001 (Student’s t test). ns, non-significant. See also Figure S5.
Figure 6.
Figure 6.. m1928z-CD40L CAR T cell-induced expansion and licensing of DCs is dependent on host Cd40 expression
(A) Survival of WT or Cd40−/− BALB/c mice inoculated with 1×10⁶ A20.CD40-KO cells i.v. and treated with 3×10⁶ m1928z-CD40L CAR T cells i.v. on day 7. Graph summarizes two independent experiments (n=4-10/group). *p<0.05, ****p<0.0001 by log-rank (Mantel-Cox) test. (B) Experimental layout using Cd40−/− BALB/c mice as tumor-bearing mice in (C-E). (C and D) Surface expression of CD40, CD86, and MHC-II on CD11b CD11c+ DCs and CD11b+ F4/80+ macrophages (CD45+ CD3 CD19 Gr-1 pre-gates) in tumor (C) and spleen (D). Quantification of surface marker expression is plotted underneath the histograms (n=7/group, m1928z normalized to 1). (E) Intracellular flow cytometry of DCs for IL-12p40 production in spleen of mice treated with m1928z or m1928z-CD40L CAR T cells. Boxed regions highlight IL-12p40-producing DCs. One representative plot per treatment condition is shown. Quantification of IL-12 production is plotted on the right (n=7/group). Data is the summary of two independent experiments and plotted as mean ± SEM. ns, non-significant (Student’s t-test). See also Figure S6.
Figure 7.
Figure 7.. m1928z-CD40L CAR T cells produce more effector cytokines in vivo and increase the effector function of endogenous non-CAR T cells in a CD40-dependent fashion.
(A and B) BALB/c mice were were inoculated with 1×10⁶ A20.GL cells i.v. and treated with 3×10⁶ CAR T cells i.v. after 7 days. On day 7 after ACT, CD3+ CAR+ (top) and CD3+ CAR (bottom) cells (CD45+ CD19 CD11b Gr-1 pre-gate) were analyzed for the production of IFNγ and TNFα by intracellular flow cytometry in tumor (A) or spleen (B). Overlay plots (left) and quantification (right) are shown (n=3/group). Data is representative of two independent experiments and graphed as mean ± SEM. *p<0.05, **p<0.01, ***p<0.001 (Student’s t test). (C and D) Cd40−/− BALB/c mice were treated and analyzed as in (A and B). Overlay plots (left) and quantification (right) are shown (n=3/group). Data is representative of two independent experiments and graphed as mean ± SEM. ns, non-significant (Student’s t test). (E) Experimental layout for (F-J). (F-J) BALB/c mice were treated as depicted in (E). On day 7, mice were sacrificed and Thy1.2+ CAR host T cells were sorted from spleens via FACS. Sorted CD4+ T cells were then cultured without any stimulation (F) or stimulated by co-culturing with CD19+ A20 cells (G). Sorted CD8+ T cells were cultured without stimulation (H) or co-cultured with CD19+ A20 cells (I) or A20.B2M-KO (MFIC-I) cells (J) for 24 hr. IFNγ release was measured by ELISpot assay. Data are representative of two independent experiments and graphed as mean ± SEM (n=3-6/group). *p<0.05, **p<0.01, ***p<0.001 (Student’s t test). ns, non-significant. (K) Surviving BALB/c mice that were initially challenged with A20 lymphoma cells and treated with m1928z-CD40L CAR T cells were inoculated i.v. with 1×10⁵ A20.CD19-KO lymphoma cells on day 99+. Kaplan-Meier survival plots of n=5 mice/group. **p<0.01 by a logrank (Mantel-Cox) test. (L) Surviving C57BL/6 mice that were initially challenged with Eμ-ALL01 leukemia cells and treated with m1928z-CD40L CAR T cells were inoculated i.v. with 1×10⁶ Eμ-ALL01.CD19-KO leukemia cells on day 140+. Kaplan-Meier survival plots of n=5-7 mice/group. **p<0.01, ***p<0.001 by a logrank (Mantel-Cox) test. See also Figure S7.

References

    1. Avanzi MP, Yeku O, Li X, Wijewarnasuriya DP, van Leeuwen DG, Cheung K, Park H, Purdon TJ, Daniyan AF, Spitzer MH, et al. (2018). Engineered Tumor-Targeted T Cells Mediate Enhanced Anti-Tumor Efficacy Both Directly and through Activation of the Endogenous Immune System. Cell Rep. - PMC - PubMed
    1. Banchereau J, and Steinman RM (1998). Dendritic cells and the control of immunity. Nature 392, 245–252. - PubMed
    1. Barbier L, Tay SS, McGuffog C, Triccas JA, McCaughan GW, Bowen DG, and Bertolino P (2012). Two lymph nodes draining the mouse liver are the preferential site of DC migration and T cell activation. J. Hepatol. - PubMed
    1. Beatty GL, Chiorean EG, Fishman MP, Saboury B, Teitelbaum UR, Sun W, Huhn RD, Song W, Li D, Sharp LL, et al. (2011). CD40 agonists alter tumor stroma and show efficacy against pancreatic carcinoma in mice and humans. Science (80-. ). 331, 1612–1616. - PMC - PubMed
    1. Beatty GL, Torigian DA, Chiorean EG, Saboury B, Brothers A, Alavi A, Troxel AB, Sun W, Teitelbaum UR, Vonderheide RH, et al. (2013). A phase I study of an agonist CD40 monoclonal antibody (CP-870,893) in combination with gemcitabine in patients with advanced pancreatic ductal adenocarcinoma. Clin. Cancer Res. 19, 6286–6295. - PMC - PubMed

Publication types