. 2019 Mar 18;35(3):489-503.e8.
doi: 10.1016/j.ccell.2019.02.003.

Logic-Gated ROR1 Chimeric Antigen Receptor Expression Rescues T Cell-Mediated Toxicity to Normal Tissues and Enables Selective Tumor Targeting

Affiliations

Logic-Gated ROR1 Chimeric Antigen Receptor Expression Rescues T Cell-Mediated Toxicity to Normal Tissues and Enables Selective Tumor Targeting

Shivani Srivastava et al. Cancer Cell. .

Abstract

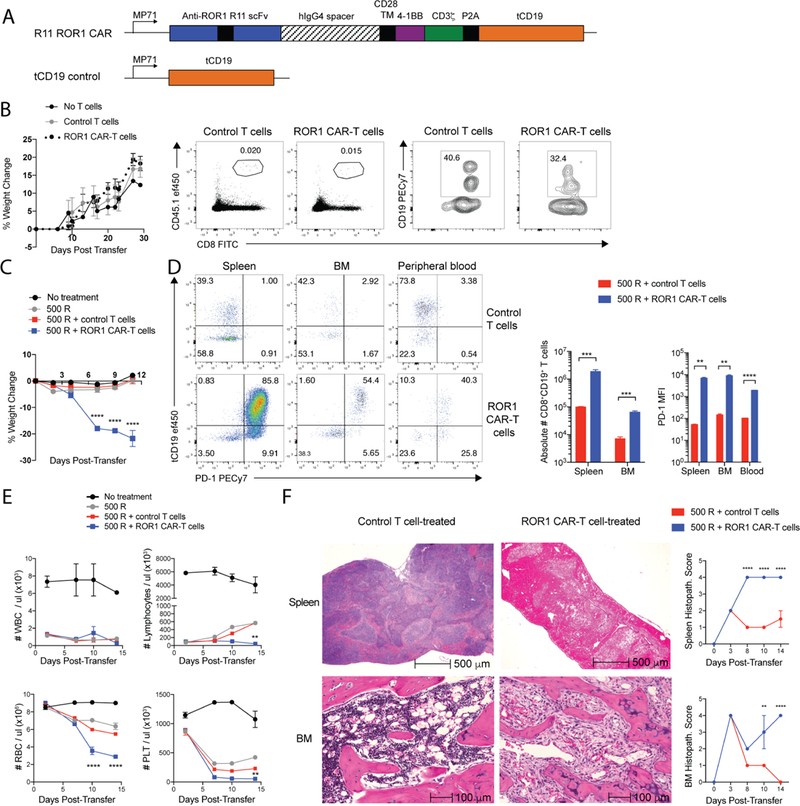
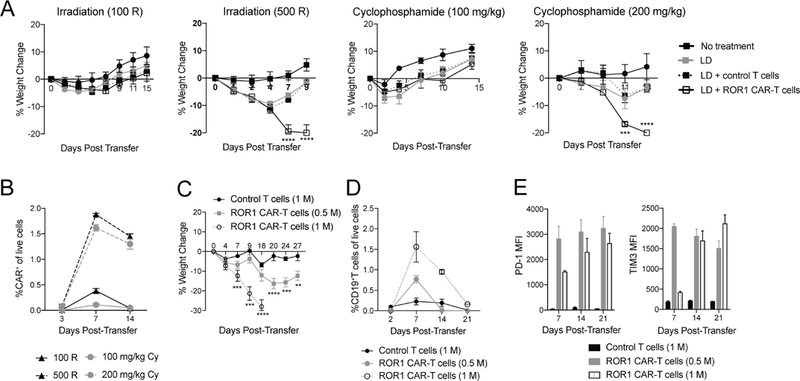
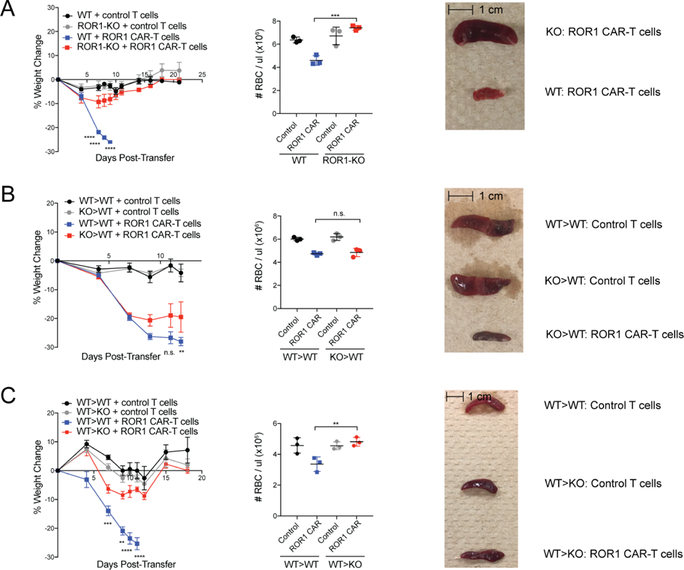
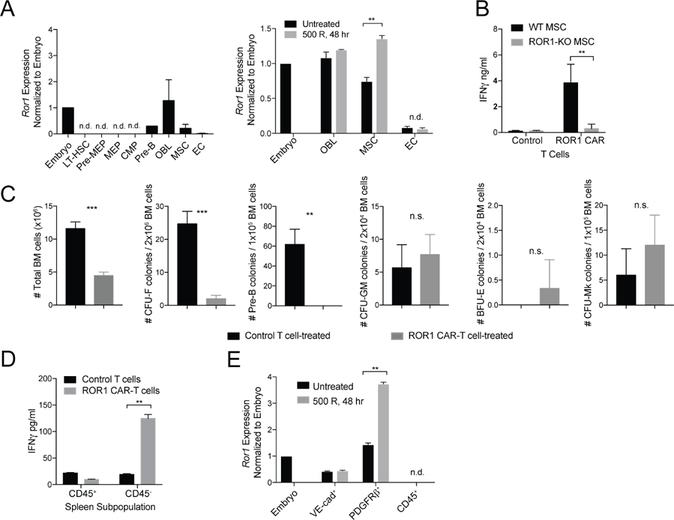
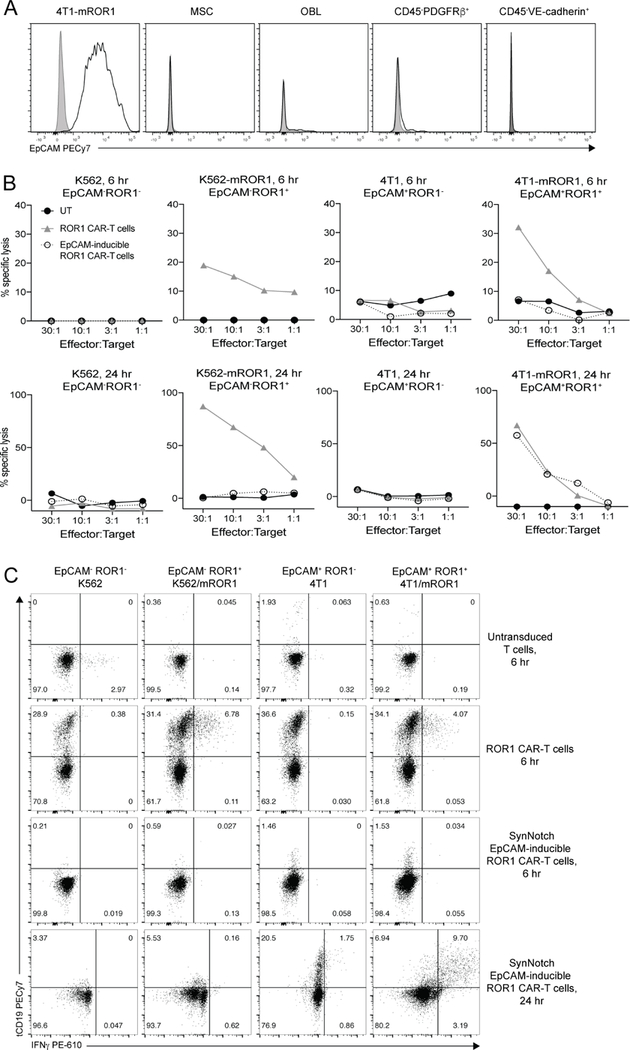
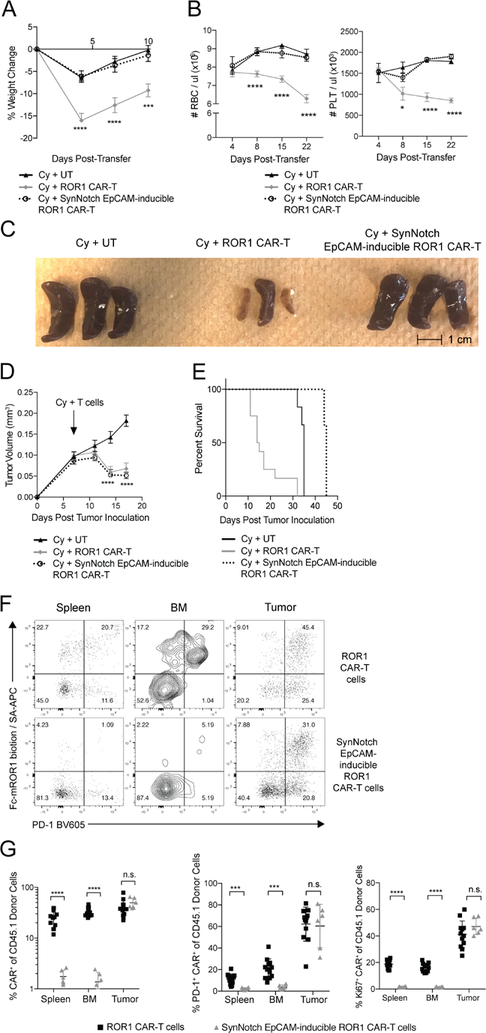
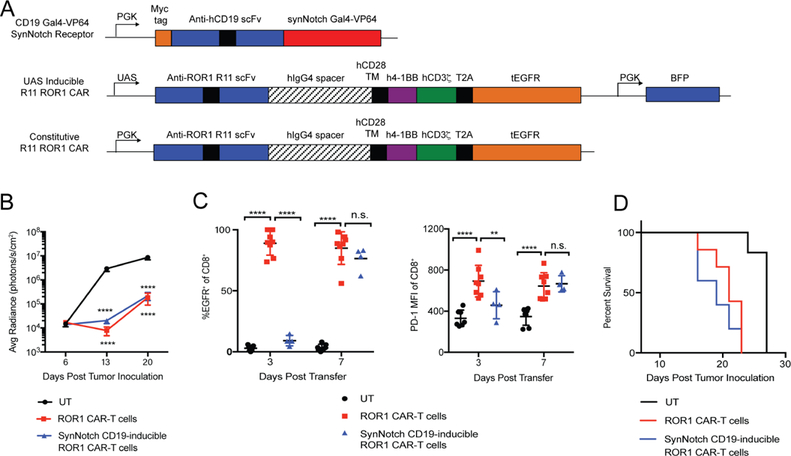
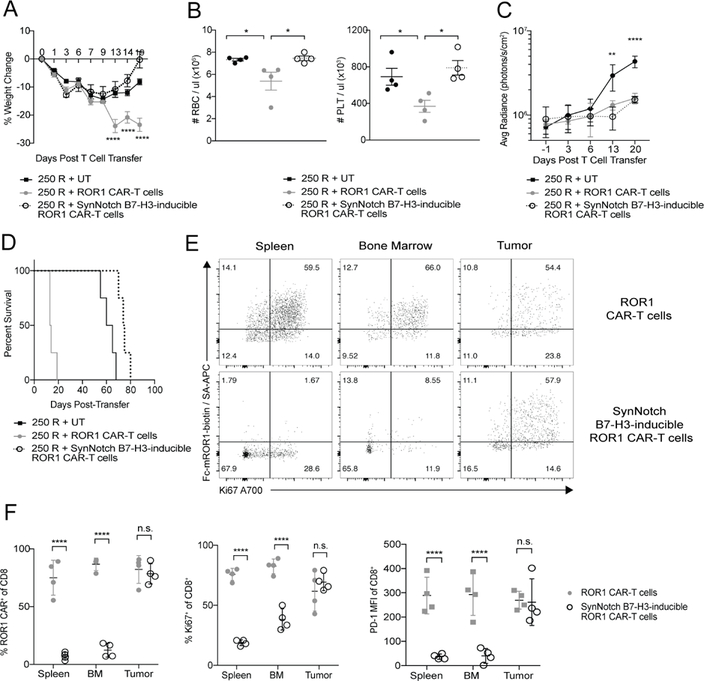
Many potential targets for CAR-T cells in solid tumors are expressed in some normal tissues, raising concern for off-tumor toxicity. Following lymphodepletion, CAR-T cells targeting the tumor-associated antigen ROR1 lysed tumors in mice but induced lethal bone marrow failure due to recognition of ROR1+ stromal cells. To improve selectivity, we engineered T cells with synthetic Notch (synNotch) receptors specific for EpCAM or B7-H3, which are expressed on ROR1+ tumor cells but not ROR1+ stromal cells. SynNotch receptors induced ROR1 CAR expression selectively within the tumor, resulting in tumor regression without toxicity when tumor cells were segregated from, but not when co-localized with, normal ROR1+ cells. This strategy, thus, permits safe targeting of tumors that are sufficiently separated from normal cells.

Keywords: B7-H3; ROR1; T cells; chimeric antigen receptor; combinatorial antigen recognition; immunotherapy; logic gating; mesenchymal stem cell; synthetic Notch receptors; toxicity.


Conflict of interest statement

Declaration of Interests

S.R.R. is a cofounder and has served as an advisor for Juno Therapeutics, a Celgene company, and holds equity in Celgene. S.R.R. has served on advisory boards for Adaptive Biotechnologies, Nohla, and Cell Medica. C.R. is named inventor on U.S. Patent 9,758,586 claiming anti-ROR1 monoclonal antibodies R11 and R12 and is on the advisory board of BNE-Therapeutics. No potential conflicts of interest were disclosed by the other authors.

Figures

Figure 1.
Figure 1.. ROR1 CAR-T cells induce lethal toxicity in mice pre-conditioned with radiation.
(A) Map of retroviral constructs used to generate ROR1 CAR and control T cells. TM = transmembrane. hIgG4 = human immunoglobulin G4. scFv = single chain variable fragment. (B) Percent change in body weight in BALB/c mice (left) and representative flow cytometric plots showing frequency of CD8+CD45.1+ donor T cells of live cells and frequency of CD8+tCD19+ cells of CD45.1+ donor T cells 7 days post-transfer (right). (C) Percent change in body weight in BALB/c mice. n=4 mice per group. Two-way ANOVA with Tukey’s post-test (ROR1 CAR-T vs control T at Day 7, 9, 11: p<0.00001). (D) Representative flow cytometric plots showing expression of tCD19 transduction marker and PD-1 on CD8+CD45.1+ donor T cells 4 days post-transfer (left) and summary of absolute number and PD-1 median fluorescence intensity (MFI) on CD45.1+CD8+tCD19+ control or ROR1 CAR-T cells 4 days post-transfer (right). n=4 mice per group. Unpaired Student’s two-way t-test (Abs #: spleen, p=0.0004; BM, p=0.0002; PD-1: spleen, p=0.0007; BM, p=0.0007; blood, p=0.000008). (E) White blood cell (WBC), lymphocyte, red blood cell (RBC), and platelet (PLT) counts in peripheral blood. n=4 mice per group. Two-way ANOVA with Tukey’s post-test (ROR1 CAR-T vs control T: Lymphocytes Day 14, p<0.005; RBC Day 10,14, p<0.00001; PLT Day 14, p<0.005). (F) Representative H&E stains of spleen and femur (BM) 14 days post-transfer (left) and histopathology scoring of control or ROR1 CAR-T cell-treated tissues (right). n=4 mice per group. Two-way ANOVA with Sidak post-test (Spleen Day 8,10,14, p<0.00001; BM Day 10, p=0.004; BM Day 14, p<0.00001). Data are representative of 5 independent experiments. All data are presented as the mean values ± SEM. See also Table S1 and Figures S1-S2.
Figure 2.
Figure 2.. ROR1 CAR-T cell-mediated toxicity is dependent on degree of lymphodepletion and dose of ROR1 CAR-T cells.
(A) Percent change in body weight in BALB/c mice lymphodepleted (LD) as indicated. n=4 mice per group. Two-way ANOVA with Tukey’s post-test (ROR1 CAR-T vs control T: 500 R Day 7, 9, p<0.00001; 200 mg/kg cyclophosphamide (Cy) Day 7, p=0.0004; 200 mg/kg Cy Day 9, p<0.00001). (B) Frequency of CD8+CD45.1+tCD19+ ROR1 CAR-T cells in peripheral blood of BALB/c mice receiving 100 R, 500 R, 100 mg/kg Cy, or 200 mg/kg Cy for LD. n=4 mice per group. (C-E) Percent change in body weight (C), frequency (D) and PD-1 and TIM3 expression (E) on CD8+CD45.1+tCD19+ donor T cells in peripheral blood of BALB/c mice irradiated 500 R and treated as indicated. n=4 mice per group. Two-way ANOVA with Tukey’s post-test (1 M CAR-T vs control T: Day 7, p=0.0003; Day 9,18, p<0.00001; 0.5 M CAR-T vs control T: Day 20, p<0.00001; Day 24, p=0.0005; Day 27, p=0.0044). Data are representative of 2 independent experiments. All data are presented as the mean values ± SEM. See also Figure S3.
Figure 3.
Figure 3.. ROR1 CAR-T cell-mediated toxicity is dependent on ROR1 expression in non-hematopoietic cells.
(A) Percent change in body weight (left), RBC count in peripheral blood (middle), and representative pictures of spleens 9 days post-transfer (right) from B6 Ror1fl/fl (WT) or EIIα-Cre+Ror1fl/fl (KO) mice treated with 500 R and control or ROR1 CAR-T cells. n=3 mice per group. Left: two-way ANOVA with Tukey post-test (WT+CAR-T vs. KO+CAR-T: Day 7,8,9, p<0.00001). Middle: one-way ANOVA with Tukey post-test (p=0.0003). (B) Percent change in body weight (left), RBC count in peripheral blood (middle), and representative pictures of spleens 15 days post-transfer (right) from WT>WT or ROR1-KO>WT BM chimeric mice treated with 500 R and control or ROR1 CAR-T cells. n=3 mice per group. Left: two-way ANOVA with Tukey post-test (WT>WT CAR-T vs. KO>WT CAR-T: n.s. = not significant). Middle: one-way ANOVA with Tukey post-test. (C) Percent change in body weight (left), RBC count in peripheral blood (middle), and representative pictures of spleens 40 days post-transfer (right) from WT>WT or WT>ROR1-KO BM chimeric mice treated with 500 R and control or ROR1 CAR-T cells. n=3 mice per group. Left: two-way ANOVA with Tukey post-test (WT>WT CAR-T vs. WT>KO CAR-T: Day 7, p=0.00013; Day 9, p=0.0045; Day 10,11, p<0.00001). Middle: one-way ANOVA with Tukey post-test (p=0.0044). Data are representative of 2 independent experiments. All data are presented as the mean values ± SEM.
Figure 4.
Figure 4.. Bone marrow stromal cells express ROR1 and are targeted by ROR1 CAR-T cells.
(A) qPCR analysis of Ror1 expression in sorted BM progenitors (left) and BM stromal cells (right) from BALB/c mice left untreated or irradiated 500 R 48 hr prior to euthanasia. Ror1 expression was normalized to Actb expression and expressed relative to Ror1 expression in E10.5 embryos. OBL = osteoblasts. MSC = mesenchymal stem cells. EC = endothelial cells. n=3 mice per group. (B) ELISA analysis of IFNγ production by CD8+ control or ROR1 CAR-T cells co-cultured for 48 hr with primary MSC derived from WT or ROR1-KO femurs and expanded in vitro for 14 days. Data are summarized from 3 independent experiments. Unpaired two-way Student’s t-test (p=0.0041). (C) Absolute number of cells in BM flushed from femurs and tibia of control or ROR1 CAR-T cell-treated mice 9 days post-transfer (left) and number of MSC, pre-B cell, granulocyte/macrophage, erythrocyte, and megakaryocyte colonies formed after culture of BM cells from femurs of control or ROR1 CAR-T cell-treated BALB/c mice collected 9 days post-transfer (right). n=3 mice per group. Unpaired two-way Student’s t-test (# BM cells, p=0.0004; MSC, p=0.0004; Pre-B, p=0.0023). (D) ELISA analysis of IFNγ production by CD8+ control or ROR1 CAR-T cells co-cultured for 48 hr with CD45+ or CD45splenic cells. Data are summarized from 3 independent experiments. Unpaired two-way Student’s t-test (p=0.0049). (E) qPCR analysis of Ror1 expression in splenic subpopulations sorted from BALB/c mice left untreated or irradiated 500 R 48 hr prior to euthanasia. n.d. = not detected. Data are summarized from 3 independent experiments. All data are presented as the mean values ± SEM.
Figure 5.
Figure 5.. SynNotch EpCAM-inducible ROR1 CAR-T cells selectively target EpCAM+ROR1+ cells but not EpCAM+ROR1 or EpCAMROR1+ cells in vitro.
(A) Representative flow cytometric analysis of EpCAM expression on 4T1 tumor cells, MSC, osteoblasts (OBL), CD45Ter119PDGFRβ+ spleen cells, and CD45Ter119VE-cadherin+ spleen cells from BALB/c mice. Percent lysis of the indicated 51Cr-labeled tumor cells after 6 hr (top) or 24 hr (bottom) of co-culture with CD8+ untransduced (black), ROR1 CAR-T cells (gray), or EpCAM-inducible ROR1 CAR-T cells (open circles). (C) Intracellular cytokine analysis of tCD19 CAR marker and IFNγ expression in the indicated T cells co-cultured with tumor cells in the presence of Brefeldin A for the last 6 hr of culture. Data are representative of two independent experiments. See also Figures S4 and S5.
Figure 6.
Figure 6.. SynNotch EpCAM-inducible ROR1 CAR-T cells rescue toxicity to ROR1+ normal tissues while maintaining activity against ROR1+ tumors.
(A) Percent change in body weight in BALB/c mice inoculated with 4T1-mROR1 tumors and treated as indicated. n=6–12 mice per group. Two-way ANOVA with Tukey post-test (ROR1-CAR vs. EpCAM-inducible ROR1 CAR: Day 4, p<0.0001; Day 7, p<0.0001; Day 10, p=0.0002). (B) RBC and PLT counts from peripheral blood of tumor-bearing mice treated as indicated. n=6–12 mice per group. Two-way ANOVA with Tukey post-test (ROR1-CAR vs. EpCAM-inducible ROR1 CAR: RBC Day 4,8,15,22:, p<0.0001; PLT Day 8 p=0.0114; PLT Day 15, 22, p<0.0001). (C) Representative pictures of spleens 10 days post-transfer from tumor-bearing BALB/c mice treated as indicated. (D) Tumor volume in BALB/c mice treated as indicated. n=6–12 mice per group. Two-way ANOVA with Tukey post-test (ROR1-CAR vs. UT: Day 14, p<0.0001; Day 17, p<0.0001; EpCAM-inducible ROR1 CAR vs. UT: Day 14, p<0.0001; Day 17, p<0.0001; ROR1-CAR vs EpCAM-inducible ROR1 CAR: n.s). (E) Survival of mice treated as indicated. n=6–12. Log-rank Mantel-Cox test (UT vs. ROR1 CAR, p=0.0003; UT vs. EpCAM-inducible ROR1 CAR, p=0.0016; ROR1 CAR vs. EpCAM-inducible ROR1 CAR, p=0.0001). (F) Representative flow cytometric analysis of ROR1 CAR and PD-1 expression on CD8+CD45.1+ donor T cells from mice treated with Cy and the indicated T cells 10 days post-transfer. (G) Summary of frequency of ROR1 CAR+, CAR+Ki67+, and CAR+PD-1+ T cells of CD8+CD45.1+ donor T cells from mice treated with Cy and the indicated T cells 10 days post-transfer. n=6–12 mice per group. Unpaired two-way Student’s t-test (Frequency: spleen, p<0.0001; BM, p<0.0001; PD-1: spleen, p=0.0004; BM, p=0.0003; Ki67: spleen, p<0.0001; BM, p<0.0001). Data are summarized from 2 independent experiments. All data are presented as the mean values ± SEM.
Figure 7.
Figure 7.. SynNotch CD19-inducible ROR1 CAR-T cells are unable to rescue toxicity to ROR1+ normal tissues in the presence of circulating and bone marrow-resident CD19+ROR1+ Raji tumors.
(A) Map of lentiviral constructs encoding CD19-Gal4VP64 synNotch Receptor, UAS inducible R11 ROR1 CAR, and constitutive R11 ROR1 CAR. (B) Raji tumor bioluminescence over time in NSG mice irradiated 250 R and treated with the indicated primary human T cells. n=6–7 per group. Two-way ANOVA with Tukey post-test (UT vs. ROR1 CAR-T: Day 13, 20, p<0.0001; UT vs. CD19-inducible ROR1 CAR-T: Day 13, 20, p<0.0001). (C) Summary of tEGFR CAR marker and PD-1 expression on the indicated donor CD8+CD45+ T cells in peripheral blood. n=4–7 per group. Two-way ANOVA with Tukey post-test (CAR: UT vs. ROR1 CAR, Day 3, 7, p<0.0001; ROR1 CAR vs. CD19-inducible ROR1 CAR, Day 3, p<0.0001; Day 7, n.s. PD-1: UT vs. ROR1 CAR, Day 3, 7, p<0.0001; ROR1 CAR vs. CD19-inducible ROR1 CAR, Day 3, p<0.0001; Day 7, n.s.). (D) Survival of tumor-bearing mice irradiated 250 R and treated with the indicated T cell groups. n=6–7 per group. Log-rank Mantel-Cox test (UT vs. ROR1 CAR, p=0.0007; UT vs. CD19-inducible ROR1 CAR, p=0.0007; ROR1 CAR vs. CD19-inducible ROR1 CAR, n.s.). Data are representative of 2 independent experiments. All data are presented as the mean values ± SEM. See also Figure S6.
Figure 8.
Figure 8.. Primary human synNotch B7-H3-inducible ROR1 CAR-T cells rescue toxicity to ROR1+ normal tissues while maintaining activity against human ROR1+ tumors.
(A) Percent change in body weight in NSG mice implanted with MDA-MB-231 tumors, irradiated 250 R and treated with the indicated primary human T cells. n=4 mice per group. Two-way ANOVA with Tukey post-test (ROR1-CAR vs. EpCAM-inducible ROR1 CAR: Day 13, 14, 19, p<0.0001). (B) RBC and PLT counts from peripheral blood of tumor-bearing mice treated as indicated 20 days post-T cell transfer. n=4 mice per group. Two-way ANOVA with Tukey post-test (RBC: ROR1 CAR vs. EpCAM-inducible ROR1 CAR, p=0.0426; UT vs. ROR1 CAR, p=0.0418. PLT: ROR1 CAR vs. EpCAM-inducible ROR1 CAR, p=0.0117; UT vs. ROR1 CAR, p=0.0442). (C and D) Tumor bioluminescence (C) and survival (D) of NSG mice treated as indicated. n=4 mice per group. Two-way ANOVA with Tukey post-test (ROR1 CAR vs. UT: Day 13, p=0.0167; Day 20, p<0.0001. EpCAM-inducible ROR1 CAR vs. UT: Day 13, p=0.0029; Day 20, p<0.0001. ROR1 CAR vs EpCAM-inducible ROR1 CAR: n.s). (E) Representative flow cytometric analysis of ROR1 CAR and Ki67 expression on CD8+CD45+ donor T cells from NSG mice irradiated 250 R and given indicated T cells 22 days post-transfer. (F) Summary of frequency of ROR1 CAR+, Ki67+, and PD-1+ T cells of CD8+CD45+ donor T cells from mice irradiated 250 R and given indicated T cells 22 days post-transfer. n=4 mice per group. Unpaired two-way Student’s t-test (Frequency: spleen, p<0.00001; BM, p<0.00001; tumor, n.s. Ki67: spleen, p<0.0001; BM, p<0.0001; tumor, n.s. PD-1: spleen, p<0.0001; BM, p<0.0001; tumor, n.s.). Data are representative of 2 independent experiments. All data are presented as the mean values ± SEM. See also Figures S7 and S8.

References

    1. Anthony BA, Link DC, 2014. Regulation of hematopoietic stem cells by bone marrow stromal cells. Trends Immunol 35, 32–37. 10.1016/j.it.2013.10.002 - DOI - PMC - PubMed
    1. Balakrishnan A, Goodpaster T, Randolph-Habecker J, Hoffstrom BG, Jalikis FG, Koch LK, Berger C, Kosasih PL, Rajan A, Sommermeyer D, Porter PL, Riddell SR, 2017. Analysis of ROR1 Protein Expression in Human Cancer and Normal Tissues. Clin. Cancer Res 23, 3061–3071. 10.1158/1078-0432.CCR-16-2083 - DOI - PMC - PubMed
    1. Berger C, Sommermeyer D, Hudecek M, Berger M, Balakrishnan A, Paszkiewicz PJ, Kosasih PL, Rader C, Riddell SR, 2015. Safety of targeting ROR1 in primates with chimeric antigen receptor-modified T cells. Cancer Immunol Res 3, 206–216. 10.1158/2326-6066.CIR-14-0163 - DOI - PMC - PubMed
    1. Bourquin C, Castoldi R, Endres S, Klein C, Kobold S, Niederfellner G, Sustmann C, Inc H-LR, 2015. Bispecific antibody molecules with antigen-transfected t-cells and their use in medicine
    1. Brudno JN, Kochenderfer JN, 2016. Toxicities of chimeric antigen receptor T cells: recognition and management. Blood 127, 3321–3330. 10.1182/blood-2016-04-703751 - DOI - PMC - PubMed

Publication types

MeSH terms

Substances