

Triheptanoin alters [U-13C6]-glucose incorporation into glycolytic intermediates and increases TCA cycling by normalizing the activities of pyruvate dehydrogenase and oxoglutarate dehydrogenase in a chronic epilepsy mouse model
- PMID: 30890077
- PMCID: PMC7026856
- DOI: 10.1177/0271678X19837380
Triheptanoin alters [U-13C6]-glucose incorporation into glycolytic intermediates and increases TCA cycling by normalizing the activities of pyruvate dehydrogenase and oxoglutarate dehydrogenase in a chronic epilepsy mouse model
Abstract
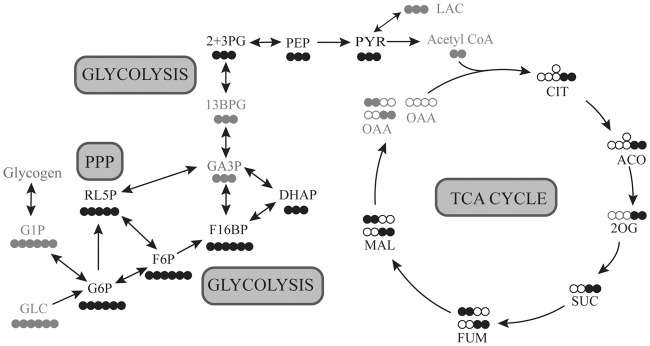
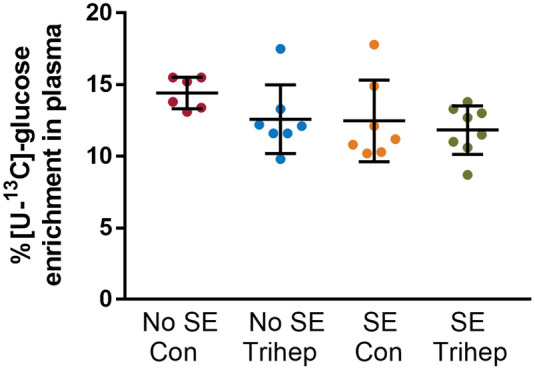
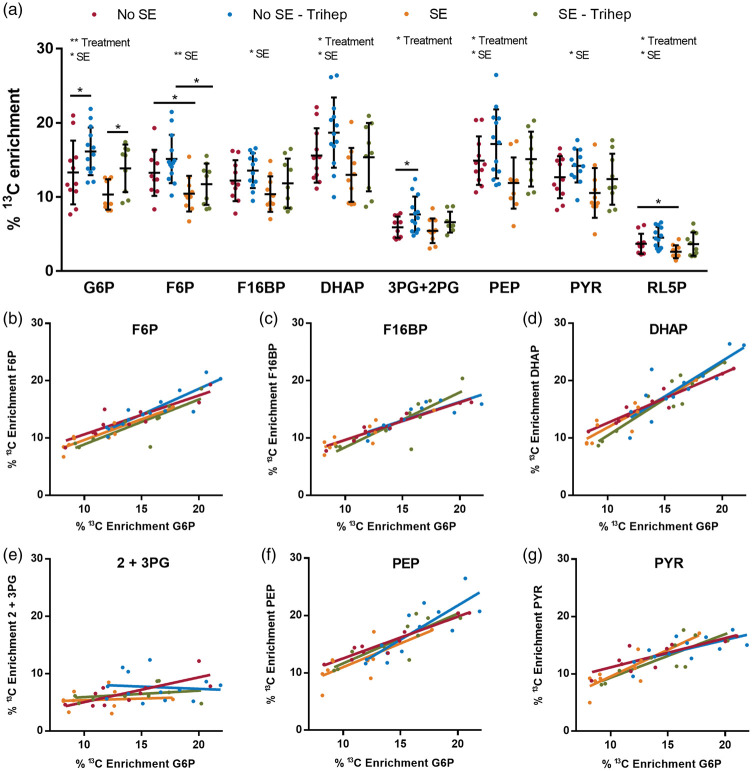
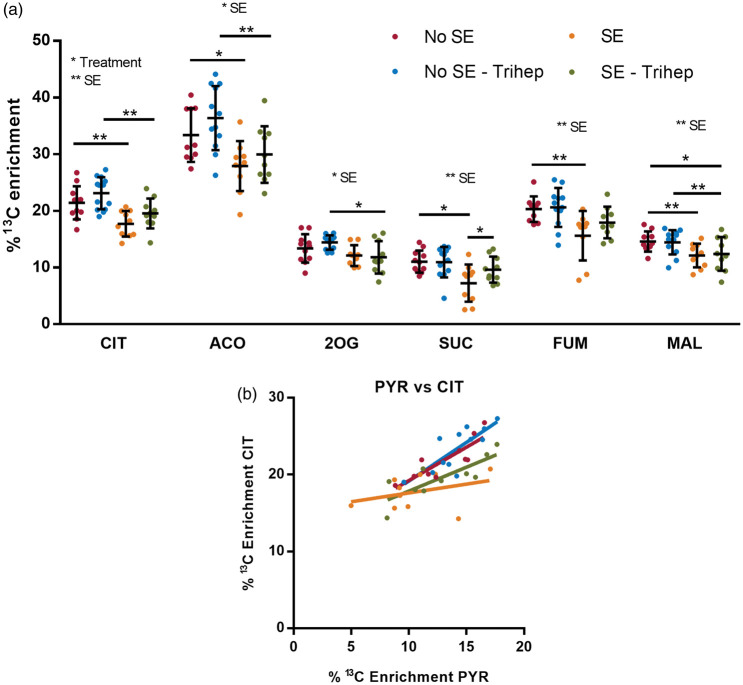
Triheptanoin is anticonvulsant in several seizure models. Here, we investigated changes in glucose metabolism by triheptanoin interictally in the chronic stage of the pilocarpine mouse epilepsy model. After injection of [U-13C6]-glucose (i.p.), enrichments of 13C in intermediates of glycolysis and the tricarboxylic acid (TCA) cycle were quantified in hippocampal extracts and maximal activities of enzymes in each pathway were measured. The enrichment of 13C glucose in plasma was similar across all groups. Despite this, we observed reductions in incorporation of 13C in several glycolytic intermediates compared to control mice suggesting glucose utilization may be impaired and/or glycogenolysis increased in the untreated interictal hippocampus. Triheptanoin prevented the interictal reductions of 13C incorporation in most glycolytic intermediates, suggesting it increased glucose utilization or - as an additional astrocytic fuel - it decreased glycogen breakdown. In the TCA cycle metabolites, the incorporation of 13C was reduced in the interictal state. Triheptanoin restored the correlation between 13C enrichments of pyruvate relative to most of the TCA cycle intermediates in "epileptic" mice. Triheptanoin also prevented the reductions of hippocampal pyruvate dehydrogenase and 2-oxoglutarate dehydrogenase activities. Decreased glycogen breakdown and increased glucose utilization and metabolism via the TCA cycle in epileptogenic brain areas may contribute to triheptanoin's anticonvulsant effects.
Keywords: Glucose metabolism; anaplerosis; medium chain fatty acid; pilocarpine; temporal lobe epilepsy.
Figures
Similar articles
-
Triheptanoin partially restores levels of tricarboxylic acid cycle intermediates in the mouse pilocarpine model of epilepsy.J Neurochem. 2014 Apr;129(1):107-19. doi: 10.1111/jnc.12610. Epub 2013 Dec 2. J Neurochem. 2014. PMID: 24236946
-
Alterations in Cytosolic and Mitochondrial [U-13C]Glucose Metabolism in a Chronic Epilepsy Mouse Model.eNeuro. 2017 Mar 9;4(1):ENEURO.0341-16.2017. doi: 10.1523/ENEURO.0341-16.2017. eCollection 2017 Jan-Feb. eNeuro. 2017. PMID: 28303258 Free PMC article.
-
Impaired hippocampal glucose metabolism during and after flurothyl-induced seizures in mice: Reduced phosphorylation coincides with reduced activity of pyruvate dehydrogenase.Epilepsia. 2017 Jul;58(7):1172-1180. doi: 10.1111/epi.13796. Epub 2017 Jun 20. Epilepsia. 2017. PMID: 28632902
-
Alternative Fuels in Epilepsy and Amyotrophic Lateral Sclerosis.Neurochem Res. 2017 Jun;42(6):1610-1620. doi: 10.1007/s11064-016-2106-7. Epub 2016 Nov 21. Neurochem Res. 2017. PMID: 27868154 Review.
-
Triheptanoin--a medium chain triglyceride with odd chain fatty acids: a new anaplerotic anticonvulsant treatment?Epilepsy Res. 2012 Jul;100(3):239-44. doi: 10.1016/j.eplepsyres.2011.05.023. Epub 2011 Aug 19. Epilepsy Res. 2012. PMID: 21855298 Free PMC article. Review.
Cited by
-
A novel LGI1 mutation causing autosomal dominant lateral temporal lobe epilepsy confirmed by a precise knock-in mouse model.CNS Neurosci Ther. 2022 Feb;28(2):237-246. doi: 10.1111/cns.13761. Epub 2021 Nov 12. CNS Neurosci Ther. 2022. PMID: 34767694 Free PMC article.
-
Heptanoic and medium branched-chain fatty acids as anaplerotic treatment for medium chain acyl-CoA dehydrogenase deficiency.Mol Genet Metab. 2023 Nov;140(3):107689. doi: 10.1016/j.ymgme.2023.107689. Epub 2023 Aug 25. Mol Genet Metab. 2023. PMID: 37660571 Free PMC article.
-
Open-label long-term treatment of add-on triheptanoin in adults with drug-resistant epilepsy.Epilepsia Open. 2020 Apr 12;5(2):230-239. doi: 10.1002/epi4.12391. eCollection 2020 Jun. Epilepsia Open. 2020. PMID: 32524048 Free PMC article.
-
Metabolic aspects of genetic ion channel epilepsies.J Neurochem. 2024 Dec;168(12):3911-3935. doi: 10.1111/jnc.15938. Epub 2023 Aug 18. J Neurochem. 2024. PMID: 37594756 Free PMC article. Review.
-
Randomized trial of add-on triheptanoin vs medium chain triglycerides in adults with refractory epilepsy.Epilepsia Open. 2019 Feb 22;4(1):153-163. doi: 10.1002/epi4.12308. eCollection 2019 Mar. Epilepsia Open. 2019. PMID: 30868125 Free PMC article.
References
-
- Gama IR, Trindade-Filho EM, Oliveira SL, et al.Effects of ketogenic diets on the occurrence of pilocarpine-induced status epilepticus of rats. Metab Brain Dis 2015; 30: 93–98. - PubMed
-
- Kim TH, Borges K, Petrou S, et al.Triheptanoin reduces seizure susceptibility in a syndrome-specific mouse model of generalized epilepsy. Epilepsy Res 2013; 103: 101–105. - PubMed
-
- Brunengraber H, Roe CR. Anaplerotic molecules: current and future. J Inherit Metab Dis 2006; 29: 327–331. - PubMed
Publication types
MeSH terms
Substances
LinkOut - more resources
Full Text Sources
Medical
