. 2019 Mar 19;19(1):64.
doi: 10.1186/s12874-019-0681-4.

Machine learning in medicine: a practical introduction

Affiliations

Machine learning in medicine: a practical introduction

Jenni A M Sidey-Gibbons et al. BMC Med Res Methodol. .

Abstract

Background: Following visible successes on a wide range of predictive tasks, machine learning techniques are attracting substantial interest from medical researchers and clinicians. We address the need for capacity development in this area by providing a conceptual introduction to machine learning alongside a practical guide to developing and evaluating predictive algorithms using freely-available open source software and public domain data.

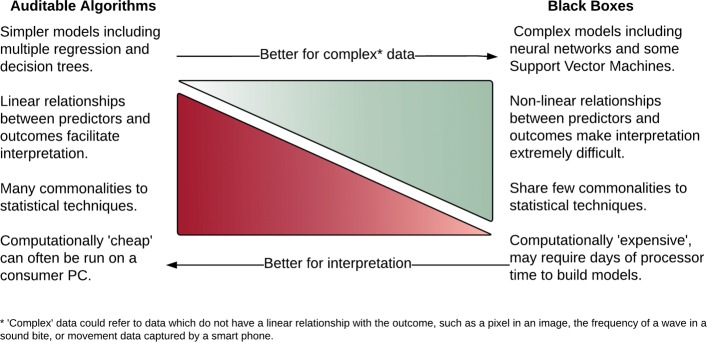
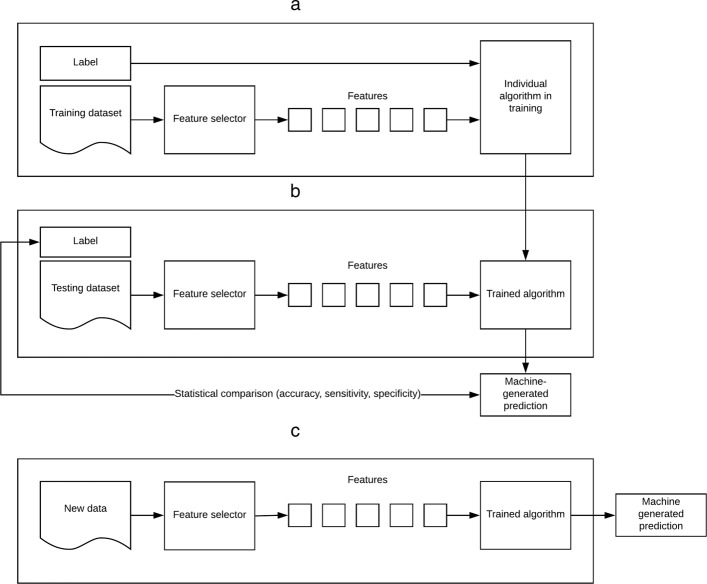
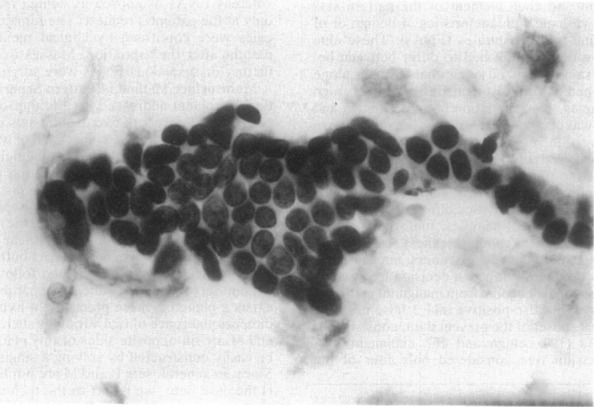
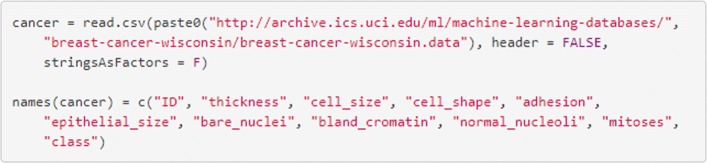
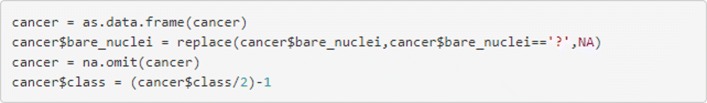
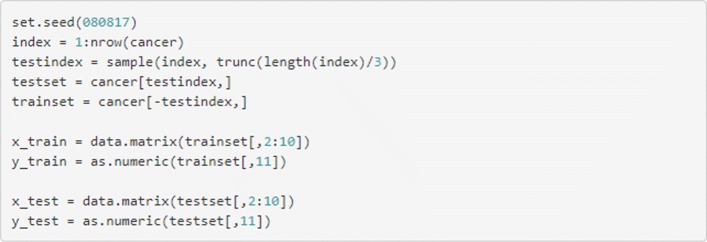
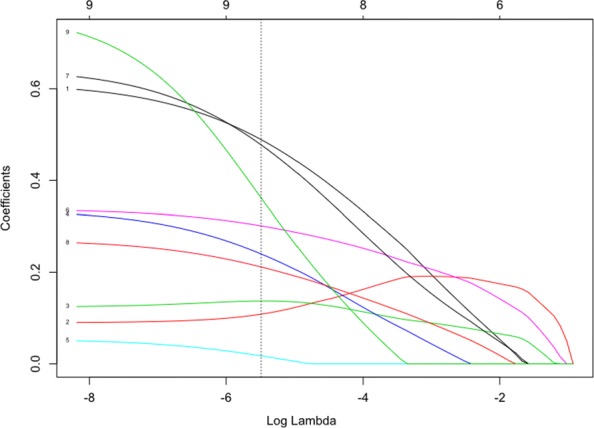
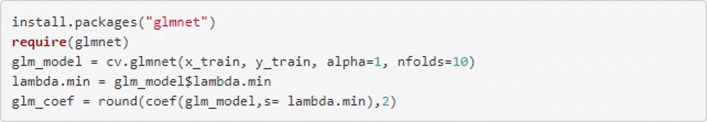
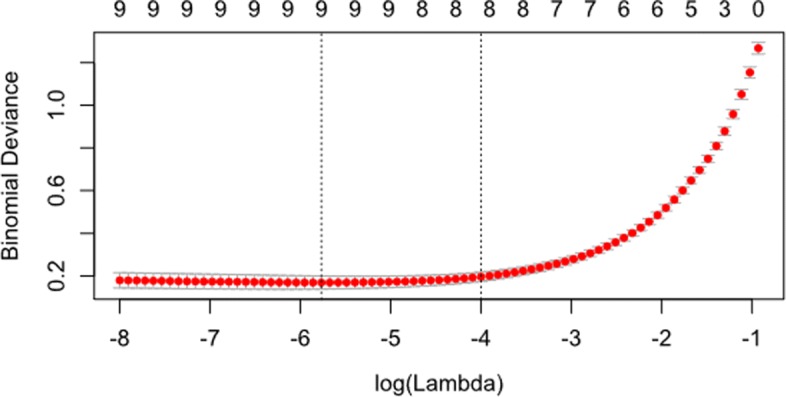
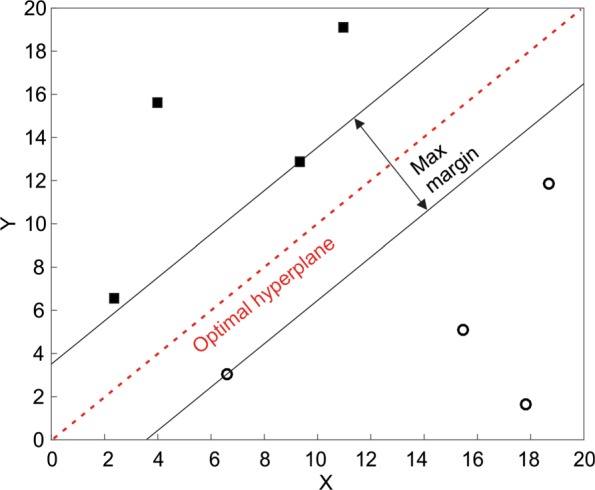
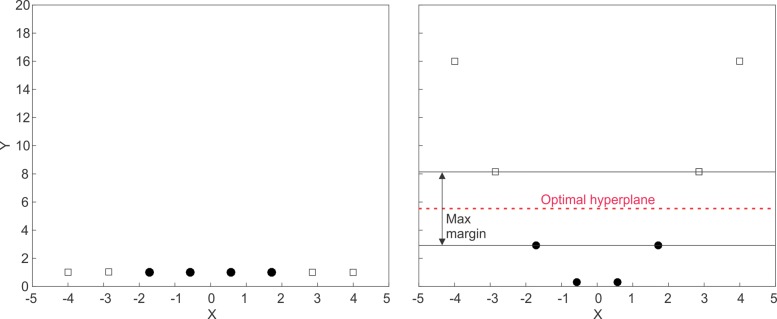
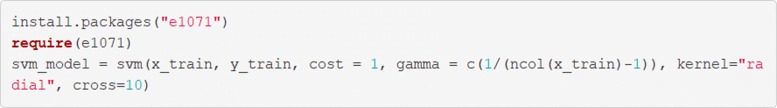
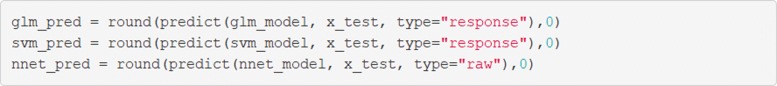
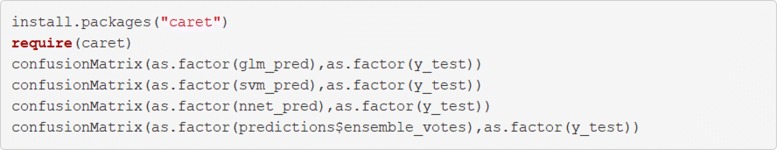
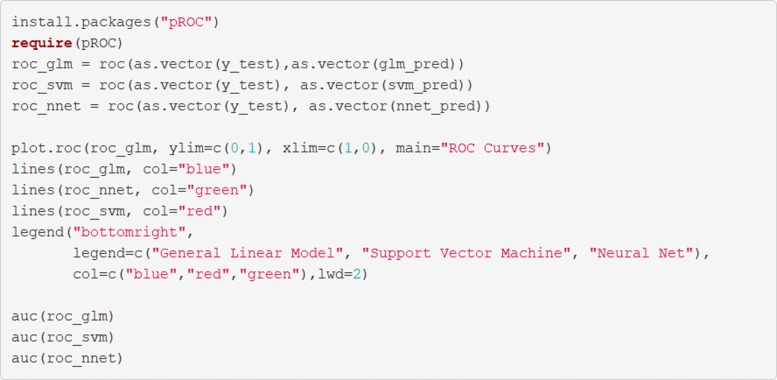
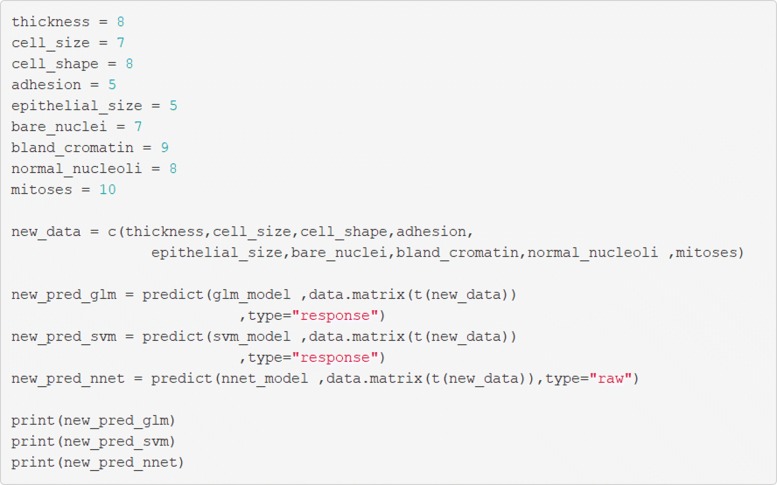
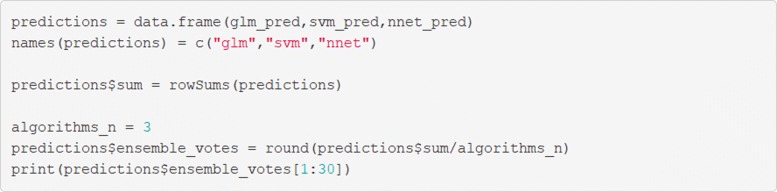
Methods: We demonstrate the use of machine learning techniques by developing three predictive models for cancer diagnosis using descriptions of nuclei sampled from breast masses. These algorithms include regularized General Linear Model regression (GLMs), Support Vector Machines (SVMs) with a radial basis function kernel, and single-layer Artificial Neural Networks. The publicly-available dataset describing the breast mass samples (N=683) was randomly split into evaluation (n=456) and validation (n=227) samples. We trained algorithms on data from the evaluation sample before they were used to predict the diagnostic outcome in the validation dataset. We compared the predictions made on the validation datasets with the real-world diagnostic decisions to calculate the accuracy, sensitivity, and specificity of the three models. We explored the use of averaging and voting ensembles to improve predictive performance. We provide a step-by-step guide to developing algorithms using the open-source R statistical programming environment.

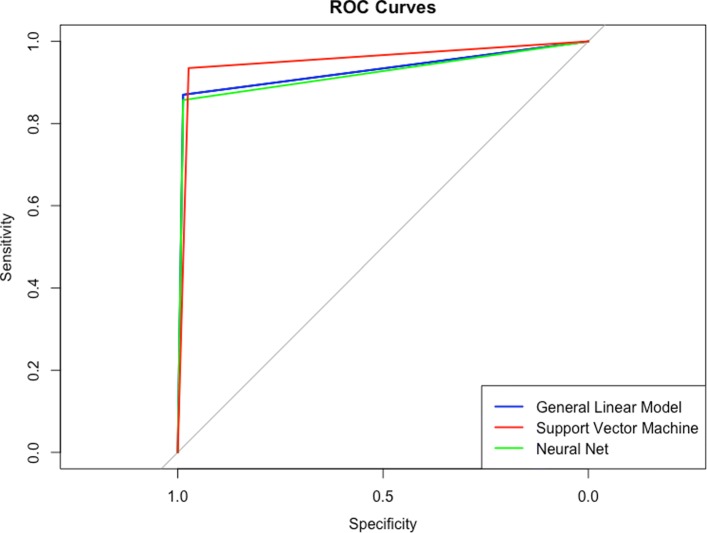
Results: The trained algorithms were able to classify cell nuclei with high accuracy (.94 -.96), sensitivity (.97 -.99), and specificity (.85 -.94). Maximum accuracy (.96) and area under the curve (.97) was achieved using the SVM algorithm. Prediction performance increased marginally (accuracy =.97, sensitivity =.99, specificity =.95) when algorithms were arranged into a voting ensemble.

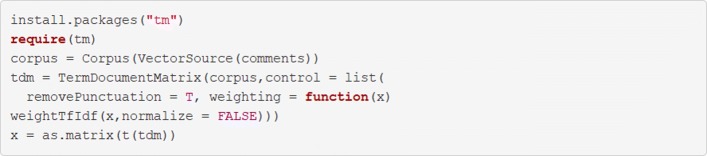
Conclusions: We use a straightforward example to demonstrate the theory and practice of machine learning for clinicians and medical researchers. The principals which we demonstrate here can be readily applied to other complex tasks including natural language processing and image recognition.

Keywords: Classification; Computer-assisted; Decision making; Diagnosis; Medical informatics; Programming languages; Supervised machine learning.


Conflict of interest statement

Ethics approval and consent to participate

In this manuscript we use de-identified data from a public repository [17]. The data are included on the BMC Med Res Method website. As such, ethical approval was not required.

Consent for publication

All contributing parties consent for the publication of this work.

Competing interests

The authors report no competing interests relating to this work.

Publisher’s Note

Springer Nature remains neutral with regard to jurisdictional claims in published maps and institutional affiliations.

Figures

Fig. 1
Fig. 1
The complexity/interpretability trade-off in machine learning tools
Fig. 2
Fig. 2
Overview of supervised learning. a Training b Validation c Application of algorithm to new data
Fig. 3
Fig. 3
A visual illustration of an unsupervised dimension reduction technique
Fig. 4
Fig. 4
An example of an image of a breast mass from which dataset features were extracted
Fig. 5
Fig. 5
Import the data and label the columns
Fig. 6
Fig. 6
Remove missing items and restore the outcome data
Fig. 7
Fig. 7
Split the data into training and testing datasets
Fig. 8
Fig. 8
Regression coefficients for the GLM model. The figure shows the coefficients for the 9 model features for different values of log(λ). log(λ) values are given on the lower x-axis and number of features in the model are displayed above the figure. As the size of log(λ) decreases the number of variables in the model (i.e. those with a nonzero coefficient) increases as does the magnitude of each feature. The vertical dotted line indicates the value of log(λ) at which the accuracy of the predictions is maximized
Fig. 9
Fig. 9
Fit the GLM model to the data and extract the coefficients and minimum value of lambda
Fig. 10
Fig. 10
Cross-validation curves for the GLM model. The figure shows the cross-validation curves as the red dots with upper and lower standard deviation shown as error bars
Fig. 11
Fig. 11
Plot the cross-validation curves for the GLM algorithm
Fig. 12
Fig. 12
Plot the coefficients and their magnitudes
Fig. 13
Fig. 13
A SVM Hyperplane The hyperplane maximises the width of the decision boundary between the two classes
Fig. 14
Fig. 14
The kernel trick The kernel trick modifies the feature space allowing separation of the classes with a linear hyperplane
Fig. 15
Fig. 15
Fit the SVM algorithm to the data
Fig. 16
Fig. 16
Fit the ANN algorithm to the data
Fig. 17
Fig. 17
Extract predictions from the trained models on the new data
Fig. 18
Fig. 18
Create confusion matrices for the three algorithms
Fig. 19
Fig. 19
Draw received operating curves and calculate the area under them
Fig. 20
Fig. 20
Receiver Operating Characteristics curves
Fig. 21
Fig. 21
Apply new data to the trained and validated algorithm
Fig. 22
Fig. 22
Create predictions from the ensemble
Fig. 23
Fig. 23
Create a term document matrix

References

    1. Jordan MI, Mitchell TM. Machine learning: Trends, perspectives, and prospects. Sci (NY) 2015;349(6245):255–60. doi: 10.1126/science.aaa8415. - DOI - PubMed
    1. Esteva A, Kuprel B, Novoa RA, Ko J, Swetter SM, Blau HM, Thrun S. Dermatologist-level classification of skin cancer with deep neural networks. Nature. 2017;542(7639):115–8. doi: 10.1038/nature21056. - DOI - PMC - PubMed
    1. Anderson J, Parikh J, Shenfeld D. Reverse Engineering and Evaluation of Prediction Models for Progression to Type 2 Diabetes: Application of Machine Learning Using Electronic Health Records. J Diabetes. 2016. - PMC - PubMed
    1. Ong M-S, Magrabi F, Coiera E. Automated identification of extreme-risk events in clinical incident reports. J Am Med Inform Assoc. 2012;19(e1):e110–e18. doi: 10.1136/amiajnl-2011-000562. - DOI - PMC - PubMed
    1. Greaves F, Ramirez-Cano D, Millett C, Darzi A, Donaldson L. Use of sentiment analysis for capturing patient experience from free-text comments posted online, J Med Internet Res. 2013;15(11):239. doi: 10.2196/jmir.2721. - DOI - PMC - PubMed

Publication types