

Quantifying heterogeneous contact patterns in Japan: a social contact survey
- PMID: 30890153
- PMCID: PMC6425701
- DOI: 10.1186/s12976-019-0102-8
Quantifying heterogeneous contact patterns in Japan: a social contact survey
Abstract
Background: Social contact surveys can greatly help in quantifying the heterogeneous patterns of infectious disease transmission. The present study aimed to conduct a contact survey in Japan, offering estimates of contact by age and location and validating a social contact matrix using a seroepidemiological dataset of influenza.
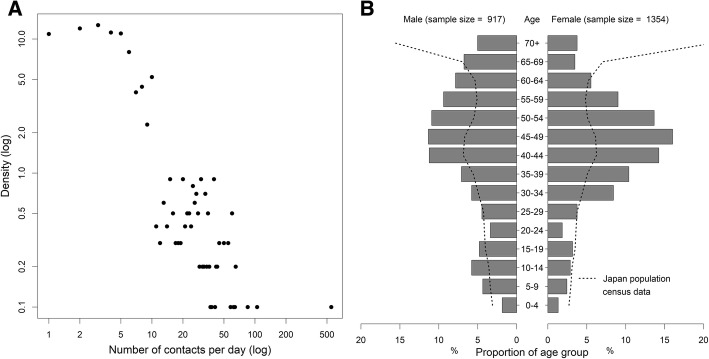
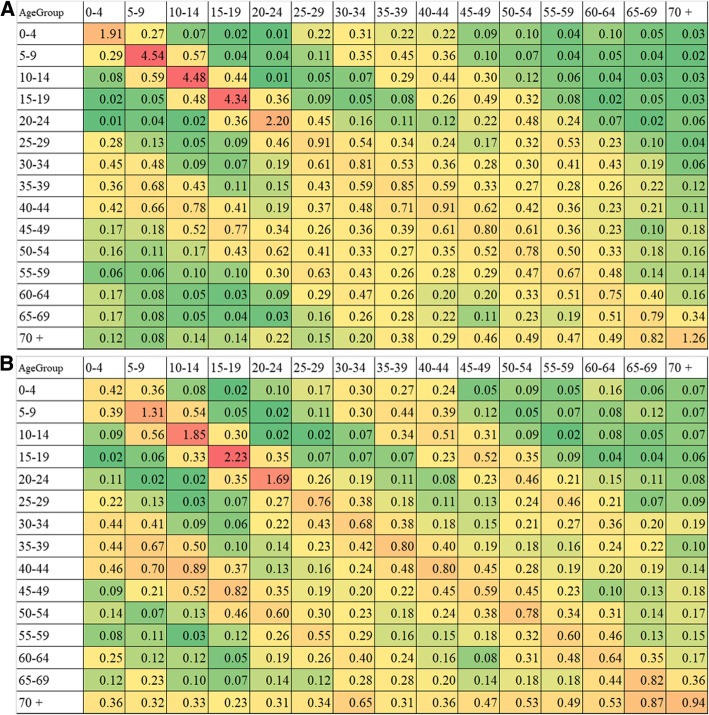
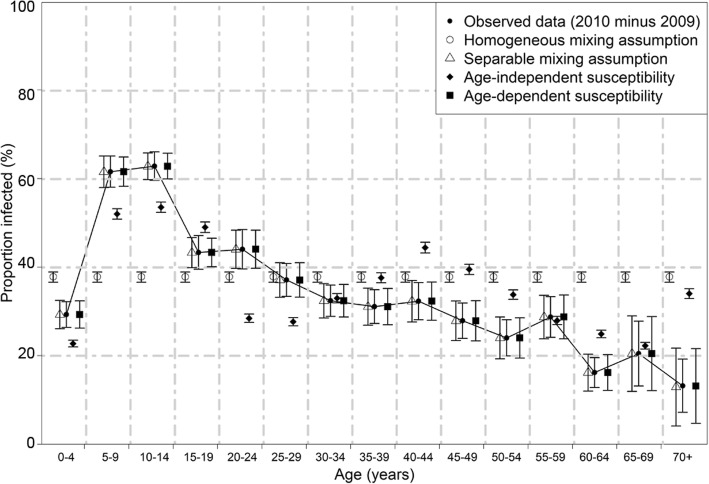
Methods: An internet-based questionnaire survey was conducted, covering all 47 prefectures in Japan and including a total of 1476 households. The social contact matrix was quantified assuming reciprocity and using the maximum likelihood method. By imposing several parametric assumptions for the next-generation matrix, the empirical seroepidemiological data of influenza A (H1N1) 2009 was analysed and we estimated the basic reproduction number, R0.
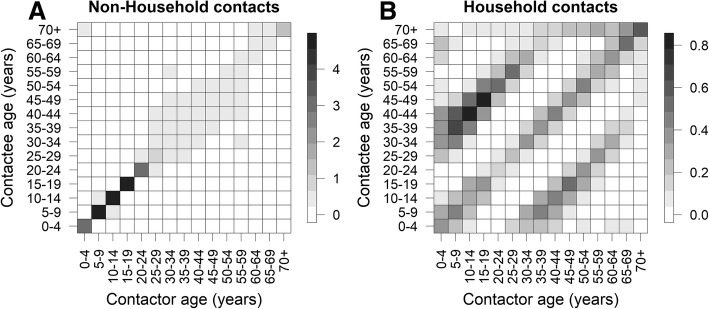
Results: In total, the reported number of contacts on weekdays was 10,682 whereas that on weekend days was 8867. Strong age-dependent assortativity was identified. Forty percent of weekday contacts took place at schools or workplaces, but that declined to 14% on weekends. Accounting for the age-dependent heterogeneity with the known social contact matrix, the minimum value of the Akaike information criterion was obtained and R0 was estimated at 1.45 (95% confidence interval: 1.42, 1.49).
Conclusions: Survey datasets will be useful for parameterizing the heterogeneous transmission model of various directly transmitted infectious diseases in Japan. Age-dependent assortativity, especially among children, along with numerous contacts in school settings on weekdays implies the potential effectiveness of school closure.
Keywords: Cumulative incidence; Epidemic; Epidemiological model; Influenza; Mathematical model.
Conflict of interest statement
Authors’ information
The authors are experts with an interest in infectious disease epidemiology and also theoretical epidemiology, and the corresponding author is the chairperson and team leader of the Department of Hygiene, Hokkaido University Graduate School of Medicine.
Ethics approval and consent to participate
The purpose of the study was explained to participants and they were ensured that the extent of use of the survey information was limited to the present study. Informed consent was obtained via the internet webpage, and participants had the right to withdraw at any time during the study period. The Medical Ethics Committees at the Graduate School of Medicine, The University of Tokyo approved this study (approval ID: 10478). As for the seroepidemiological data, we used publicly available data in the present study [28]. The datasets had already been fully anonymized and did not include any identifiable information. Thus, ethical approval was not required for the analysis of seroepidemiological data.
Consent for publication
Not applicable – all details relating to participants were de-identified prior to inclusion in this study.
Competing interests
The authors declare that co-author H. Nishiura is the Editor-in-Chief of
Publisher’s Note
Springer Nature remains neutral with regard to jurisdictional claims in published maps and institutional affiliations.
Figures
References
-
- Farrington CP, Kanaan MN, Gay NJ. Estimation of the basic reproduction number for infectious diseases from age-stratified serological survey data. J R Stat Soc Ser C. 2001;50:251–292. doi: 10.1111/1467-9876.00233. - DOI
Publication types
MeSH terms
LinkOut - more resources
Full Text Sources
Medical
