. 2019 Mar 19;20(1):59.
doi: 10.1186/s13059-019-1663-x.

PAGA: graph abstraction reconciles clustering with trajectory inference through a topology preserving map of single cells

Affiliations

PAGA: graph abstraction reconciles clustering with trajectory inference through a topology preserving map of single cells

F Alexander Wolf et al. Genome Biol. .

Abstract

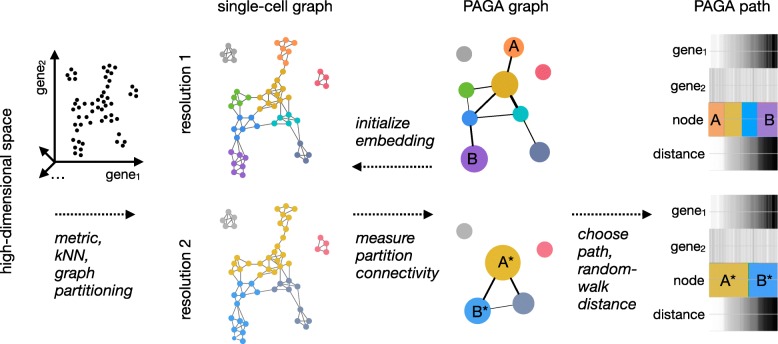
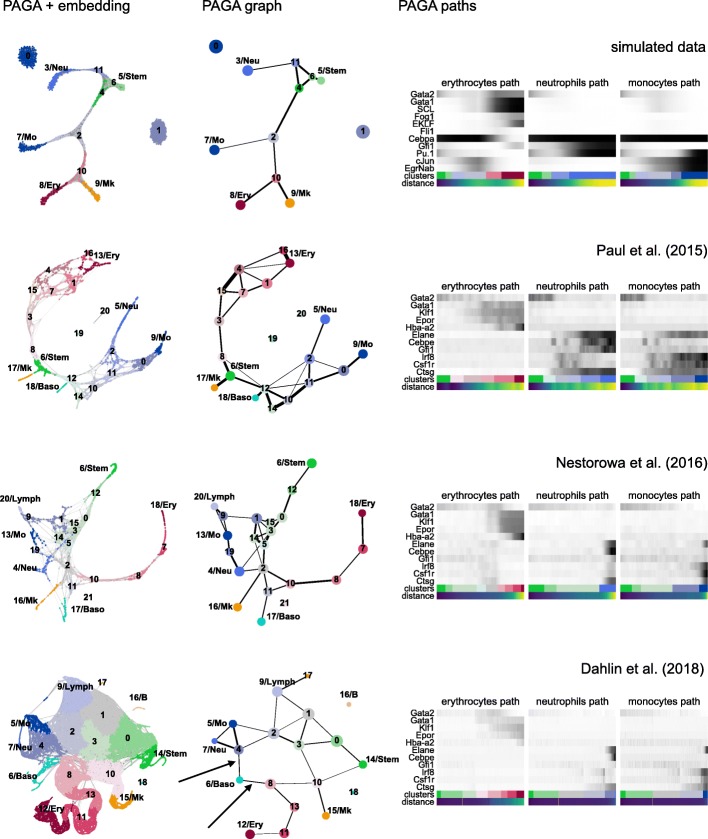
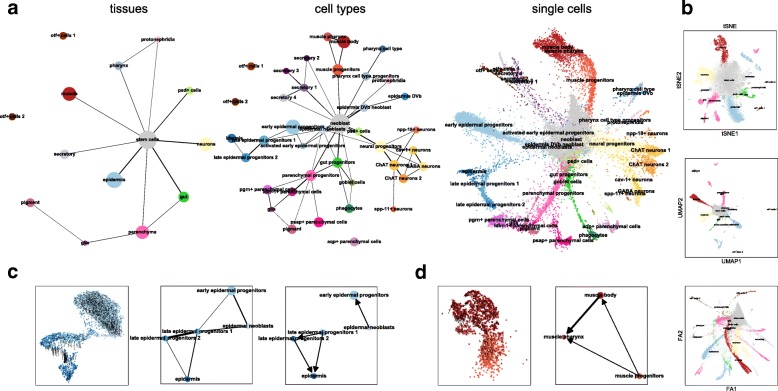
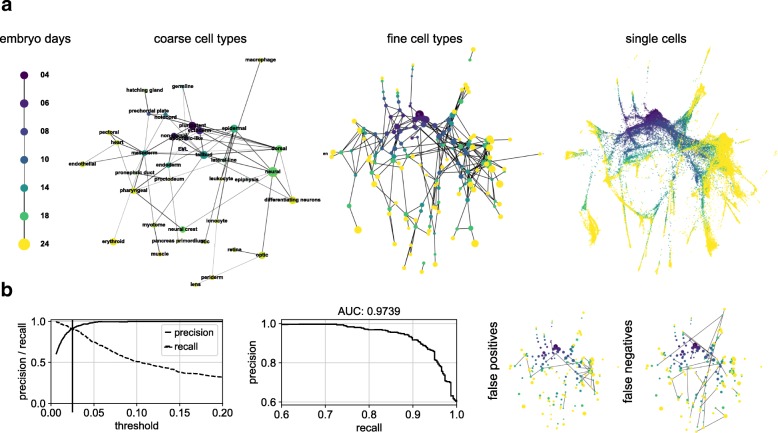
Single-cell RNA-seq quantifies biological heterogeneity across both discrete cell types and continuous cell transitions. Partition-based graph abstraction (PAGA) provides an interpretable graph-like map of the arising data manifold, based on estimating connectivity of manifold partitions ( https://github.com/theislab/paga ). PAGA maps preserve the global topology of data, allow analyzing data at different resolutions, and result in much higher computational efficiency of the typical exploratory data analysis workflow. We demonstrate the method by inferring structure-rich cell maps with consistent topology across four hematopoietic datasets, adult planaria and the zebrafish embryo and benchmark computational performance on one million neurons.


Conflict of interest statement

Ethics approval and consent to participate

Not applicable.

Consent for publication

Not applicable.

Competing interests

The authors declare that they have no competing interests.

Publisher’s Note

Springer Nature remains neutral with regard to jurisdictional claims in published maps and institutional affiliations.

Figures

Fig. 1
Fig. 1
Partition-based graph abstraction generates a topology-preserving map of single cells. High-dimensional gene expression data is represented as a kNN graph by choosing a suitable low-dimensional representation and an associated distance metric for computing neighborhood relations—in most of the paper, we use PCA-based representations and Euclidean distance. The kNN graph is partitioned at a desired resolution where partitions represent groups of connected cells. For this, we usually use the Louvain algorithm, however, partitions can be obtained in any other way, too. A PAGA graph is obtained by associating a node with each partition and connecting each node by weighted edges that represent a statistical measure of connectivity between partitions, which we introduce in the present paper. By discarding spurious edges with low weights, PAGA graphs reveal the denoised topology of the data at a chosen resolution and reveal its connected and disconnected regions. Combining high-confidence paths in the PAGA graph with a random-walk-based distance measure on the single-cell graph, we order cells within each partition according to their distance from a root cell. A PAGA path then averages all single-cell paths that pass through the corresponding groups of cells. This allows to trace gene expression changes along complex trajectories at single-cell resolution
Fig. 2
Fig. 2
PAGA consistently predicts developmental trajectories and gene expression changes across datasets for hematopoiesis. The three columns correspond to PAGA-initialized single-cell embeddings, PAGA graphs, and gene changes along PAGA paths. The four rows of panels correspond to simulated data (Additional file 1: Note 5) and data from Paul et al. [24], Nestorowa et al. [25], and Dahlin et al. [26], respectively. The arrows in the last row mark the two trajectories to basophils. One observes both consistent topology of PAGA graphs and consistent gene expression changes along PAGA paths for 5 erythroid, 3 neutrophil, and 3 monocyte marker genes across all datasets. The cell type abbreviations are as follows: Stem for stem cells, Ery for erythrocytes, Mk for megakaryocytes, Neu for neutrophils, Mo for monocytes, Baso for basophils, B for B cells, Lymph for lymphocytes
Fig. 3
Fig. 3
PAGA applied to a whole adult animal. a PAGA graphs for data for the flatworm Schmidtea mediterranea [13] at tissue, cell type, and single-cell resolution. We obtained a topologically meaningful embedding by initializing a single-cell embedding with the embedding of the cell-type PAGA graph. Note that the PAGA graph is the same as in Reference [13], only that here, we neither highlight a tree subgraph nor used the corresponding tree layout for visualization. b Established manifold learning for the same data violate the topological structure. c, d Predictions of RNA velocity evaluated with PAGA for two example lineages: epidermis and muscle. We show the RNA velocity arrows plotted on a single-cell embedding, the standard PAGA graph representing the topological information (only epidermis), and the PAGA graph representing the RNA velocity information
Fig. 4
Fig. 4
PAGA applied to zebrafish embryo data of Wagner et al. [30]. a PAGA graphs obtained after running PAGA on partitions corresponding to embryo days, coarse cell types, more fine-grained cell types, and a PAGA-initialized single-cell embedding. Cell type assignments are from the original publication. b Performance measurements of the PAGA prediction compared to the reference graph of Wagner et al. show high accuracy. False-positive edges and false-negative edges for the threshold indicated by a vertical line in the left panel are also shown

References

    1. Wagner A, Regev A, Yosef N. Revealing the vectors of cellular identity with single-cell genomics. Nat Biotechnol. 2016;34(11):1145–60. doi: 10.1038/nbt.3711. - DOI - PMC - PubMed
    1. Trapnell C, Cacchiarelli D, Grimsby J, Pokharel P, Li S, Morse M, Lennon NJ, Livak KJ, Mikkelsen T. S, Rinn JL. The dynamics and regulators of cell fate decisions are revealed by pseudotemporal ordering of single cells. Nat Biotechnol. 2014;32(4):381–6. doi: 10.1038/nbt.2859. - DOI - PMC - PubMed
    1. Bendall SC, Davis KL, Amir E-aD, Tadmor MD, Simonds EF, Chen TJ, Shenfeld DK, Nolan GP, Pe’er D. Single-cell trajectory detection uncovers progression and regulatory coordination in human B cell development. Cell. 2014;157(3):714–25. doi: 10.1016/j.cell.2014.04.005. - DOI - PMC - PubMed
    1. Saelens W, Cannoodt R, Todorov H, Saeys Y. A comparison of single-cell trajectory inference methods: towards more accurate and robust tools. bioRxiv. 2018;:276907. 10.1101/276907.
    1. Qiu X, Hill A, Packer J, Lin D, Ma YA, Trapnell C. Single-cell mRNA quantification and differential analysis with census. Nat Methods. 2017;14:309–15. doi: 10.1038/nmeth.4150. - DOI - PMC - PubMed

Publication types

MeSH terms